
Key Insights
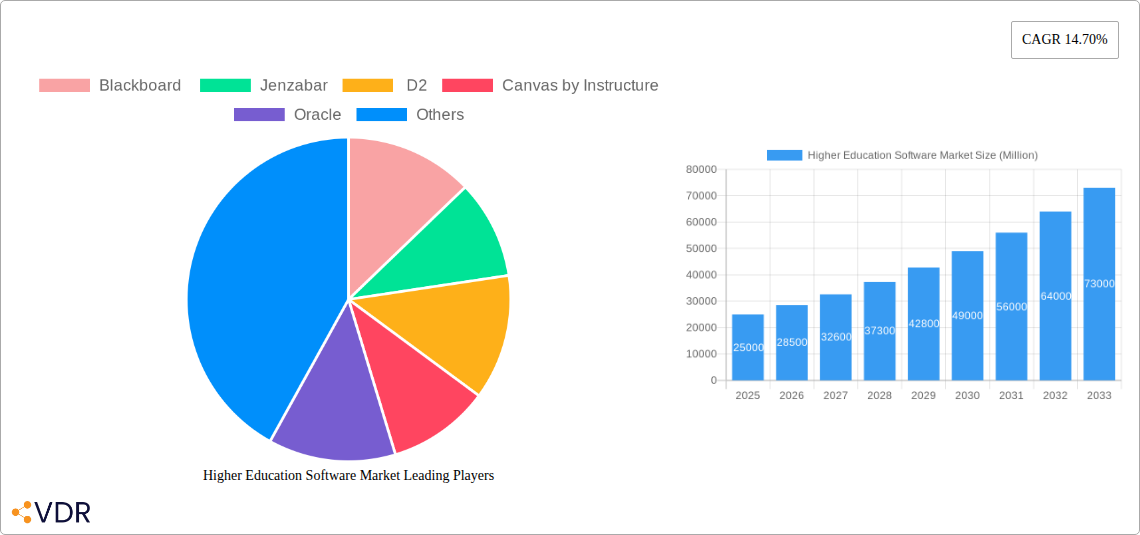
The Higher Education Software market is experiencing robust growth, projected to reach a significant size by 2033. A compound annual growth rate (CAGR) of 14.70% from 2019 to 2025 indicates strong market momentum driven by several key factors. The increasing adoption of cloud-based solutions enhances accessibility, scalability, and cost-effectiveness for universities and colleges, fueling market expansion. Furthermore, the rising demand for advanced analytics and reporting tools to improve student outcomes and institutional efficiency is a major driver. The market is segmented by software type (including Learning Management Systems (LMS) like Blackboard and Canvas, Student Information Systems (SIS), and specialized software for workflows and analytics), service type (implementation, training, and consulting), and end-user (universities, colleges, community colleges, and other institutions). The North American market currently holds a substantial share, driven by early adoption and mature technological infrastructure. However, regions like Asia Pacific are demonstrating rapid growth, fueled by increasing investment in educational technology and expanding digital infrastructure. Competitive landscape analysis reveals key players such as Blackboard, Canvas, Ellucian, and others actively innovating and expanding their service offerings to cater to the evolving needs of the higher education sector.
The market's growth trajectory is expected to continue through 2033, albeit potentially with some moderation in the CAGR after 2025 as the market matures. Factors such as budgetary constraints faced by certain institutions, integration complexities with existing systems, and the need for continuous staff training could act as potential restraints. However, ongoing technological advancements, increased focus on personalized learning, and the growing adoption of innovative pedagogical approaches will likely offset these challenges and sustain the overall market growth. The continued focus on data analytics to inform strategic decision-making and optimize resource allocation within educational institutions will significantly shape the future direction of the Higher Education Software market.
Higher Education Software Market Report: 2019-2033
This comprehensive report provides an in-depth analysis of the Higher Education Software market, projecting robust growth from 2025 to 2033. We delve into market dynamics, growth trends, regional dominance, product innovation, and key player strategies. This report is essential for industry professionals, investors, and strategists seeking a clear understanding of this evolving landscape. The report covers the parent market of Educational Software and the child market of Higher Education Software, providing a granular view of market segmentation and competitive dynamics.
Higher Education Software Market Dynamics & Structure
The Higher Education Software market is characterized by a moderately concentrated landscape with key players like Blackboard, Jenzabar, D2L, Canvas by Instructure, Oracle, Workday, Ellucian, Unit4, SAP, and Instructure vying for market share. The market is driven by technological innovations such as AI-powered learning platforms, personalized learning tools, and cloud-based solutions. Regulatory frameworks, particularly concerning data privacy and accessibility, significantly influence market dynamics. Competitive substitutes include open-source learning management systems and traditional teaching methods, while mergers and acquisitions (M&A) are reshaping the competitive landscape. The market is segmented by software type (LMS, SIS, ERP, etc.), services (implementation, training, and support), and end-users (Universities, Colleges, Community Colleges, and others).
- Market Concentration: Moderately concentrated, with the top 5 players holding an estimated xx% market share in 2025.
- Technological Drivers: AI-powered learning, cloud computing, personalized learning platforms.
- Regulatory Frameworks: GDPR, FERPA, and other data privacy regulations are key considerations.
- M&A Activity: An estimated xx M&A deals in the higher education software sector occurred between 2019 and 2024.
- Innovation Barriers: High initial investment costs, integration complexities, and resistance to change within educational institutions.
- End-User Demographics: The increasing adoption of technology in higher education, coupled with the rise in online learning, is fueling market growth.
Higher Education Software Market Growth Trends & Insights
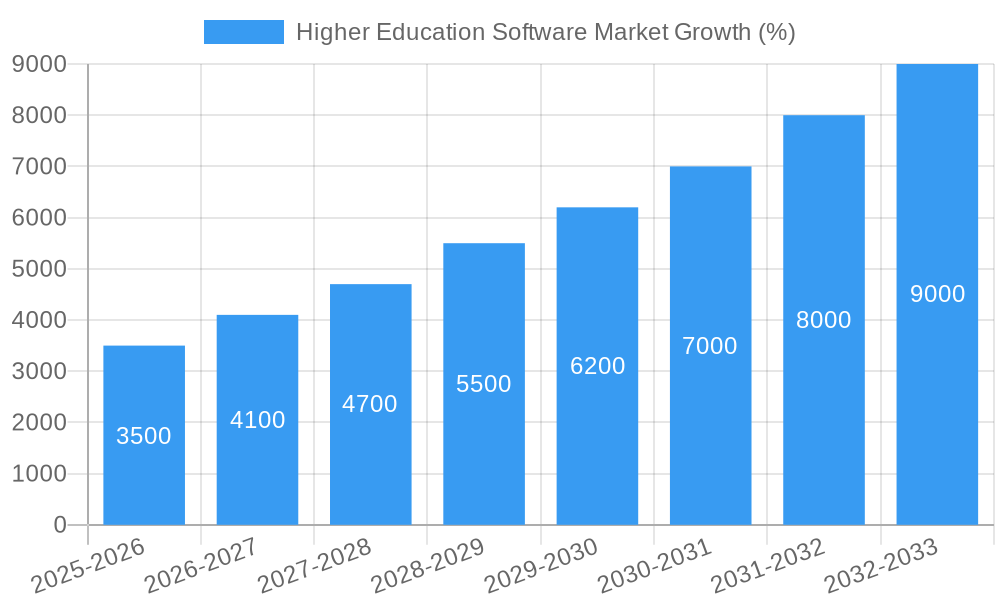
The Higher Education Software market experienced significant growth during the historical period (2019-2024), with a CAGR of xx%. The market size reached xx million in 2025 and is projected to reach xx million by 2033, exhibiting a CAGR of xx% during the forecast period (2025-2033). This growth is driven by increasing demand for efficient administrative systems, enhanced student engagement tools, and the need for seamless data integration across various departments within educational institutions. The adoption of cloud-based solutions is also a major factor contributing to market expansion. Consumer behavior shifts, such as a preference for personalized and flexible learning experiences, are driving demand for innovative software solutions.
Dominant Regions, Countries, or Segments in Higher Education Software Market
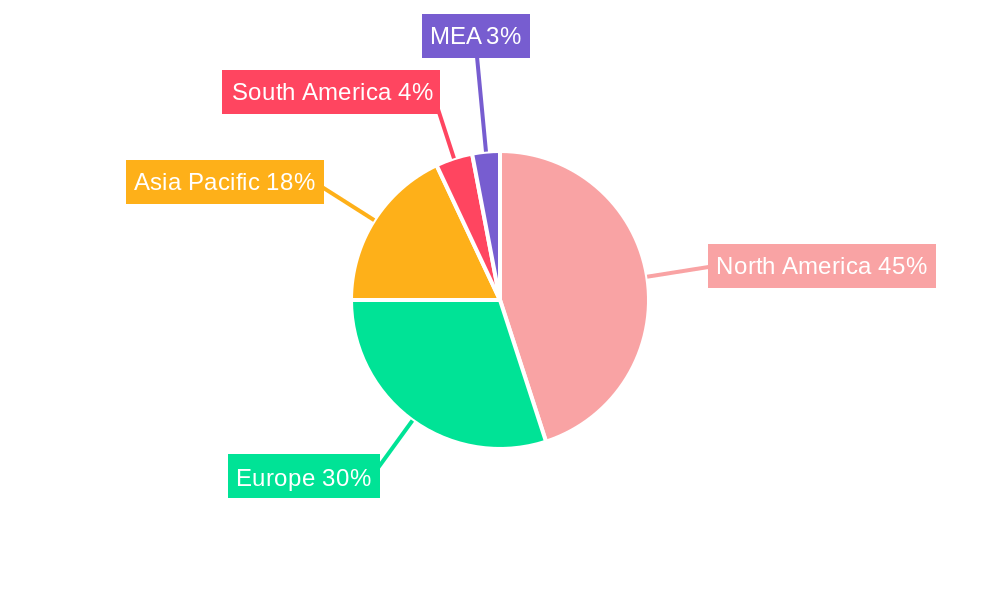
North America currently dominates the Higher Education Software market, holding the largest market share in 2025, followed by Europe and Asia-Pacific. The high adoption rate of technology in North American universities and colleges, coupled with significant investments in educational technology, contributes to this dominance. Within the segments, the Software segment holds the largest market share, driven by increasing demand for LMS, SIS, and ERP systems. Services like implementation, training, and support are also witnessing significant growth due to the need for customized solutions and ongoing technical assistance.
- North America Dominance: Driven by high technology adoption rates and substantial investment in educational technology.
- Europe Growth: Strong focus on digitalization and the integration of technology in educational institutions.
- Asia-Pacific Potential: Rapid growth fueled by increasing government initiatives and rising digital literacy.
- Software Segment: Highest market share due to the demand for LMS, SIS, and ERP solutions.
- Services Segment: Significant growth potential due to the need for customized solutions and technical support.
Higher Education Software Market Product Landscape
The Higher Education Software market offers a diverse range of products, including Learning Management Systems (LMS), Student Information Systems (SIS), Enterprise Resource Planning (ERP) systems, and specialized software for research, administration, and student support. Recent innovations focus on AI-powered personalized learning, gamification features, and enhanced data analytics capabilities. These advancements aim to improve student outcomes, streamline administrative processes, and foster a more engaging learning environment. Key features include mobile accessibility, integration with other educational platforms, and robust security measures.
Key Drivers, Barriers & Challenges in Higher Education Software Market
Key Drivers: The increasing adoption of technology in education, the growing demand for personalized learning, and government initiatives promoting digital learning are key drivers. Furthermore, the need for efficient administrative systems and improved data management contributes to market growth.
Challenges and Restraints: High implementation costs, integration complexities, data security concerns, and resistance to adopting new technologies are significant challenges. The lack of standardized data formats across different institutions also poses a barrier to seamless integration. Furthermore, competitive pressures and the availability of open-source alternatives impact market dynamics. These factors can lead to delays in implementation and potentially impact project success rates.
Emerging Opportunities in Higher Education Software Market
The growing adoption of blended learning models, the increasing demand for personalized learning pathways, and the rise of micro-learning platforms present significant opportunities. There's also potential in developing software solutions catering to specific niche areas like online assessment, virtual labs, and specialized training programs. Furthermore, leveraging big data analytics to gain insights into student learning behaviors can significantly improve the effectiveness of educational interventions.
Growth Accelerators in the Higher Education Software Market Industry
Strategic partnerships between software providers and educational institutions are accelerating market growth. Technological advancements such as AI and machine learning are further enhancing the capabilities of higher education software, leading to improved user experience and enhanced learning outcomes. Expansion into emerging markets and the development of innovative solutions catering to specific learning needs also play significant roles in market growth.
Key Players Shaping the Higher Education Software Market Market
- Blackboard
- Jenzabar
- D2L
- Canvas by Instructure
- Oracle
- Workday
- Ellucian
- Unit4
- SAP
- InstructureL
Notable Milestones in Higher Education Software Market Sector
- 2020, Q4: Blackboard launches its new AI-powered learning platform.
- 2021, Q2: Jenzabar acquires a smaller higher education software company, expanding its market reach.
- 2022, Q1: Canvas by Instructure integrates a new assessment tool.
- 2023, Q3: Ellucian releases a major update to its student information system.
- 2024, Q4: Several significant partnerships formed between software providers and educational institutions to facilitate the integration of new technologies.
In-Depth Higher Education Software Market Market Outlook
The Higher Education Software market is poised for sustained growth driven by continued technological advancements, increasing demand for personalized learning experiences, and ongoing digital transformation within educational institutions. Strategic partnerships, expansion into new markets, and the development of innovative solutions will further fuel market expansion. Opportunities lie in leveraging AI, machine learning, and big data analytics to create more effective and engaging learning environments. The focus on improving student outcomes and streamlining administrative processes will continue to drive demand for advanced higher education software solutions.
Higher Education Software Market Segmentation
-
1. Type
-
1.1. Software
- 1.1.1. Admission & Recruiting Management
- 1.1.2. Student Information System
- 1.1.3. Faculty Management
- 1.1.4. Learning & Advisory
- 1.1.5. Financial & Payroll Management
- 1.1.6. Alumni Management
- 1.1.7. Other Ty
- 1.2. Services
-
1.1. Software
Higher Education Software Market Segmentation By Geography
-
1. North America
- 1.1. United States
- 1.2. Canada
- 1.3. Mexico
-
2. South America
- 2.1. Brazil
- 2.2. Argentina
- 2.3. Rest of South America
-
3. Europe
- 3.1. United Kingdom
- 3.2. Germany
- 3.3. France
- 3.4. Italy
- 3.5. Spain
- 3.6. Russia
- 3.7. Benelux
- 3.8. Nordics
- 3.9. Rest of Europe
-
4. Middle East & Africa
- 4.1. Turkey
- 4.2. Israel
- 4.3. GCC
- 4.4. North Africa
- 4.5. South Africa
- 4.6. Rest of Middle East & Africa
-
5. Asia Pacific
- 5.1. China
- 5.2. India
- 5.3. Japan
- 5.4. South Korea
- 5.5. ASEAN
- 5.6. Oceania
- 5.7. Rest of Asia Pacific
Higher Education Software Market REPORT HIGHLIGHTS
| Aspects | Details |
|---|---|
| Study Period | 2019-2033 |
| Base Year | 2024 |
| Estimated Year | 2025 |
| Forecast Period | 2025-2033 |
| Historical Period | 2019-2024 |
| Growth Rate | CAGR of 14.70% from 2019-2033 |
| Segmentation |
|
Table of Contents
- 1. Introduction
- 1.1. Research Scope
- 1.2. Market Segmentation
- 1.3. Research Methodology
- 1.4. Definitions and Assumptions
- 2. Executive Summary
- 2.1. Introduction
- 3. Market Dynamics
- 3.1. Introduction
- 3.2. Market Drivers
- 3.2.1. ; Online learning is now considered to be the new normal as educational institutions are focused on imparting coursework through digital platforms thereby requiring robust processes; Growing investments from governments and local bodies on improving educational quality at public schools; Ease of deployment and presence of several vendors has increased the bargaining leverage of institutions
- 3.3. Market Restrains
- 3.3.1. ; Increasing cost of MEMS based motion sensor due to the lack of the alternatives
- 3.4. Market Trends
- 3.4.1. Learning Systems Software Segment to Drive the Market
- 4. Market Factor Analysis
- 4.1. Porters Five Forces
- 4.2. Supply/Value Chain
- 4.3. PESTEL analysis
- 4.4. Market Entropy
- 4.5. Patent/Trademark Analysis
- 5. Global Higher Education Software Market Analysis, Insights and Forecast, 2019-2031
- 5.1. Market Analysis, Insights and Forecast - by Type
- 5.1.1. Software
- 5.1.1.1. Admission & Recruiting Management
- 5.1.1.2. Student Information System
- 5.1.1.3. Faculty Management
- 5.1.1.4. Learning & Advisory
- 5.1.1.5. Financial & Payroll Management
- 5.1.1.6. Alumni Management
- 5.1.1.7. Other Ty
- 5.1.2. Services
- 5.1.1. Software
- 5.2. Market Analysis, Insights and Forecast - by Region
- 5.2.1. North America
- 5.2.2. South America
- 5.2.3. Europe
- 5.2.4. Middle East & Africa
- 5.2.5. Asia Pacific
- 5.1. Market Analysis, Insights and Forecast - by Type
- 6. North America Higher Education Software Market Analysis, Insights and Forecast, 2019-2031
- 6.1. Market Analysis, Insights and Forecast - by Type
- 6.1.1. Software
- 6.1.1.1. Admission & Recruiting Management
- 6.1.1.2. Student Information System
- 6.1.1.3. Faculty Management
- 6.1.1.4. Learning & Advisory
- 6.1.1.5. Financial & Payroll Management
- 6.1.1.6. Alumni Management
- 6.1.1.7. Other Ty
- 6.1.2. Services
- 6.1.1. Software
- 6.1. Market Analysis, Insights and Forecast - by Type
- 7. South America Higher Education Software Market Analysis, Insights and Forecast, 2019-2031
- 7.1. Market Analysis, Insights and Forecast - by Type
- 7.1.1. Software
- 7.1.1.1. Admission & Recruiting Management
- 7.1.1.2. Student Information System
- 7.1.1.3. Faculty Management
- 7.1.1.4. Learning & Advisory
- 7.1.1.5. Financial & Payroll Management
- 7.1.1.6. Alumni Management
- 7.1.1.7. Other Ty
- 7.1.2. Services
- 7.1.1. Software
- 7.1. Market Analysis, Insights and Forecast - by Type
- 8. Europe Higher Education Software Market Analysis, Insights and Forecast, 2019-2031
- 8.1. Market Analysis, Insights and Forecast - by Type
- 8.1.1. Software
- 8.1.1.1. Admission & Recruiting Management
- 8.1.1.2. Student Information System
- 8.1.1.3. Faculty Management
- 8.1.1.4. Learning & Advisory
- 8.1.1.5. Financial & Payroll Management
- 8.1.1.6. Alumni Management
- 8.1.1.7. Other Ty
- 8.1.2. Services
- 8.1.1. Software
- 8.1. Market Analysis, Insights and Forecast - by Type
- 9. Middle East & Africa Higher Education Software Market Analysis, Insights and Forecast, 2019-2031
- 9.1. Market Analysis, Insights and Forecast - by Type
- 9.1.1. Software
- 9.1.1.1. Admission & Recruiting Management
- 9.1.1.2. Student Information System
- 9.1.1.3. Faculty Management
- 9.1.1.4. Learning & Advisory
- 9.1.1.5. Financial & Payroll Management
- 9.1.1.6. Alumni Management
- 9.1.1.7. Other Ty
- 9.1.2. Services
- 9.1.1. Software
- 9.1. Market Analysis, Insights and Forecast - by Type
- 10. Asia Pacific Higher Education Software Market Analysis, Insights and Forecast, 2019-2031
- 10.1. Market Analysis, Insights and Forecast - by Type
- 10.1.1. Software
- 10.1.1.1. Admission & Recruiting Management
- 10.1.1.2. Student Information System
- 10.1.1.3. Faculty Management
- 10.1.1.4. Learning & Advisory
- 10.1.1.5. Financial & Payroll Management
- 10.1.1.6. Alumni Management
- 10.1.1.7. Other Ty
- 10.1.2. Services
- 10.1.1. Software
- 10.1. Market Analysis, Insights and Forecast - by Type
- 11. North America Higher Education Software Market Analysis, Insights and Forecast, 2019-2031
- 11.1. Market Analysis, Insights and Forecast - By Country/Sub-region
- 11.1.1 United States
- 11.1.2 Canada
- 11.1.3 Mexico
- 12. Europe Higher Education Software Market Analysis, Insights and Forecast, 2019-2031
- 12.1. Market Analysis, Insights and Forecast - By Country/Sub-region
- 12.1.1 Germany
- 12.1.2 United Kingdom
- 12.1.3 France
- 12.1.4 Spain
- 12.1.5 Italy
- 12.1.6 Spain
- 12.1.7 Belgium
- 12.1.8 Netherland
- 12.1.9 Nordics
- 12.1.10 Rest of Europe
- 13. Asia Pacific Higher Education Software Market Analysis, Insights and Forecast, 2019-2031
- 13.1. Market Analysis, Insights and Forecast - By Country/Sub-region
- 13.1.1 China
- 13.1.2 Japan
- 13.1.3 India
- 13.1.4 South Korea
- 13.1.5 Southeast Asia
- 13.1.6 Australia
- 13.1.7 Indonesia
- 13.1.8 Phillipes
- 13.1.9 Singapore
- 13.1.10 Thailandc
- 13.1.11 Rest of Asia Pacific
- 14. South America Higher Education Software Market Analysis, Insights and Forecast, 2019-2031
- 14.1. Market Analysis, Insights and Forecast - By Country/Sub-region
- 14.1.1 Brazil
- 14.1.2 Argentina
- 14.1.3 Peru
- 14.1.4 Chile
- 14.1.5 Colombia
- 14.1.6 Ecuador
- 14.1.7 Venezuela
- 14.1.8 Rest of South America
- 15. MEA Higher Education Software Market Analysis, Insights and Forecast, 2019-2031
- 15.1. Market Analysis, Insights and Forecast - By Country/Sub-region
- 15.1.1 United Arab Emirates
- 15.1.2 Saudi Arabia
- 15.1.3 South Africa
- 15.1.4 Rest of Middle East and Africa
- 16. Competitive Analysis
- 16.1. Global Market Share Analysis 2024
- 16.2. Company Profiles
- 16.2.1 Blackboard
- 16.2.1.1. Overview
- 16.2.1.2. Products
- 16.2.1.3. SWOT Analysis
- 16.2.1.4. Recent Developments
- 16.2.1.5. Financials (Based on Availability)
- 16.2.2 Jenzabar
- 16.2.2.1. Overview
- 16.2.2.2. Products
- 16.2.2.3. SWOT Analysis
- 16.2.2.4. Recent Developments
- 16.2.2.5. Financials (Based on Availability)
- 16.2.3 D2
- 16.2.3.1. Overview
- 16.2.3.2. Products
- 16.2.3.3. SWOT Analysis
- 16.2.3.4. Recent Developments
- 16.2.3.5. Financials (Based on Availability)
- 16.2.4 Canvas by Instructure
- 16.2.4.1. Overview
- 16.2.4.2. Products
- 16.2.4.3. SWOT Analysis
- 16.2.4.4. Recent Developments
- 16.2.4.5. Financials (Based on Availability)
- 16.2.5 Oracle
- 16.2.5.1. Overview
- 16.2.5.2. Products
- 16.2.5.3. SWOT Analysis
- 16.2.5.4. Recent Developments
- 16.2.5.5. Financials (Based on Availability)
- 16.2.6 Workday
- 16.2.6.1. Overview
- 16.2.6.2. Products
- 16.2.6.3. SWOT Analysis
- 16.2.6.4. Recent Developments
- 16.2.6.5. Financials (Based on Availability)
- 16.2.7 Ellucian
- 16.2.7.1. Overview
- 16.2.7.2. Products
- 16.2.7.3. SWOT Analysis
- 16.2.7.4. Recent Developments
- 16.2.7.5. Financials (Based on Availability)
- 16.2.8 Unit4
- 16.2.8.1. Overview
- 16.2.8.2. Products
- 16.2.8.3. SWOT Analysis
- 16.2.8.4. Recent Developments
- 16.2.8.5. Financials (Based on Availability)
- 16.2.9 SAP
- 16.2.9.1. Overview
- 16.2.9.2. Products
- 16.2.9.3. SWOT Analysis
- 16.2.9.4. Recent Developments
- 16.2.9.5. Financials (Based on Availability)
- 16.2.10 InstructureL
- 16.2.10.1. Overview
- 16.2.10.2. Products
- 16.2.10.3. SWOT Analysis
- 16.2.10.4. Recent Developments
- 16.2.10.5. Financials (Based on Availability)
- 16.2.1 Blackboard
List of Figures
- Figure 1: Global Higher Education Software Market Revenue Breakdown (Million, %) by Region 2024 & 2032
- Figure 2: North America Higher Education Software Market Revenue (Million), by Country 2024 & 2032
- Figure 3: North America Higher Education Software Market Revenue Share (%), by Country 2024 & 2032
- Figure 4: Europe Higher Education Software Market Revenue (Million), by Country 2024 & 2032
- Figure 5: Europe Higher Education Software Market Revenue Share (%), by Country 2024 & 2032
- Figure 6: Asia Pacific Higher Education Software Market Revenue (Million), by Country 2024 & 2032
- Figure 7: Asia Pacific Higher Education Software Market Revenue Share (%), by Country 2024 & 2032
- Figure 8: South America Higher Education Software Market Revenue (Million), by Country 2024 & 2032
- Figure 9: South America Higher Education Software Market Revenue Share (%), by Country 2024 & 2032
- Figure 10: MEA Higher Education Software Market Revenue (Million), by Country 2024 & 2032
- Figure 11: MEA Higher Education Software Market Revenue Share (%), by Country 2024 & 2032
- Figure 12: North America Higher Education Software Market Revenue (Million), by Type 2024 & 2032
- Figure 13: North America Higher Education Software Market Revenue Share (%), by Type 2024 & 2032
- Figure 14: North America Higher Education Software Market Revenue (Million), by Country 2024 & 2032
- Figure 15: North America Higher Education Software Market Revenue Share (%), by Country 2024 & 2032
- Figure 16: South America Higher Education Software Market Revenue (Million), by Type 2024 & 2032
- Figure 17: South America Higher Education Software Market Revenue Share (%), by Type 2024 & 2032
- Figure 18: South America Higher Education Software Market Revenue (Million), by Country 2024 & 2032
- Figure 19: South America Higher Education Software Market Revenue Share (%), by Country 2024 & 2032
- Figure 20: Europe Higher Education Software Market Revenue (Million), by Type 2024 & 2032
- Figure 21: Europe Higher Education Software Market Revenue Share (%), by Type 2024 & 2032
- Figure 22: Europe Higher Education Software Market Revenue (Million), by Country 2024 & 2032
- Figure 23: Europe Higher Education Software Market Revenue Share (%), by Country 2024 & 2032
- Figure 24: Middle East & Africa Higher Education Software Market Revenue (Million), by Type 2024 & 2032
- Figure 25: Middle East & Africa Higher Education Software Market Revenue Share (%), by Type 2024 & 2032
- Figure 26: Middle East & Africa Higher Education Software Market Revenue (Million), by Country 2024 & 2032
- Figure 27: Middle East & Africa Higher Education Software Market Revenue Share (%), by Country 2024 & 2032
- Figure 28: Asia Pacific Higher Education Software Market Revenue (Million), by Type 2024 & 2032
- Figure 29: Asia Pacific Higher Education Software Market Revenue Share (%), by Type 2024 & 2032
- Figure 30: Asia Pacific Higher Education Software Market Revenue (Million), by Country 2024 & 2032
- Figure 31: Asia Pacific Higher Education Software Market Revenue Share (%), by Country 2024 & 2032
List of Tables
- Table 1: Global Higher Education Software Market Revenue Million Forecast, by Region 2019 & 2032
- Table 2: Global Higher Education Software Market Revenue Million Forecast, by Type 2019 & 2032
- Table 3: Global Higher Education Software Market Revenue Million Forecast, by Region 2019 & 2032
- Table 4: Global Higher Education Software Market Revenue Million Forecast, by Country 2019 & 2032
- Table 5: United States Higher Education Software Market Revenue (Million) Forecast, by Application 2019 & 2032
- Table 6: Canada Higher Education Software Market Revenue (Million) Forecast, by Application 2019 & 2032
- Table 7: Mexico Higher Education Software Market Revenue (Million) Forecast, by Application 2019 & 2032
- Table 8: Global Higher Education Software Market Revenue Million Forecast, by Country 2019 & 2032
- Table 9: Germany Higher Education Software Market Revenue (Million) Forecast, by Application 2019 & 2032
- Table 10: United Kingdom Higher Education Software Market Revenue (Million) Forecast, by Application 2019 & 2032
- Table 11: France Higher Education Software Market Revenue (Million) Forecast, by Application 2019 & 2032
- Table 12: Spain Higher Education Software Market Revenue (Million) Forecast, by Application 2019 & 2032
- Table 13: Italy Higher Education Software Market Revenue (Million) Forecast, by Application 2019 & 2032
- Table 14: Spain Higher Education Software Market Revenue (Million) Forecast, by Application 2019 & 2032
- Table 15: Belgium Higher Education Software Market Revenue (Million) Forecast, by Application 2019 & 2032
- Table 16: Netherland Higher Education Software Market Revenue (Million) Forecast, by Application 2019 & 2032
- Table 17: Nordics Higher Education Software Market Revenue (Million) Forecast, by Application 2019 & 2032
- Table 18: Rest of Europe Higher Education Software Market Revenue (Million) Forecast, by Application 2019 & 2032
- Table 19: Global Higher Education Software Market Revenue Million Forecast, by Country 2019 & 2032
- Table 20: China Higher Education Software Market Revenue (Million) Forecast, by Application 2019 & 2032
- Table 21: Japan Higher Education Software Market Revenue (Million) Forecast, by Application 2019 & 2032
- Table 22: India Higher Education Software Market Revenue (Million) Forecast, by Application 2019 & 2032
- Table 23: South Korea Higher Education Software Market Revenue (Million) Forecast, by Application 2019 & 2032
- Table 24: Southeast Asia Higher Education Software Market Revenue (Million) Forecast, by Application 2019 & 2032
- Table 25: Australia Higher Education Software Market Revenue (Million) Forecast, by Application 2019 & 2032
- Table 26: Indonesia Higher Education Software Market Revenue (Million) Forecast, by Application 2019 & 2032
- Table 27: Phillipes Higher Education Software Market Revenue (Million) Forecast, by Application 2019 & 2032
- Table 28: Singapore Higher Education Software Market Revenue (Million) Forecast, by Application 2019 & 2032
- Table 29: Thailandc Higher Education Software Market Revenue (Million) Forecast, by Application 2019 & 2032
- Table 30: Rest of Asia Pacific Higher Education Software Market Revenue (Million) Forecast, by Application 2019 & 2032
- Table 31: Global Higher Education Software Market Revenue Million Forecast, by Country 2019 & 2032
- Table 32: Brazil Higher Education Software Market Revenue (Million) Forecast, by Application 2019 & 2032
- Table 33: Argentina Higher Education Software Market Revenue (Million) Forecast, by Application 2019 & 2032
- Table 34: Peru Higher Education Software Market Revenue (Million) Forecast, by Application 2019 & 2032
- Table 35: Chile Higher Education Software Market Revenue (Million) Forecast, by Application 2019 & 2032
- Table 36: Colombia Higher Education Software Market Revenue (Million) Forecast, by Application 2019 & 2032
- Table 37: Ecuador Higher Education Software Market Revenue (Million) Forecast, by Application 2019 & 2032
- Table 38: Venezuela Higher Education Software Market Revenue (Million) Forecast, by Application 2019 & 2032
- Table 39: Rest of South America Higher Education Software Market Revenue (Million) Forecast, by Application 2019 & 2032
- Table 40: Global Higher Education Software Market Revenue Million Forecast, by Country 2019 & 2032
- Table 41: United Arab Emirates Higher Education Software Market Revenue (Million) Forecast, by Application 2019 & 2032
- Table 42: Saudi Arabia Higher Education Software Market Revenue (Million) Forecast, by Application 2019 & 2032
- Table 43: South Africa Higher Education Software Market Revenue (Million) Forecast, by Application 2019 & 2032
- Table 44: Rest of Middle East and Africa Higher Education Software Market Revenue (Million) Forecast, by Application 2019 & 2032
- Table 45: Global Higher Education Software Market Revenue Million Forecast, by Type 2019 & 2032
- Table 46: Global Higher Education Software Market Revenue Million Forecast, by Country 2019 & 2032
- Table 47: United States Higher Education Software Market Revenue (Million) Forecast, by Application 2019 & 2032
- Table 48: Canada Higher Education Software Market Revenue (Million) Forecast, by Application 2019 & 2032
- Table 49: Mexico Higher Education Software Market Revenue (Million) Forecast, by Application 2019 & 2032
- Table 50: Global Higher Education Software Market Revenue Million Forecast, by Type 2019 & 2032
- Table 51: Global Higher Education Software Market Revenue Million Forecast, by Country 2019 & 2032
- Table 52: Brazil Higher Education Software Market Revenue (Million) Forecast, by Application 2019 & 2032
- Table 53: Argentina Higher Education Software Market Revenue (Million) Forecast, by Application 2019 & 2032
- Table 54: Rest of South America Higher Education Software Market Revenue (Million) Forecast, by Application 2019 & 2032
- Table 55: Global Higher Education Software Market Revenue Million Forecast, by Type 2019 & 2032
- Table 56: Global Higher Education Software Market Revenue Million Forecast, by Country 2019 & 2032
- Table 57: United Kingdom Higher Education Software Market Revenue (Million) Forecast, by Application 2019 & 2032
- Table 58: Germany Higher Education Software Market Revenue (Million) Forecast, by Application 2019 & 2032
- Table 59: France Higher Education Software Market Revenue (Million) Forecast, by Application 2019 & 2032
- Table 60: Italy Higher Education Software Market Revenue (Million) Forecast, by Application 2019 & 2032
- Table 61: Spain Higher Education Software Market Revenue (Million) Forecast, by Application 2019 & 2032
- Table 62: Russia Higher Education Software Market Revenue (Million) Forecast, by Application 2019 & 2032
- Table 63: Benelux Higher Education Software Market Revenue (Million) Forecast, by Application 2019 & 2032
- Table 64: Nordics Higher Education Software Market Revenue (Million) Forecast, by Application 2019 & 2032
- Table 65: Rest of Europe Higher Education Software Market Revenue (Million) Forecast, by Application 2019 & 2032
- Table 66: Global Higher Education Software Market Revenue Million Forecast, by Type 2019 & 2032
- Table 67: Global Higher Education Software Market Revenue Million Forecast, by Country 2019 & 2032
- Table 68: Turkey Higher Education Software Market Revenue (Million) Forecast, by Application 2019 & 2032
- Table 69: Israel Higher Education Software Market Revenue (Million) Forecast, by Application 2019 & 2032
- Table 70: GCC Higher Education Software Market Revenue (Million) Forecast, by Application 2019 & 2032
- Table 71: North Africa Higher Education Software Market Revenue (Million) Forecast, by Application 2019 & 2032
- Table 72: South Africa Higher Education Software Market Revenue (Million) Forecast, by Application 2019 & 2032
- Table 73: Rest of Middle East & Africa Higher Education Software Market Revenue (Million) Forecast, by Application 2019 & 2032
- Table 74: Global Higher Education Software Market Revenue Million Forecast, by Type 2019 & 2032
- Table 75: Global Higher Education Software Market Revenue Million Forecast, by Country 2019 & 2032
- Table 76: China Higher Education Software Market Revenue (Million) Forecast, by Application 2019 & 2032
- Table 77: India Higher Education Software Market Revenue (Million) Forecast, by Application 2019 & 2032
- Table 78: Japan Higher Education Software Market Revenue (Million) Forecast, by Application 2019 & 2032
- Table 79: South Korea Higher Education Software Market Revenue (Million) Forecast, by Application 2019 & 2032
- Table 80: ASEAN Higher Education Software Market Revenue (Million) Forecast, by Application 2019 & 2032
- Table 81: Oceania Higher Education Software Market Revenue (Million) Forecast, by Application 2019 & 2032
- Table 82: Rest of Asia Pacific Higher Education Software Market Revenue (Million) Forecast, by Application 2019 & 2032
Frequently Asked Questions
1. What is the projected Compound Annual Growth Rate (CAGR) of the Higher Education Software Market?
The projected CAGR is approximately 14.70%.
2. Which companies are prominent players in the Higher Education Software Market?
Key companies in the market include Blackboard , Jenzabar, D2, Canvas by Instructure, Oracle, Workday, Ellucian , Unit4 , SAP , InstructureL .
3. What are the main segments of the Higher Education Software Market?
The market segments include Type.
4. Can you provide details about the market size?
The market size is estimated to be USD XX Million as of 2022.
5. What are some drivers contributing to market growth?
; Online learning is now considered to be the new normal as educational institutions are focused on imparting coursework through digital platforms thereby requiring robust processes; Growing investments from governments and local bodies on improving educational quality at public schools; Ease of deployment and presence of several vendors has increased the bargaining leverage of institutions.
6. What are the notable trends driving market growth?
Learning Systems Software Segment to Drive the Market.
7. Are there any restraints impacting market growth?
; Increasing cost of MEMS based motion sensor due to the lack of the alternatives.
8. Can you provide examples of recent developments in the market?
N/A
9. What pricing options are available for accessing the report?
Pricing options include single-user, multi-user, and enterprise licenses priced at USD 4750, USD 5250, and USD 8750 respectively.
10. Is the market size provided in terms of value or volume?
The market size is provided in terms of value, measured in Million.
11. Are there any specific market keywords associated with the report?
Yes, the market keyword associated with the report is "Higher Education Software Market," which aids in identifying and referencing the specific market segment covered.
12. How do I determine which pricing option suits my needs best?
The pricing options vary based on user requirements and access needs. Individual users may opt for single-user licenses, while businesses requiring broader access may choose multi-user or enterprise licenses for cost-effective access to the report.
13. Are there any additional resources or data provided in the Higher Education Software Market report?
While the report offers comprehensive insights, it's advisable to review the specific contents or supplementary materials provided to ascertain if additional resources or data are available.
14. How can I stay updated on further developments or reports in the Higher Education Software Market?
To stay informed about further developments, trends, and reports in the Higher Education Software Market, consider subscribing to industry newsletters, following relevant companies and organizations, or regularly checking reputable industry news sources and publications.
Methodology
Step 1 - Identification of Relevant Samples Size from Population Database


Step 2 - Approaches for Defining Global Market Size (Value, Volume* & Price*)

Note*: In applicable scenarios
Step 3 - Data Sources
Primary Research
- Web Analytics
- Survey Reports
- Research Institute
- Latest Research Reports
- Opinion Leaders
Secondary Research
- Annual Reports
- White Paper
- Latest Press Release
- Industry Association
- Paid Database
- Investor Presentations

Step 4 - Data Triangulation
Involves using different sources of information in order to increase the validity of a study
These sources are likely to be stakeholders in a program - participants, other researchers, program staff, other community members, and so on.
Then we put all data in single framework & apply various statistical tools to find out the dynamic on the market.
During the analysis stage, feedback from the stakeholder groups would be compared to determine areas of agreement as well as areas of divergence


