
Key Insights
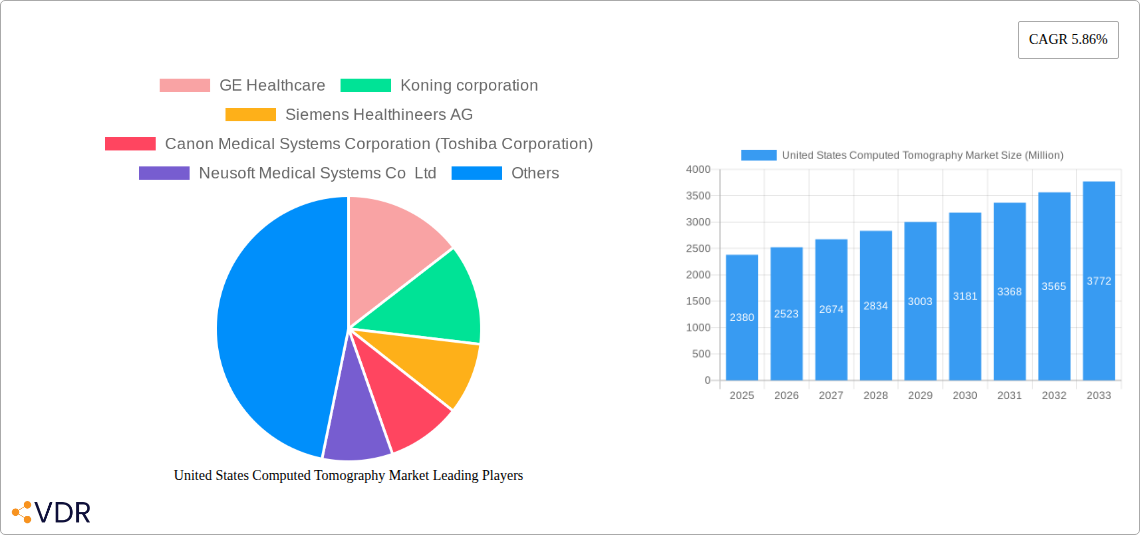
The United States Computed Tomography (CT) market, valued at approximately $2.38 billion in 2025, is projected to experience robust growth, driven by several key factors. Technological advancements leading to faster scan times, improved image quality, and reduced radiation exposure are significantly increasing the adoption of CT scans across various medical specialties. The aging population in the US, coupled with a rising prevalence of chronic diseases like cardiovascular conditions, cancer, and neurological disorders, fuels the demand for accurate and efficient diagnostic imaging tools like CT scanners. Furthermore, increasing government initiatives focused on improving healthcare infrastructure and promoting preventative healthcare contribute to market expansion. The market segmentation reveals a strong presence across various applications, with oncology, neurology, and cardiovascular applications dominating the landscape. Hospitals and diagnostic centers remain the primary end-users, although the "other end-users" segment, encompassing clinics and ambulatory surgery centers, is also witnessing notable growth due to increased accessibility and affordability of CT scans. High-slice CT scanners are anticipated to witness higher growth rates due to their enhanced capabilities compared to low and medium-slice counterparts.
Competition within the US CT market is fierce, with major players like GE Healthcare, Siemens Healthineers AG, and Canon Medical Systems Corporation holding significant market shares. These established companies are actively investing in research and development to introduce innovative CT technologies, including multi-slice scanners with advanced reconstruction algorithms and AI-powered image analysis tools. The ongoing innovation, coupled with the strong underlying market drivers, suggests sustained growth for the US CT market over the forecast period (2025-2033). However, factors such as high equipment costs, the need for skilled technicians, and potential regulatory hurdles could pose challenges to market growth. The market is expected to continue its trajectory of technological advancement, leading to more efficient, precise, and widely accessible CT scanning capabilities across the country.
United States Computed Tomography (CT) Market Report: 2019-2033
This comprehensive report provides a detailed analysis of the United States Computed Tomography (CT) market, encompassing market dynamics, growth trends, regional performance, product landscape, key players, and future outlook. The report covers the period from 2019 to 2033, with a focus on the 2025-2033 forecast period. This in-depth analysis is crucial for industry professionals, investors, and strategic decision-makers seeking to navigate this dynamic market. The parent market is the broader medical imaging equipment market, while the child market is specifically CT scanners within the US.
United States Computed Tomography Market Market Dynamics & Structure
The US computed tomography market is characterized by a moderately concentrated landscape, with key players holding significant market share. Technological innovation, particularly in areas like multi-slice CT, cone-beam CT, and AI-powered image analysis, is a major growth driver. Stringent regulatory frameworks, including FDA approvals, influence product development and market entry. Competitive pressure from alternative imaging modalities like MRI and ultrasound exists, although CT maintains its dominance in certain applications. The end-user demographic is diverse, encompassing hospitals, diagnostic centers, and ambulatory surgical centers. The market has witnessed a moderate level of M&A activity in recent years, with larger players acquiring smaller companies to expand their product portfolio and geographic reach.
- Market Concentration: The top 5 players hold approximately xx% of the market share in 2025.
- Technological Innovation: Focus on faster scan times, improved image quality, and reduced radiation dose.
- Regulatory Framework: Stringent FDA approvals drive quality control and safety standards.
- Competitive Substitutes: MRI, Ultrasound, and other imaging techniques pose some competitive pressure.
- M&A Activity: xx M&A deals were recorded between 2019 and 2024, with an average deal value of xx million USD.
- End-User Demographics: Hospitals constitute the largest end-user segment, followed by diagnostic centers.
United States Computed Tomography Market Growth Trends & Insights
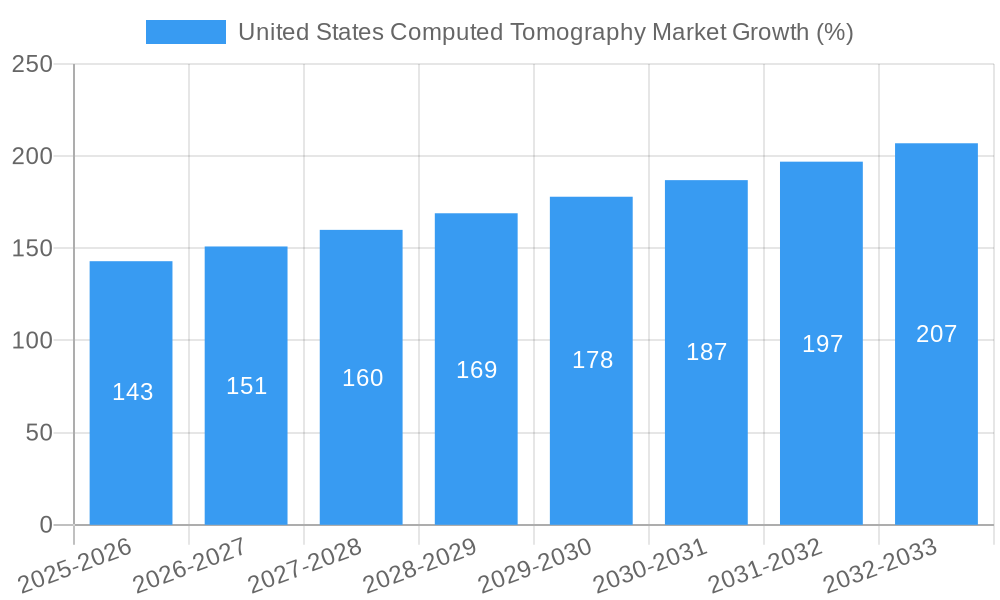
The US CT market exhibited a CAGR of xx% during the historical period (2019-2024) and is projected to grow at a CAGR of xx% during the forecast period (2025-2033), reaching a market size of xx million USD by 2033. This growth is driven by factors including rising prevalence of chronic diseases, increasing geriatric population, technological advancements leading to improved image quality and faster scan times, and increasing demand for advanced imaging techniques in various applications. Adoption rates are particularly high in urban areas with well-established healthcare infrastructure. Technological disruptions, such as the integration of AI and machine learning in image analysis, are transforming clinical workflows and improving diagnostic accuracy. Consumer behavior is shifting towards a preference for minimally invasive procedures and faster diagnostic turnaround times, which fuels demand for advanced CT systems.
Dominant Regions, Countries, or Segments in United States Computed Tomography Market
The largest segment by type is High Slice CT, followed by Medium Slice and Low Slice CT. Within applications, Oncology and Cardiovascular applications contribute significantly to market growth. Hospitals remain the dominant end-user segment due to higher adoption rates and greater access to advanced technology. Key factors driving the growth of these segments include:
- High Slice CT: Superior image quality and faster scan times cater to a wider range of clinical needs.
- Oncology Applications: Crucial for cancer diagnosis, staging, and treatment monitoring.
- Cardiovascular Applications: Essential for diagnosing and managing heart conditions.
- Hospitals: Large patient volume and greater investment capacity contribute to higher adoption rates.
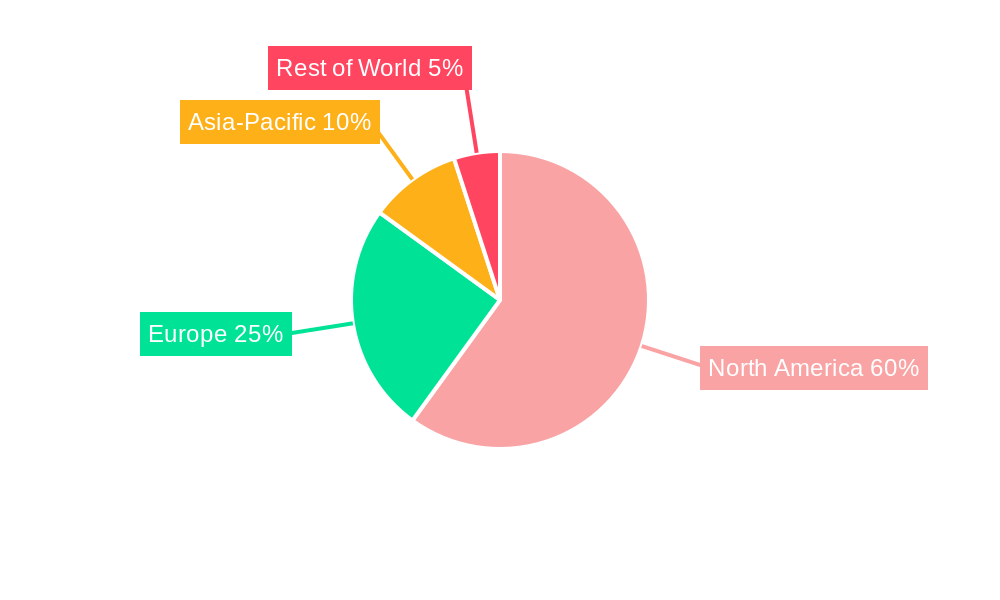
Geographical dominance is primarily concentrated in densely populated states with high healthcare expenditure, exhibiting higher prevalence of chronic diseases and strong healthcare infrastructure.
United States Computed Tomography Market Product Landscape
The US CT market offers a diverse range of products, including multi-slice CT scanners with varying slice counts, cone-beam CT systems for point-of-care applications, and mobile CT scanners. Innovations focus on enhancing image quality, reducing radiation dose, and improving workflow efficiency through AI-powered image analysis. Unique selling propositions include faster scan times, improved image resolution, and integrated software solutions for streamlined clinical workflows. Technological advancements are leading to smaller footprint systems, more efficient radiation shielding, and AI-driven diagnostics.
Key Drivers, Barriers & Challenges in United States Computed Tomography Market
Key Drivers:
- Increasing prevalence of chronic diseases requiring advanced diagnostic imaging.
- Technological advancements in CT scanner technology improving image quality and efficiency.
- Growing demand for minimally invasive procedures and faster diagnostic turnaround times.
Challenges:
- High cost of purchasing and maintaining CT scanners.
- Regulatory hurdles and FDA approval processes for new technologies.
- Competition from alternative imaging modalities.
- Supply chain disruptions impacting the availability of components and devices (estimated xx% impact on market growth in 2024).
Emerging Opportunities in United States Computed Tomography Market
Emerging opportunities include the growing demand for point-of-care CT systems, integration of AI-driven image analysis for improved diagnostic accuracy, and expansion into underserved rural areas. Development of specialized CT applications for specific conditions, like neurology or musculoskeletal imaging, presents significant potential. The rise of telehealth and remote diagnostics could also create new opportunities for CT scanner utilization.
Growth Accelerators in the United States Computed Tomography Market Industry
Strategic partnerships between CT manufacturers and healthcare providers, along with government initiatives promoting advanced diagnostic imaging capabilities, are driving market growth. Technological breakthroughs, such as the development of advanced detectors and image reconstruction algorithms, further contribute to market expansion. Expansion into emerging markets and untapped geographic regions, combined with the development of specialized CT applications, presents significant growth opportunities.
Key Players Shaping the United States Computed Tomography Market Market
- GE Healthcare
- Koning corporation
- Siemens Healthineers AG
- Canon Medical Systems Corporation (Toshiba Corporation)
- Neusoft Medical Systems Co Ltd
- Carestream Health
- Koninklijke Philips NV
- Stryker Corporation
- Planmeca Group (Planmed OY)
- Samsung Electronics Co Ltd
- Fujifilm Holdings Corporation
Notable Milestones in United States Computed Tomography Market Sector
- June 2022: Xoran Technologies receives a patent for a modular computed tomography (CT) system assembly, signifying advancements in point-of-care imaging.
- March 2022: NeuroLogica Corp's OmniTom Elite receives 510(k) approval, expanding the availability of mobile CT imaging.
In-Depth United States Computed Tomography Market Market Outlook
The US CT market is poised for sustained growth driven by technological advancements, increasing demand for advanced imaging, and expansion into new applications. Strategic partnerships, investments in R&D, and focus on improving access to advanced imaging in underserved areas will shape future market dynamics. The integration of AI and the development of specialized CT applications for niche medical needs will further propel market expansion and create exciting new opportunities for stakeholders.
United States Computed Tomography Market Segmentation
-
1. Type
- 1.1. Low Slice
- 1.2. Medium Slice
- 1.3. High Slice
-
2. Application
- 2.1. Oncology
- 2.2. Neurology
- 2.3. Cardiovascular
- 2.4. Musculoskeletal
- 2.5. Other Applications
-
3. End User
- 3.1. Hospitals
- 3.2. Diagnostic Centers
- 3.3. Other End Users
United States Computed Tomography Market Segmentation By Geography
- 1. United States
United States Computed Tomography Market REPORT HIGHLIGHTS
| Aspects | Details |
|---|---|
| Study Period | 2019-2033 |
| Base Year | 2024 |
| Estimated Year | 2025 |
| Forecast Period | 2025-2033 |
| Historical Period | 2019-2024 |
| Growth Rate | CAGR of 5.86% from 2019-2033 |
| Segmentation |
|
Table of Contents
- 1. Introduction
- 1.1. Research Scope
- 1.2. Market Segmentation
- 1.3. Research Methodology
- 1.4. Definitions and Assumptions
- 2. Executive Summary
- 2.1. Introduction
- 3. Market Dynamics
- 3.1. Introduction
- 3.2. Market Drivers
- 3.2.1. Increasing Prevalence of Chronic Diseases; Rising Geriatric Population; Increasing Technological Advancements
- 3.3. Market Restrains
- 3.3.1. Lack Of Proper Reimbursement And Stringent Regulatory Approval Procedures; High Cost of Equipment
- 3.4. Market Trends
- 3.4.1. Oncology Segment is Expected to Hold a Significant Market Share Over the Forecast Period
- 4. Market Factor Analysis
- 4.1. Porters Five Forces
- 4.2. Supply/Value Chain
- 4.3. PESTEL analysis
- 4.4. Market Entropy
- 4.5. Patent/Trademark Analysis
- 5. United States Computed Tomography Market Analysis, Insights and Forecast, 2019-2031
- 5.1. Market Analysis, Insights and Forecast - by Type
- 5.1.1. Low Slice
- 5.1.2. Medium Slice
- 5.1.3. High Slice
- 5.2. Market Analysis, Insights and Forecast - by Application
- 5.2.1. Oncology
- 5.2.2. Neurology
- 5.2.3. Cardiovascular
- 5.2.4. Musculoskeletal
- 5.2.5. Other Applications
- 5.3. Market Analysis, Insights and Forecast - by End User
- 5.3.1. Hospitals
- 5.3.2. Diagnostic Centers
- 5.3.3. Other End Users
- 5.4. Market Analysis, Insights and Forecast - by Region
- 5.4.1. United States
- 5.1. Market Analysis, Insights and Forecast - by Type
- 6. United States United States Computed Tomography Market Analysis, Insights and Forecast, 2019-2031
- 7. Canada United States Computed Tomography Market Analysis, Insights and Forecast, 2019-2031
- 8. Mexico United States Computed Tomography Market Analysis, Insights and Forecast, 2019-2031
- 9. Competitive Analysis
- 9.1. Market Share Analysis 2024
- 9.2. Company Profiles
- 9.2.1 GE Healthcare
- 9.2.1.1. Overview
- 9.2.1.2. Products
- 9.2.1.3. SWOT Analysis
- 9.2.1.4. Recent Developments
- 9.2.1.5. Financials (Based on Availability)
- 9.2.2 Koning corporation
- 9.2.2.1. Overview
- 9.2.2.2. Products
- 9.2.2.3. SWOT Analysis
- 9.2.2.4. Recent Developments
- 9.2.2.5. Financials (Based on Availability)
- 9.2.3 Siemens Healthineers AG
- 9.2.3.1. Overview
- 9.2.3.2. Products
- 9.2.3.3. SWOT Analysis
- 9.2.3.4. Recent Developments
- 9.2.3.5. Financials (Based on Availability)
- 9.2.4 Canon Medical Systems Corporation (Toshiba Corporation)
- 9.2.4.1. Overview
- 9.2.4.2. Products
- 9.2.4.3. SWOT Analysis
- 9.2.4.4. Recent Developments
- 9.2.4.5. Financials (Based on Availability)
- 9.2.5 Neusoft Medical Systems Co Ltd
- 9.2.5.1. Overview
- 9.2.5.2. Products
- 9.2.5.3. SWOT Analysis
- 9.2.5.4. Recent Developments
- 9.2.5.5. Financials (Based on Availability)
- 9.2.6 Carestream Health
- 9.2.6.1. Overview
- 9.2.6.2. Products
- 9.2.6.3. SWOT Analysis
- 9.2.6.4. Recent Developments
- 9.2.6.5. Financials (Based on Availability)
- 9.2.7 Koninklijke Philips NV
- 9.2.7.1. Overview
- 9.2.7.2. Products
- 9.2.7.3. SWOT Analysis
- 9.2.7.4. Recent Developments
- 9.2.7.5. Financials (Based on Availability)
- 9.2.8 Stryker Corporation
- 9.2.8.1. Overview
- 9.2.8.2. Products
- 9.2.8.3. SWOT Analysis
- 9.2.8.4. Recent Developments
- 9.2.8.5. Financials (Based on Availability)
- 9.2.9 Planmeca Group (Planmed OY)
- 9.2.9.1. Overview
- 9.2.9.2. Products
- 9.2.9.3. SWOT Analysis
- 9.2.9.4. Recent Developments
- 9.2.9.5. Financials (Based on Availability)
- 9.2.10 Samsung Electronics Co Ltd
- 9.2.10.1. Overview
- 9.2.10.2. Products
- 9.2.10.3. SWOT Analysis
- 9.2.10.4. Recent Developments
- 9.2.10.5. Financials (Based on Availability)
- 9.2.11 Fujifilm Holdings Corporation
- 9.2.11.1. Overview
- 9.2.11.2. Products
- 9.2.11.3. SWOT Analysis
- 9.2.11.4. Recent Developments
- 9.2.11.5. Financials (Based on Availability)
- 9.2.1 GE Healthcare
List of Figures
- Figure 1: United States Computed Tomography Market Revenue Breakdown (Million, %) by Product 2024 & 2032
- Figure 2: United States Computed Tomography Market Share (%) by Company 2024
List of Tables
- Table 1: United States Computed Tomography Market Revenue Million Forecast, by Region 2019 & 2032
- Table 2: United States Computed Tomography Market Revenue Million Forecast, by Type 2019 & 2032
- Table 3: United States Computed Tomography Market Revenue Million Forecast, by Application 2019 & 2032
- Table 4: United States Computed Tomography Market Revenue Million Forecast, by End User 2019 & 2032
- Table 5: United States Computed Tomography Market Revenue Million Forecast, by Region 2019 & 2032
- Table 6: United States Computed Tomography Market Revenue Million Forecast, by Country 2019 & 2032
- Table 7: United States United States Computed Tomography Market Revenue (Million) Forecast, by Application 2019 & 2032
- Table 8: Canada United States Computed Tomography Market Revenue (Million) Forecast, by Application 2019 & 2032
- Table 9: Mexico United States Computed Tomography Market Revenue (Million) Forecast, by Application 2019 & 2032
- Table 10: United States Computed Tomography Market Revenue Million Forecast, by Type 2019 & 2032
- Table 11: United States Computed Tomography Market Revenue Million Forecast, by Application 2019 & 2032
- Table 12: United States Computed Tomography Market Revenue Million Forecast, by End User 2019 & 2032
- Table 13: United States Computed Tomography Market Revenue Million Forecast, by Country 2019 & 2032
Frequently Asked Questions
1. What is the projected Compound Annual Growth Rate (CAGR) of the United States Computed Tomography Market?
The projected CAGR is approximately 5.86%.
2. Which companies are prominent players in the United States Computed Tomography Market?
Key companies in the market include GE Healthcare, Koning corporation, Siemens Healthineers AG, Canon Medical Systems Corporation (Toshiba Corporation), Neusoft Medical Systems Co Ltd, Carestream Health, Koninklijke Philips NV, Stryker Corporation, Planmeca Group (Planmed OY), Samsung Electronics Co Ltd, Fujifilm Holdings Corporation.
3. What are the main segments of the United States Computed Tomography Market?
The market segments include Type, Application, End User.
4. Can you provide details about the market size?
The market size is estimated to be USD 2.38 Million as of 2022.
5. What are some drivers contributing to market growth?
Increasing Prevalence of Chronic Diseases; Rising Geriatric Population; Increasing Technological Advancements.
6. What are the notable trends driving market growth?
Oncology Segment is Expected to Hold a Significant Market Share Over the Forecast Period.
7. Are there any restraints impacting market growth?
Lack Of Proper Reimbursement And Stringent Regulatory Approval Procedures; High Cost of Equipment.
8. Can you provide examples of recent developments in the market?
In June 2022, Xoran Technologies, a United States-based company received a patent for a modular computed tomography (CT) system assembly. Together with our twenty and counting active patents, this ground-breaking cone beam CT arrangement opens up new possibilities. The innovation is just the start of a new line of point-of-care (POC) imaging equipment from Xoran.
9. What pricing options are available for accessing the report?
Pricing options include single-user, multi-user, and enterprise licenses priced at USD 3800, USD 4500, and USD 5800 respectively.
10. Is the market size provided in terms of value or volume?
The market size is provided in terms of value, measured in Million.
11. Are there any specific market keywords associated with the report?
Yes, the market keyword associated with the report is "United States Computed Tomography Market," which aids in identifying and referencing the specific market segment covered.
12. How do I determine which pricing option suits my needs best?
The pricing options vary based on user requirements and access needs. Individual users may opt for single-user licenses, while businesses requiring broader access may choose multi-user or enterprise licenses for cost-effective access to the report.
13. Are there any additional resources or data provided in the United States Computed Tomography Market report?
While the report offers comprehensive insights, it's advisable to review the specific contents or supplementary materials provided to ascertain if additional resources or data are available.
14. How can I stay updated on further developments or reports in the United States Computed Tomography Market?
To stay informed about further developments, trends, and reports in the United States Computed Tomography Market, consider subscribing to industry newsletters, following relevant companies and organizations, or regularly checking reputable industry news sources and publications.
Methodology
Step 1 - Identification of Relevant Samples Size from Population Database


Step 2 - Approaches for Defining Global Market Size (Value, Volume* & Price*)

Note*: In applicable scenarios
Step 3 - Data Sources
Primary Research
- Web Analytics
- Survey Reports
- Research Institute
- Latest Research Reports
- Opinion Leaders
Secondary Research
- Annual Reports
- White Paper
- Latest Press Release
- Industry Association
- Paid Database
- Investor Presentations

Step 4 - Data Triangulation
Involves using different sources of information in order to increase the validity of a study
These sources are likely to be stakeholders in a program - participants, other researchers, program staff, other community members, and so on.
Then we put all data in single framework & apply various statistical tools to find out the dynamic on the market.
During the analysis stage, feedback from the stakeholder groups would be compared to determine areas of agreement as well as areas of divergence


