
Key Insights
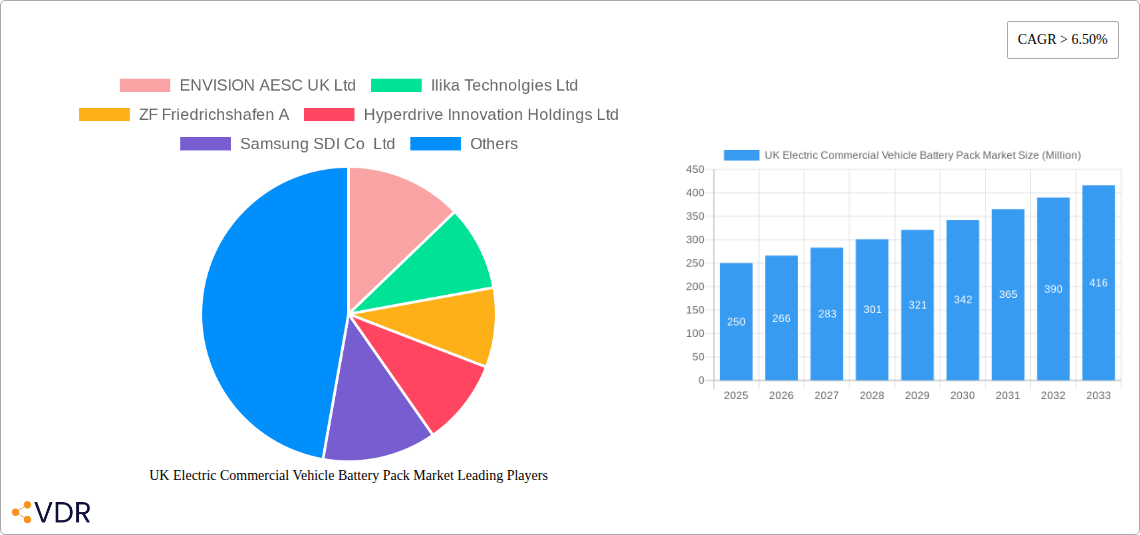
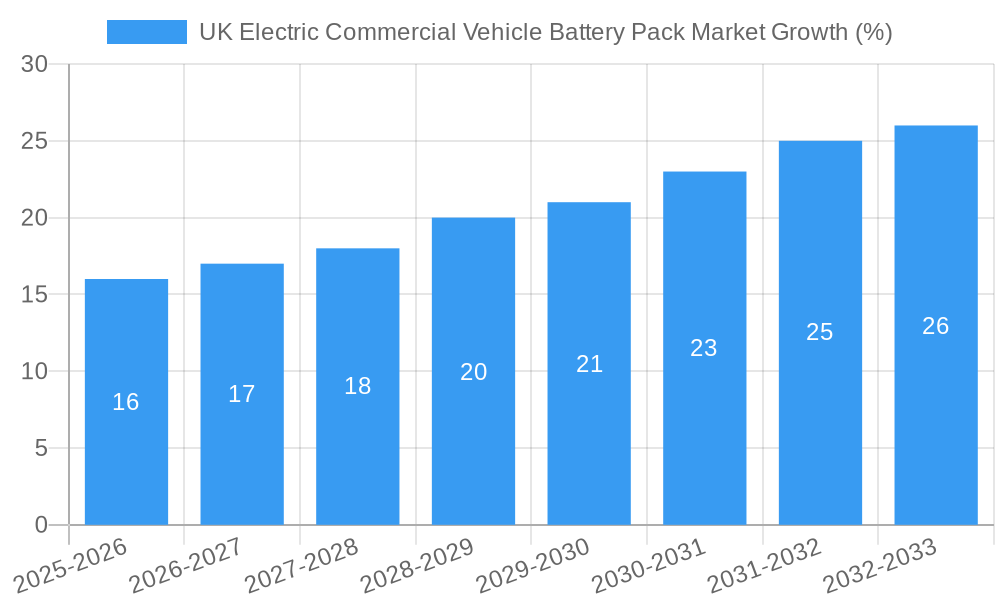
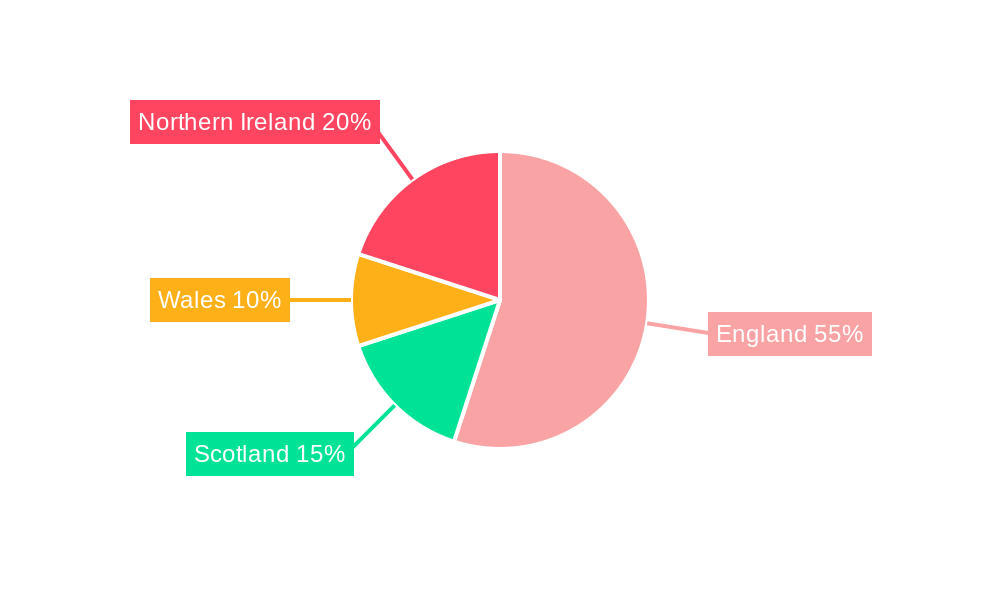
The UK electric commercial vehicle (eCV) battery pack market is experiencing robust growth, driven by stringent emission regulations, government incentives promoting EV adoption, and a rising awareness of environmental concerns among businesses. The market's Compound Annual Growth Rate (CAGR) exceeding 6.50% from 2019 to 2024 indicates significant expansion. This growth is fueled by increasing demand across various commercial vehicle segments, including buses, light commercial vehicles (LCVs), and medium & heavy-duty trucks (M&HDTs). The transition to electric powertrains is being propelled by advancements in battery technology, leading to improved energy density, extended range, and reduced charging times. Different battery chemistries like LFP, NCA, NCM, and NMC cater to diverse vehicle requirements and performance expectations. Furthermore, the market is segmented by battery form factor (cylindrical, pouch, prismatic), manufacturing methods (laser, wire), component type (anode, cathode, electrolyte, separator), and material composition (Cobalt, Lithium, Manganese, Natural Graphite, Nickel). The market's regional focus is primarily on England, Wales, Scotland, and Northern Ireland, with localized manufacturing and supply chains contributing to growth.
Looking ahead to 2033, the market is poised for continued expansion, albeit at a potentially moderated pace as the initial surge of adoption matures. Factors such as the availability of charging infrastructure, battery raw material costs, and the overall economic climate will influence growth trajectories. Nevertheless, the continued investment in battery technology and manufacturing capabilities within the UK, coupled with the strong governmental support for electrification, ensures a positive outlook for the eCV battery pack market. Key players like ENVISION AESC UK Ltd, CATL, and LG Energy Solution are strategically positioned to benefit from this growth, driving innovation and competition. The capacity segment (15 kWh to 40 kWh, 40 kWh to 80 kWh, above 80 kWh) will likely see diversification based on vehicle types and operational requirements.
UK Electric Commercial Vehicle Battery Pack Market: A Comprehensive Report (2019-2033)
This in-depth report provides a comprehensive analysis of the UK electric commercial vehicle battery pack market, encompassing market dynamics, growth trends, key players, and future outlook. With a focus on the parent market of electric commercial vehicles and its child segments, this report offers invaluable insights for industry professionals, investors, and strategic decision-makers. The study period spans from 2019 to 2033, with 2025 as the base year and forecast period from 2025 to 2033. Market values are presented in million units.
UK Electric Commercial Vehicle Battery Pack Market Market Dynamics & Structure
This section analyzes the UK electric commercial vehicle battery pack market's structure, detailing market concentration, technological advancements, regulatory influences, competitive dynamics, and end-user trends. The report examines the impact of mergers and acquisitions (M&A) activities on market consolidation.
- Market Concentration: The market exhibits a [xx]% concentration ratio (CRx), with [xx]% of the market share held by the top five players. This suggests a [competitive/oligopolistic] market structure.
- Technological Innovation: Significant advancements in battery chemistry (LFP, NCA, NCM, NMC), battery form factors (cylindrical, pouch, prismatic), and manufacturing methods (laser, wire welding) are driving market growth. However, challenges remain in achieving higher energy density and reducing costs.
- Regulatory Framework: The UK government's ambitious targets for electric vehicle adoption and supportive policies are stimulating market expansion. Stringent emission regulations further incentivize the shift to electric commercial vehicles.
- Competitive Landscape: Intense competition exists among established players like LG Energy Solution Ltd, CATL, and BYD Company Ltd, and emerging players like Britishvolt. The market faces competitive pressure from both domestic and international companies.
- End-User Demographics: The primary end-users are logistics companies, public transportation authorities, and delivery services. Growth is driven by increasing demand for efficient and environmentally friendly commercial fleets.
- M&A Activity: The number of M&A deals in the UK electric commercial vehicle battery pack market from 2019-2024 was [xx], indicating [high/moderate/low] consolidation activity. These transactions primarily focused on [mention specific reasons, e.g., securing supply chains, technological integration].
UK Electric Commercial Vehicle Battery Pack Market Growth Trends & Insights
This section analyzes market size evolution, adoption rates, technological disruptions, and evolving consumer preferences within the UK electric commercial vehicle battery pack market from 2019 to 2033. The analysis will leverage [mention specific data sources and methodologies used].
[Insert 600-word analysis here, incorporating data on CAGR, market penetration, and other relevant metrics. The analysis should cover market size growth, adoption rates across different vehicle types (Bus, LCV, M&HDT), and the impact of technological innovations on market growth. Consider the impact of battery chemistry and capacity on market trends.]
Dominant Regions, Countries, or Segments in UK Electric Commercial Vehicle Battery Pack Market
This section pinpoints the leading regions, countries, or segments within the UK electric commercial vehicle battery pack market based on factors like market share, growth potential, and influencing factors. The analysis considers segments across Battery Form, Method, Component, Material Type, Body Type, Propulsion Type, Battery Chemistry, and Capacity.
[Insert 600-word analysis here. The analysis should identify the leading segment(s) with specific data on market share and growth potential. Use bullet points to highlight key drivers for each dominant segment. For example: The 'NCM' battery chemistry segment holds the largest market share due to its high energy density and cost-effectiveness. Key drivers include government incentives for NCM battery adoption and growing demand for long-range electric commercial vehicles.]
UK Electric Commercial Vehicle Battery Pack Market Product Landscape
The UK electric commercial vehicle battery pack market features a diverse range of products characterized by ongoing innovation in battery chemistry, cell design, and thermal management systems. Key advancements include improvements in energy density, faster charging capabilities, enhanced safety features, and extended lifespan. This leads to improved vehicle range and performance, driving wider adoption across various commercial vehicle segments. Companies are focusing on developing unique selling propositions through customized solutions tailored to specific vehicle requirements, including specialized battery management systems and optimized packaging.
Key Drivers, Barriers & Challenges in UK Electric Commercial Vehicle Battery Pack Market
Key Drivers:
- Government Incentives: Subsidies and tax breaks for electric commercial vehicles and battery manufacturing are accelerating market growth.
- Environmental Regulations: Stricter emission standards are pushing the adoption of electric vehicles.
- Technological Advancements: Improvements in battery technology, such as increased energy density and reduced costs, are making electric commercial vehicles more competitive.
Challenges & Restraints:
- High Initial Investment Costs: The high upfront cost of electric commercial vehicles remains a barrier for some businesses.
- Limited Charging Infrastructure: Insufficient charging infrastructure, particularly for heavy-duty vehicles, hinders wider adoption.
- Supply Chain Disruptions: Global supply chain challenges can impact the availability and cost of battery components.
Emerging Opportunities in UK Electric Commercial Vehicle Battery Pack Market
The UK electric commercial vehicle battery pack market presents several emerging opportunities, including:
- Growth in the last-mile delivery segment: The increasing demand for efficient and sustainable last-mile delivery solutions is driving market growth.
- Development of second-life battery applications: Exploring opportunities for reusing batteries from electric vehicles in stationary energy storage systems extends market life and sustainability.
- Expansion of fast-charging networks: Investing in fast-charging infrastructure will support higher adoption rates.
Growth Accelerators in the UK Electric Commercial Vehicle Battery Pack Market Industry
Several factors will accelerate long-term growth in the UK electric commercial vehicle battery pack market. Technological breakthroughs in solid-state batteries and improved battery management systems will enhance performance and range. Strategic partnerships between battery manufacturers, vehicle manufacturers, and energy providers will optimize the supply chain and facilitate widespread adoption. Government initiatives aimed at decarbonizing the transportation sector will further stimulate market expansion.
Key Players Shaping the UK Electric Commercial Vehicle Battery Pack Market Market
- ENVISION AESC UK Ltd
- Ilika Technologies Ltd
- ZF Friedrichshafen A
- Hyperdrive Innovation Holdings Ltd
- Samsung SDI Co Ltd
- LG Energy Solution Ltd
- Power By Britishvolt Ltd
- Contemporary Amperex Technology Co Ltd (CATL)
- Robert Bosch GmbH
- BYD Company Ltd
- Amte Power PLC
- SK Innovation Co Ltd
Notable Milestones in UK Electric Commercial Vehicle Battery Pack Market Sector
- October 2022: AMTE Power agreed on a production contract with the UK Battery Industrialisation Centre for its Ultra High Power cells.
- November 2022: AMTE Power PLC received a conversion notice for GBP150,000 worth of convertible loan notes.
- January 2023: Ilika leads an £8.2 million collaboration to develop automotive-grade solid-state batteries.
In-Depth UK Electric Commercial Vehicle Battery Pack Market Market Outlook
The UK electric commercial vehicle battery pack market exhibits strong growth potential driven by increasing demand for sustainable transportation and supportive government policies. Strategic investments in battery technology, charging infrastructure, and supply chain optimization will be crucial for realizing the full market potential. Opportunities exist for companies to capitalize on the growing demand for customized battery solutions and innovative energy storage technologies. The market is poised for significant expansion in the coming years.
UK Electric Commercial Vehicle Battery Pack Market Segmentation
-
1. Body Type
- 1.1. Bus
- 1.2. LCV
- 1.3. M&HDT
-
2. Propulsion Type
- 2.1. BEV
- 2.2. PHEV
-
3. Battery Chemistry
- 3.1. LFP
- 3.2. NCA
- 3.3. NCM
- 3.4. NMC
- 3.5. Others
-
4. Capacity
- 4.1. 15 kWh to 40 kWh
- 4.2. 40 kWh to 80 kWh
- 4.3. Above 80 kWh
- 4.4. Less than 15 kWh
-
5. Battery Form
- 5.1. Cylindrical
- 5.2. Pouch
- 5.3. Prismatic
-
6. Method
- 6.1. Laser
- 6.2. Wire
-
7. Component
- 7.1. Anode
- 7.2. Cathode
- 7.3. Electrolyte
- 7.4. Separator
-
8. Material Type
- 8.1. Cobalt
- 8.2. Lithium
- 8.3. Manganese
- 8.4. Natural Graphite
- 8.5. Nickel
- 8.6. Other Materials
UK Electric Commercial Vehicle Battery Pack Market Segmentation By Geography
-
1. North America
- 1.1. United States
- 1.2. Canada
- 1.3. Mexico
-
2. South America
- 2.1. Brazil
- 2.2. Argentina
- 2.3. Rest of South America
-
3. Europe
- 3.1. United Kingdom
- 3.2. Germany
- 3.3. France
- 3.4. Italy
- 3.5. Spain
- 3.6. Russia
- 3.7. Benelux
- 3.8. Nordics
- 3.9. Rest of Europe
-
4. Middle East & Africa
- 4.1. Turkey
- 4.2. Israel
- 4.3. GCC
- 4.4. North Africa
- 4.5. South Africa
- 4.6. Rest of Middle East & Africa
-
5. Asia Pacific
- 5.1. China
- 5.2. India
- 5.3. Japan
- 5.4. South Korea
- 5.5. ASEAN
- 5.6. Oceania
- 5.7. Rest of Asia Pacific
UK Electric Commercial Vehicle Battery Pack Market REPORT HIGHLIGHTS
| Aspects | Details |
|---|---|
| Study Period | 2019-2033 |
| Base Year | 2024 |
| Estimated Year | 2025 |
| Forecast Period | 2025-2033 |
| Historical Period | 2019-2024 |
| Growth Rate | CAGR of > 6.50% from 2019-2033 |
| Segmentation |
|
Table of Contents
- 1. Introduction
- 1.1. Research Scope
- 1.2. Market Segmentation
- 1.3. Research Methodology
- 1.4. Definitions and Assumptions
- 2. Executive Summary
- 2.1. Introduction
- 3. Market Dynamics
- 3.1. Introduction
- 3.2. Market Drivers
- 3.2.1. Increasing Demand and Sales of Commercial Vehicles is Driving the Market for Hydraulic Systems
- 3.3. Market Restrains
- 3.3.1. Increasing Replacement of Conventional Hydraulic Systems with Fully-electric Hydraulic Systems Acts as a Restraint
- 3.4. Market Trends
- 3.4.1. OTHER KEY INDUSTRY TRENDS COVERED IN THE REPORT
- 4. Market Factor Analysis
- 4.1. Porters Five Forces
- 4.2. Supply/Value Chain
- 4.3. PESTEL analysis
- 4.4. Market Entropy
- 4.5. Patent/Trademark Analysis
- 5. Global UK Electric Commercial Vehicle Battery Pack Market Analysis, Insights and Forecast, 2019-2031
- 5.1. Market Analysis, Insights and Forecast - by Body Type
- 5.1.1. Bus
- 5.1.2. LCV
- 5.1.3. M&HDT
- 5.2. Market Analysis, Insights and Forecast - by Propulsion Type
- 5.2.1. BEV
- 5.2.2. PHEV
- 5.3. Market Analysis, Insights and Forecast - by Battery Chemistry
- 5.3.1. LFP
- 5.3.2. NCA
- 5.3.3. NCM
- 5.3.4. NMC
- 5.3.5. Others
- 5.4. Market Analysis, Insights and Forecast - by Capacity
- 5.4.1. 15 kWh to 40 kWh
- 5.4.2. 40 kWh to 80 kWh
- 5.4.3. Above 80 kWh
- 5.4.4. Less than 15 kWh
- 5.5. Market Analysis, Insights and Forecast - by Battery Form
- 5.5.1. Cylindrical
- 5.5.2. Pouch
- 5.5.3. Prismatic
- 5.6. Market Analysis, Insights and Forecast - by Method
- 5.6.1. Laser
- 5.6.2. Wire
- 5.7. Market Analysis, Insights and Forecast - by Component
- 5.7.1. Anode
- 5.7.2. Cathode
- 5.7.3. Electrolyte
- 5.7.4. Separator
- 5.8. Market Analysis, Insights and Forecast - by Material Type
- 5.8.1. Cobalt
- 5.8.2. Lithium
- 5.8.3. Manganese
- 5.8.4. Natural Graphite
- 5.8.5. Nickel
- 5.8.6. Other Materials
- 5.9. Market Analysis, Insights and Forecast - by Region
- 5.9.1. North America
- 5.9.2. South America
- 5.9.3. Europe
- 5.9.4. Middle East & Africa
- 5.9.5. Asia Pacific
- 5.1. Market Analysis, Insights and Forecast - by Body Type
- 6. North America UK Electric Commercial Vehicle Battery Pack Market Analysis, Insights and Forecast, 2019-2031
- 6.1. Market Analysis, Insights and Forecast - by Body Type
- 6.1.1. Bus
- 6.1.2. LCV
- 6.1.3. M&HDT
- 6.2. Market Analysis, Insights and Forecast - by Propulsion Type
- 6.2.1. BEV
- 6.2.2. PHEV
- 6.3. Market Analysis, Insights and Forecast - by Battery Chemistry
- 6.3.1. LFP
- 6.3.2. NCA
- 6.3.3. NCM
- 6.3.4. NMC
- 6.3.5. Others
- 6.4. Market Analysis, Insights and Forecast - by Capacity
- 6.4.1. 15 kWh to 40 kWh
- 6.4.2. 40 kWh to 80 kWh
- 6.4.3. Above 80 kWh
- 6.4.4. Less than 15 kWh
- 6.5. Market Analysis, Insights and Forecast - by Battery Form
- 6.5.1. Cylindrical
- 6.5.2. Pouch
- 6.5.3. Prismatic
- 6.6. Market Analysis, Insights and Forecast - by Method
- 6.6.1. Laser
- 6.6.2. Wire
- 6.7. Market Analysis, Insights and Forecast - by Component
- 6.7.1. Anode
- 6.7.2. Cathode
- 6.7.3. Electrolyte
- 6.7.4. Separator
- 6.8. Market Analysis, Insights and Forecast - by Material Type
- 6.8.1. Cobalt
- 6.8.2. Lithium
- 6.8.3. Manganese
- 6.8.4. Natural Graphite
- 6.8.5. Nickel
- 6.8.6. Other Materials
- 6.1. Market Analysis, Insights and Forecast - by Body Type
- 7. South America UK Electric Commercial Vehicle Battery Pack Market Analysis, Insights and Forecast, 2019-2031
- 7.1. Market Analysis, Insights and Forecast - by Body Type
- 7.1.1. Bus
- 7.1.2. LCV
- 7.1.3. M&HDT
- 7.2. Market Analysis, Insights and Forecast - by Propulsion Type
- 7.2.1. BEV
- 7.2.2. PHEV
- 7.3. Market Analysis, Insights and Forecast - by Battery Chemistry
- 7.3.1. LFP
- 7.3.2. NCA
- 7.3.3. NCM
- 7.3.4. NMC
- 7.3.5. Others
- 7.4. Market Analysis, Insights and Forecast - by Capacity
- 7.4.1. 15 kWh to 40 kWh
- 7.4.2. 40 kWh to 80 kWh
- 7.4.3. Above 80 kWh
- 7.4.4. Less than 15 kWh
- 7.5. Market Analysis, Insights and Forecast - by Battery Form
- 7.5.1. Cylindrical
- 7.5.2. Pouch
- 7.5.3. Prismatic
- 7.6. Market Analysis, Insights and Forecast - by Method
- 7.6.1. Laser
- 7.6.2. Wire
- 7.7. Market Analysis, Insights and Forecast - by Component
- 7.7.1. Anode
- 7.7.2. Cathode
- 7.7.3. Electrolyte
- 7.7.4. Separator
- 7.8. Market Analysis, Insights and Forecast - by Material Type
- 7.8.1. Cobalt
- 7.8.2. Lithium
- 7.8.3. Manganese
- 7.8.4. Natural Graphite
- 7.8.5. Nickel
- 7.8.6. Other Materials
- 7.1. Market Analysis, Insights and Forecast - by Body Type
- 8. Europe UK Electric Commercial Vehicle Battery Pack Market Analysis, Insights and Forecast, 2019-2031
- 8.1. Market Analysis, Insights and Forecast - by Body Type
- 8.1.1. Bus
- 8.1.2. LCV
- 8.1.3. M&HDT
- 8.2. Market Analysis, Insights and Forecast - by Propulsion Type
- 8.2.1. BEV
- 8.2.2. PHEV
- 8.3. Market Analysis, Insights and Forecast - by Battery Chemistry
- 8.3.1. LFP
- 8.3.2. NCA
- 8.3.3. NCM
- 8.3.4. NMC
- 8.3.5. Others
- 8.4. Market Analysis, Insights and Forecast - by Capacity
- 8.4.1. 15 kWh to 40 kWh
- 8.4.2. 40 kWh to 80 kWh
- 8.4.3. Above 80 kWh
- 8.4.4. Less than 15 kWh
- 8.5. Market Analysis, Insights and Forecast - by Battery Form
- 8.5.1. Cylindrical
- 8.5.2. Pouch
- 8.5.3. Prismatic
- 8.6. Market Analysis, Insights and Forecast - by Method
- 8.6.1. Laser
- 8.6.2. Wire
- 8.7. Market Analysis, Insights and Forecast - by Component
- 8.7.1. Anode
- 8.7.2. Cathode
- 8.7.3. Electrolyte
- 8.7.4. Separator
- 8.8. Market Analysis, Insights and Forecast - by Material Type
- 8.8.1. Cobalt
- 8.8.2. Lithium
- 8.8.3. Manganese
- 8.8.4. Natural Graphite
- 8.8.5. Nickel
- 8.8.6. Other Materials
- 8.1. Market Analysis, Insights and Forecast - by Body Type
- 9. Middle East & Africa UK Electric Commercial Vehicle Battery Pack Market Analysis, Insights and Forecast, 2019-2031
- 9.1. Market Analysis, Insights and Forecast - by Body Type
- 9.1.1. Bus
- 9.1.2. LCV
- 9.1.3. M&HDT
- 9.2. Market Analysis, Insights and Forecast - by Propulsion Type
- 9.2.1. BEV
- 9.2.2. PHEV
- 9.3. Market Analysis, Insights and Forecast - by Battery Chemistry
- 9.3.1. LFP
- 9.3.2. NCA
- 9.3.3. NCM
- 9.3.4. NMC
- 9.3.5. Others
- 9.4. Market Analysis, Insights and Forecast - by Capacity
- 9.4.1. 15 kWh to 40 kWh
- 9.4.2. 40 kWh to 80 kWh
- 9.4.3. Above 80 kWh
- 9.4.4. Less than 15 kWh
- 9.5. Market Analysis, Insights and Forecast - by Battery Form
- 9.5.1. Cylindrical
- 9.5.2. Pouch
- 9.5.3. Prismatic
- 9.6. Market Analysis, Insights and Forecast - by Method
- 9.6.1. Laser
- 9.6.2. Wire
- 9.7. Market Analysis, Insights and Forecast - by Component
- 9.7.1. Anode
- 9.7.2. Cathode
- 9.7.3. Electrolyte
- 9.7.4. Separator
- 9.8. Market Analysis, Insights and Forecast - by Material Type
- 9.8.1. Cobalt
- 9.8.2. Lithium
- 9.8.3. Manganese
- 9.8.4. Natural Graphite
- 9.8.5. Nickel
- 9.8.6. Other Materials
- 9.1. Market Analysis, Insights and Forecast - by Body Type
- 10. Asia Pacific UK Electric Commercial Vehicle Battery Pack Market Analysis, Insights and Forecast, 2019-2031
- 10.1. Market Analysis, Insights and Forecast - by Body Type
- 10.1.1. Bus
- 10.1.2. LCV
- 10.1.3. M&HDT
- 10.2. Market Analysis, Insights and Forecast - by Propulsion Type
- 10.2.1. BEV
- 10.2.2. PHEV
- 10.3. Market Analysis, Insights and Forecast - by Battery Chemistry
- 10.3.1. LFP
- 10.3.2. NCA
- 10.3.3. NCM
- 10.3.4. NMC
- 10.3.5. Others
- 10.4. Market Analysis, Insights and Forecast - by Capacity
- 10.4.1. 15 kWh to 40 kWh
- 10.4.2. 40 kWh to 80 kWh
- 10.4.3. Above 80 kWh
- 10.4.4. Less than 15 kWh
- 10.5. Market Analysis, Insights and Forecast - by Battery Form
- 10.5.1. Cylindrical
- 10.5.2. Pouch
- 10.5.3. Prismatic
- 10.6. Market Analysis, Insights and Forecast - by Method
- 10.6.1. Laser
- 10.6.2. Wire
- 10.7. Market Analysis, Insights and Forecast - by Component
- 10.7.1. Anode
- 10.7.2. Cathode
- 10.7.3. Electrolyte
- 10.7.4. Separator
- 10.8. Market Analysis, Insights and Forecast - by Material Type
- 10.8.1. Cobalt
- 10.8.2. Lithium
- 10.8.3. Manganese
- 10.8.4. Natural Graphite
- 10.8.5. Nickel
- 10.8.6. Other Materials
- 10.1. Market Analysis, Insights and Forecast - by Body Type
- 11. England UK Electric Commercial Vehicle Battery Pack Market Analysis, Insights and Forecast, 2019-2031
- 12. Wales UK Electric Commercial Vehicle Battery Pack Market Analysis, Insights and Forecast, 2019-2031
- 13. Scotland UK Electric Commercial Vehicle Battery Pack Market Analysis, Insights and Forecast, 2019-2031
- 14. Northern UK Electric Commercial Vehicle Battery Pack Market Analysis, Insights and Forecast, 2019-2031
- 15. Ireland UK Electric Commercial Vehicle Battery Pack Market Analysis, Insights and Forecast, 2019-2031
- 16. Competitive Analysis
- 16.1. Global Market Share Analysis 2024
- 16.2. Company Profiles
- 16.2.1 ENVISION AESC UK Ltd
- 16.2.1.1. Overview
- 16.2.1.2. Products
- 16.2.1.3. SWOT Analysis
- 16.2.1.4. Recent Developments
- 16.2.1.5. Financials (Based on Availability)
- 16.2.2 Ilika Technolgies Ltd
- 16.2.2.1. Overview
- 16.2.2.2. Products
- 16.2.2.3. SWOT Analysis
- 16.2.2.4. Recent Developments
- 16.2.2.5. Financials (Based on Availability)
- 16.2.3 ZF Friedrichshafen A
- 16.2.3.1. Overview
- 16.2.3.2. Products
- 16.2.3.3. SWOT Analysis
- 16.2.3.4. Recent Developments
- 16.2.3.5. Financials (Based on Availability)
- 16.2.4 Hyperdrive Innovation Holdings Ltd
- 16.2.4.1. Overview
- 16.2.4.2. Products
- 16.2.4.3. SWOT Analysis
- 16.2.4.4. Recent Developments
- 16.2.4.5. Financials (Based on Availability)
- 16.2.5 Samsung SDI Co Ltd
- 16.2.5.1. Overview
- 16.2.5.2. Products
- 16.2.5.3. SWOT Analysis
- 16.2.5.4. Recent Developments
- 16.2.5.5. Financials (Based on Availability)
- 16.2.6 LG Energy Solution Ltd
- 16.2.6.1. Overview
- 16.2.6.2. Products
- 16.2.6.3. SWOT Analysis
- 16.2.6.4. Recent Developments
- 16.2.6.5. Financials (Based on Availability)
- 16.2.7 Power By Britishvolt Ltd
- 16.2.7.1. Overview
- 16.2.7.2. Products
- 16.2.7.3. SWOT Analysis
- 16.2.7.4. Recent Developments
- 16.2.7.5. Financials (Based on Availability)
- 16.2.8 Contemporary Amperex Technology Co Ltd (CATL)
- 16.2.8.1. Overview
- 16.2.8.2. Products
- 16.2.8.3. SWOT Analysis
- 16.2.8.4. Recent Developments
- 16.2.8.5. Financials (Based on Availability)
- 16.2.9 Robert Bosch GmbH
- 16.2.9.1. Overview
- 16.2.9.2. Products
- 16.2.9.3. SWOT Analysis
- 16.2.9.4. Recent Developments
- 16.2.9.5. Financials (Based on Availability)
- 16.2.10 BYD Company Ltd
- 16.2.10.1. Overview
- 16.2.10.2. Products
- 16.2.10.3. SWOT Analysis
- 16.2.10.4. Recent Developments
- 16.2.10.5. Financials (Based on Availability)
- 16.2.11 Amte Power PLC
- 16.2.11.1. Overview
- 16.2.11.2. Products
- 16.2.11.3. SWOT Analysis
- 16.2.11.4. Recent Developments
- 16.2.11.5. Financials (Based on Availability)
- 16.2.12 SK Innovation Co Ltd
- 16.2.12.1. Overview
- 16.2.12.2. Products
- 16.2.12.3. SWOT Analysis
- 16.2.12.4. Recent Developments
- 16.2.12.5. Financials (Based on Availability)
- 16.2.1 ENVISION AESC UK Ltd
List of Figures
- Figure 1: Global UK Electric Commercial Vehicle Battery Pack Market Revenue Breakdown (Million, %) by Region 2024 & 2032
- Figure 2: United kingdom Region UK Electric Commercial Vehicle Battery Pack Market Revenue (Million), by Country 2024 & 2032
- Figure 3: United kingdom Region UK Electric Commercial Vehicle Battery Pack Market Revenue Share (%), by Country 2024 & 2032
- Figure 4: North America UK Electric Commercial Vehicle Battery Pack Market Revenue (Million), by Body Type 2024 & 2032
- Figure 5: North America UK Electric Commercial Vehicle Battery Pack Market Revenue Share (%), by Body Type 2024 & 2032
- Figure 6: North America UK Electric Commercial Vehicle Battery Pack Market Revenue (Million), by Propulsion Type 2024 & 2032
- Figure 7: North America UK Electric Commercial Vehicle Battery Pack Market Revenue Share (%), by Propulsion Type 2024 & 2032
- Figure 8: North America UK Electric Commercial Vehicle Battery Pack Market Revenue (Million), by Battery Chemistry 2024 & 2032
- Figure 9: North America UK Electric Commercial Vehicle Battery Pack Market Revenue Share (%), by Battery Chemistry 2024 & 2032
- Figure 10: North America UK Electric Commercial Vehicle Battery Pack Market Revenue (Million), by Capacity 2024 & 2032
- Figure 11: North America UK Electric Commercial Vehicle Battery Pack Market Revenue Share (%), by Capacity 2024 & 2032
- Figure 12: North America UK Electric Commercial Vehicle Battery Pack Market Revenue (Million), by Battery Form 2024 & 2032
- Figure 13: North America UK Electric Commercial Vehicle Battery Pack Market Revenue Share (%), by Battery Form 2024 & 2032
- Figure 14: North America UK Electric Commercial Vehicle Battery Pack Market Revenue (Million), by Method 2024 & 2032
- Figure 15: North America UK Electric Commercial Vehicle Battery Pack Market Revenue Share (%), by Method 2024 & 2032
- Figure 16: North America UK Electric Commercial Vehicle Battery Pack Market Revenue (Million), by Component 2024 & 2032
- Figure 17: North America UK Electric Commercial Vehicle Battery Pack Market Revenue Share (%), by Component 2024 & 2032
- Figure 18: North America UK Electric Commercial Vehicle Battery Pack Market Revenue (Million), by Material Type 2024 & 2032
- Figure 19: North America UK Electric Commercial Vehicle Battery Pack Market Revenue Share (%), by Material Type 2024 & 2032
- Figure 20: North America UK Electric Commercial Vehicle Battery Pack Market Revenue (Million), by Country 2024 & 2032
- Figure 21: North America UK Electric Commercial Vehicle Battery Pack Market Revenue Share (%), by Country 2024 & 2032
- Figure 22: South America UK Electric Commercial Vehicle Battery Pack Market Revenue (Million), by Body Type 2024 & 2032
- Figure 23: South America UK Electric Commercial Vehicle Battery Pack Market Revenue Share (%), by Body Type 2024 & 2032
- Figure 24: South America UK Electric Commercial Vehicle Battery Pack Market Revenue (Million), by Propulsion Type 2024 & 2032
- Figure 25: South America UK Electric Commercial Vehicle Battery Pack Market Revenue Share (%), by Propulsion Type 2024 & 2032
- Figure 26: South America UK Electric Commercial Vehicle Battery Pack Market Revenue (Million), by Battery Chemistry 2024 & 2032
- Figure 27: South America UK Electric Commercial Vehicle Battery Pack Market Revenue Share (%), by Battery Chemistry 2024 & 2032
- Figure 28: South America UK Electric Commercial Vehicle Battery Pack Market Revenue (Million), by Capacity 2024 & 2032
- Figure 29: South America UK Electric Commercial Vehicle Battery Pack Market Revenue Share (%), by Capacity 2024 & 2032
- Figure 30: South America UK Electric Commercial Vehicle Battery Pack Market Revenue (Million), by Battery Form 2024 & 2032
- Figure 31: South America UK Electric Commercial Vehicle Battery Pack Market Revenue Share (%), by Battery Form 2024 & 2032
- Figure 32: South America UK Electric Commercial Vehicle Battery Pack Market Revenue (Million), by Method 2024 & 2032
- Figure 33: South America UK Electric Commercial Vehicle Battery Pack Market Revenue Share (%), by Method 2024 & 2032
- Figure 34: South America UK Electric Commercial Vehicle Battery Pack Market Revenue (Million), by Component 2024 & 2032
- Figure 35: South America UK Electric Commercial Vehicle Battery Pack Market Revenue Share (%), by Component 2024 & 2032
- Figure 36: South America UK Electric Commercial Vehicle Battery Pack Market Revenue (Million), by Material Type 2024 & 2032
- Figure 37: South America UK Electric Commercial Vehicle Battery Pack Market Revenue Share (%), by Material Type 2024 & 2032
- Figure 38: South America UK Electric Commercial Vehicle Battery Pack Market Revenue (Million), by Country 2024 & 2032
- Figure 39: South America UK Electric Commercial Vehicle Battery Pack Market Revenue Share (%), by Country 2024 & 2032
- Figure 40: Europe UK Electric Commercial Vehicle Battery Pack Market Revenue (Million), by Body Type 2024 & 2032
- Figure 41: Europe UK Electric Commercial Vehicle Battery Pack Market Revenue Share (%), by Body Type 2024 & 2032
- Figure 42: Europe UK Electric Commercial Vehicle Battery Pack Market Revenue (Million), by Propulsion Type 2024 & 2032
- Figure 43: Europe UK Electric Commercial Vehicle Battery Pack Market Revenue Share (%), by Propulsion Type 2024 & 2032
- Figure 44: Europe UK Electric Commercial Vehicle Battery Pack Market Revenue (Million), by Battery Chemistry 2024 & 2032
- Figure 45: Europe UK Electric Commercial Vehicle Battery Pack Market Revenue Share (%), by Battery Chemistry 2024 & 2032
- Figure 46: Europe UK Electric Commercial Vehicle Battery Pack Market Revenue (Million), by Capacity 2024 & 2032
- Figure 47: Europe UK Electric Commercial Vehicle Battery Pack Market Revenue Share (%), by Capacity 2024 & 2032
- Figure 48: Europe UK Electric Commercial Vehicle Battery Pack Market Revenue (Million), by Battery Form 2024 & 2032
- Figure 49: Europe UK Electric Commercial Vehicle Battery Pack Market Revenue Share (%), by Battery Form 2024 & 2032
- Figure 50: Europe UK Electric Commercial Vehicle Battery Pack Market Revenue (Million), by Method 2024 & 2032
- Figure 51: Europe UK Electric Commercial Vehicle Battery Pack Market Revenue Share (%), by Method 2024 & 2032
- Figure 52: Europe UK Electric Commercial Vehicle Battery Pack Market Revenue (Million), by Component 2024 & 2032
- Figure 53: Europe UK Electric Commercial Vehicle Battery Pack Market Revenue Share (%), by Component 2024 & 2032
- Figure 54: Europe UK Electric Commercial Vehicle Battery Pack Market Revenue (Million), by Material Type 2024 & 2032
- Figure 55: Europe UK Electric Commercial Vehicle Battery Pack Market Revenue Share (%), by Material Type 2024 & 2032
- Figure 56: Europe UK Electric Commercial Vehicle Battery Pack Market Revenue (Million), by Country 2024 & 2032
- Figure 57: Europe UK Electric Commercial Vehicle Battery Pack Market Revenue Share (%), by Country 2024 & 2032
- Figure 58: Middle East & Africa UK Electric Commercial Vehicle Battery Pack Market Revenue (Million), by Body Type 2024 & 2032
- Figure 59: Middle East & Africa UK Electric Commercial Vehicle Battery Pack Market Revenue Share (%), by Body Type 2024 & 2032
- Figure 60: Middle East & Africa UK Electric Commercial Vehicle Battery Pack Market Revenue (Million), by Propulsion Type 2024 & 2032
- Figure 61: Middle East & Africa UK Electric Commercial Vehicle Battery Pack Market Revenue Share (%), by Propulsion Type 2024 & 2032
- Figure 62: Middle East & Africa UK Electric Commercial Vehicle Battery Pack Market Revenue (Million), by Battery Chemistry 2024 & 2032
- Figure 63: Middle East & Africa UK Electric Commercial Vehicle Battery Pack Market Revenue Share (%), by Battery Chemistry 2024 & 2032
- Figure 64: Middle East & Africa UK Electric Commercial Vehicle Battery Pack Market Revenue (Million), by Capacity 2024 & 2032
- Figure 65: Middle East & Africa UK Electric Commercial Vehicle Battery Pack Market Revenue Share (%), by Capacity 2024 & 2032
- Figure 66: Middle East & Africa UK Electric Commercial Vehicle Battery Pack Market Revenue (Million), by Battery Form 2024 & 2032
- Figure 67: Middle East & Africa UK Electric Commercial Vehicle Battery Pack Market Revenue Share (%), by Battery Form 2024 & 2032
- Figure 68: Middle East & Africa UK Electric Commercial Vehicle Battery Pack Market Revenue (Million), by Method 2024 & 2032
- Figure 69: Middle East & Africa UK Electric Commercial Vehicle Battery Pack Market Revenue Share (%), by Method 2024 & 2032
- Figure 70: Middle East & Africa UK Electric Commercial Vehicle Battery Pack Market Revenue (Million), by Component 2024 & 2032
- Figure 71: Middle East & Africa UK Electric Commercial Vehicle Battery Pack Market Revenue Share (%), by Component 2024 & 2032
- Figure 72: Middle East & Africa UK Electric Commercial Vehicle Battery Pack Market Revenue (Million), by Material Type 2024 & 2032
- Figure 73: Middle East & Africa UK Electric Commercial Vehicle Battery Pack Market Revenue Share (%), by Material Type 2024 & 2032
- Figure 74: Middle East & Africa UK Electric Commercial Vehicle Battery Pack Market Revenue (Million), by Country 2024 & 2032
- Figure 75: Middle East & Africa UK Electric Commercial Vehicle Battery Pack Market Revenue Share (%), by Country 2024 & 2032
- Figure 76: Asia Pacific UK Electric Commercial Vehicle Battery Pack Market Revenue (Million), by Body Type 2024 & 2032
- Figure 77: Asia Pacific UK Electric Commercial Vehicle Battery Pack Market Revenue Share (%), by Body Type 2024 & 2032
- Figure 78: Asia Pacific UK Electric Commercial Vehicle Battery Pack Market Revenue (Million), by Propulsion Type 2024 & 2032
- Figure 79: Asia Pacific UK Electric Commercial Vehicle Battery Pack Market Revenue Share (%), by Propulsion Type 2024 & 2032
- Figure 80: Asia Pacific UK Electric Commercial Vehicle Battery Pack Market Revenue (Million), by Battery Chemistry 2024 & 2032
- Figure 81: Asia Pacific UK Electric Commercial Vehicle Battery Pack Market Revenue Share (%), by Battery Chemistry 2024 & 2032
- Figure 82: Asia Pacific UK Electric Commercial Vehicle Battery Pack Market Revenue (Million), by Capacity 2024 & 2032
- Figure 83: Asia Pacific UK Electric Commercial Vehicle Battery Pack Market Revenue Share (%), by Capacity 2024 & 2032
- Figure 84: Asia Pacific UK Electric Commercial Vehicle Battery Pack Market Revenue (Million), by Battery Form 2024 & 2032
- Figure 85: Asia Pacific UK Electric Commercial Vehicle Battery Pack Market Revenue Share (%), by Battery Form 2024 & 2032
- Figure 86: Asia Pacific UK Electric Commercial Vehicle Battery Pack Market Revenue (Million), by Method 2024 & 2032
- Figure 87: Asia Pacific UK Electric Commercial Vehicle Battery Pack Market Revenue Share (%), by Method 2024 & 2032
- Figure 88: Asia Pacific UK Electric Commercial Vehicle Battery Pack Market Revenue (Million), by Component 2024 & 2032
- Figure 89: Asia Pacific UK Electric Commercial Vehicle Battery Pack Market Revenue Share (%), by Component 2024 & 2032
- Figure 90: Asia Pacific UK Electric Commercial Vehicle Battery Pack Market Revenue (Million), by Material Type 2024 & 2032
- Figure 91: Asia Pacific UK Electric Commercial Vehicle Battery Pack Market Revenue Share (%), by Material Type 2024 & 2032
- Figure 92: Asia Pacific UK Electric Commercial Vehicle Battery Pack Market Revenue (Million), by Country 2024 & 2032
- Figure 93: Asia Pacific UK Electric Commercial Vehicle Battery Pack Market Revenue Share (%), by Country 2024 & 2032
List of Tables
- Table 1: Global UK Electric Commercial Vehicle Battery Pack Market Revenue Million Forecast, by Region 2019 & 2032
- Table 2: Global UK Electric Commercial Vehicle Battery Pack Market Revenue Million Forecast, by Body Type 2019 & 2032
- Table 3: Global UK Electric Commercial Vehicle Battery Pack Market Revenue Million Forecast, by Propulsion Type 2019 & 2032
- Table 4: Global UK Electric Commercial Vehicle Battery Pack Market Revenue Million Forecast, by Battery Chemistry 2019 & 2032
- Table 5: Global UK Electric Commercial Vehicle Battery Pack Market Revenue Million Forecast, by Capacity 2019 & 2032
- Table 6: Global UK Electric Commercial Vehicle Battery Pack Market Revenue Million Forecast, by Battery Form 2019 & 2032
- Table 7: Global UK Electric Commercial Vehicle Battery Pack Market Revenue Million Forecast, by Method 2019 & 2032
- Table 8: Global UK Electric Commercial Vehicle Battery Pack Market Revenue Million Forecast, by Component 2019 & 2032
- Table 9: Global UK Electric Commercial Vehicle Battery Pack Market Revenue Million Forecast, by Material Type 2019 & 2032
- Table 10: Global UK Electric Commercial Vehicle Battery Pack Market Revenue Million Forecast, by Region 2019 & 2032
- Table 11: Global UK Electric Commercial Vehicle Battery Pack Market Revenue Million Forecast, by Country 2019 & 2032
- Table 12: England UK Electric Commercial Vehicle Battery Pack Market Revenue (Million) Forecast, by Application 2019 & 2032
- Table 13: Wales UK Electric Commercial Vehicle Battery Pack Market Revenue (Million) Forecast, by Application 2019 & 2032
- Table 14: Scotland UK Electric Commercial Vehicle Battery Pack Market Revenue (Million) Forecast, by Application 2019 & 2032
- Table 15: Northern UK Electric Commercial Vehicle Battery Pack Market Revenue (Million) Forecast, by Application 2019 & 2032
- Table 16: Ireland UK Electric Commercial Vehicle Battery Pack Market Revenue (Million) Forecast, by Application 2019 & 2032
- Table 17: Global UK Electric Commercial Vehicle Battery Pack Market Revenue Million Forecast, by Body Type 2019 & 2032
- Table 18: Global UK Electric Commercial Vehicle Battery Pack Market Revenue Million Forecast, by Propulsion Type 2019 & 2032
- Table 19: Global UK Electric Commercial Vehicle Battery Pack Market Revenue Million Forecast, by Battery Chemistry 2019 & 2032
- Table 20: Global UK Electric Commercial Vehicle Battery Pack Market Revenue Million Forecast, by Capacity 2019 & 2032
- Table 21: Global UK Electric Commercial Vehicle Battery Pack Market Revenue Million Forecast, by Battery Form 2019 & 2032
- Table 22: Global UK Electric Commercial Vehicle Battery Pack Market Revenue Million Forecast, by Method 2019 & 2032
- Table 23: Global UK Electric Commercial Vehicle Battery Pack Market Revenue Million Forecast, by Component 2019 & 2032
- Table 24: Global UK Electric Commercial Vehicle Battery Pack Market Revenue Million Forecast, by Material Type 2019 & 2032
- Table 25: Global UK Electric Commercial Vehicle Battery Pack Market Revenue Million Forecast, by Country 2019 & 2032
- Table 26: United States UK Electric Commercial Vehicle Battery Pack Market Revenue (Million) Forecast, by Application 2019 & 2032
- Table 27: Canada UK Electric Commercial Vehicle Battery Pack Market Revenue (Million) Forecast, by Application 2019 & 2032
- Table 28: Mexico UK Electric Commercial Vehicle Battery Pack Market Revenue (Million) Forecast, by Application 2019 & 2032
- Table 29: Global UK Electric Commercial Vehicle Battery Pack Market Revenue Million Forecast, by Body Type 2019 & 2032
- Table 30: Global UK Electric Commercial Vehicle Battery Pack Market Revenue Million Forecast, by Propulsion Type 2019 & 2032
- Table 31: Global UK Electric Commercial Vehicle Battery Pack Market Revenue Million Forecast, by Battery Chemistry 2019 & 2032
- Table 32: Global UK Electric Commercial Vehicle Battery Pack Market Revenue Million Forecast, by Capacity 2019 & 2032
- Table 33: Global UK Electric Commercial Vehicle Battery Pack Market Revenue Million Forecast, by Battery Form 2019 & 2032
- Table 34: Global UK Electric Commercial Vehicle Battery Pack Market Revenue Million Forecast, by Method 2019 & 2032
- Table 35: Global UK Electric Commercial Vehicle Battery Pack Market Revenue Million Forecast, by Component 2019 & 2032
- Table 36: Global UK Electric Commercial Vehicle Battery Pack Market Revenue Million Forecast, by Material Type 2019 & 2032
- Table 37: Global UK Electric Commercial Vehicle Battery Pack Market Revenue Million Forecast, by Country 2019 & 2032
- Table 38: Brazil UK Electric Commercial Vehicle Battery Pack Market Revenue (Million) Forecast, by Application 2019 & 2032
- Table 39: Argentina UK Electric Commercial Vehicle Battery Pack Market Revenue (Million) Forecast, by Application 2019 & 2032
- Table 40: Rest of South America UK Electric Commercial Vehicle Battery Pack Market Revenue (Million) Forecast, by Application 2019 & 2032
- Table 41: Global UK Electric Commercial Vehicle Battery Pack Market Revenue Million Forecast, by Body Type 2019 & 2032
- Table 42: Global UK Electric Commercial Vehicle Battery Pack Market Revenue Million Forecast, by Propulsion Type 2019 & 2032
- Table 43: Global UK Electric Commercial Vehicle Battery Pack Market Revenue Million Forecast, by Battery Chemistry 2019 & 2032
- Table 44: Global UK Electric Commercial Vehicle Battery Pack Market Revenue Million Forecast, by Capacity 2019 & 2032
- Table 45: Global UK Electric Commercial Vehicle Battery Pack Market Revenue Million Forecast, by Battery Form 2019 & 2032
- Table 46: Global UK Electric Commercial Vehicle Battery Pack Market Revenue Million Forecast, by Method 2019 & 2032
- Table 47: Global UK Electric Commercial Vehicle Battery Pack Market Revenue Million Forecast, by Component 2019 & 2032
- Table 48: Global UK Electric Commercial Vehicle Battery Pack Market Revenue Million Forecast, by Material Type 2019 & 2032
- Table 49: Global UK Electric Commercial Vehicle Battery Pack Market Revenue Million Forecast, by Country 2019 & 2032
- Table 50: United Kingdom UK Electric Commercial Vehicle Battery Pack Market Revenue (Million) Forecast, by Application 2019 & 2032
- Table 51: Germany UK Electric Commercial Vehicle Battery Pack Market Revenue (Million) Forecast, by Application 2019 & 2032
- Table 52: France UK Electric Commercial Vehicle Battery Pack Market Revenue (Million) Forecast, by Application 2019 & 2032
- Table 53: Italy UK Electric Commercial Vehicle Battery Pack Market Revenue (Million) Forecast, by Application 2019 & 2032
- Table 54: Spain UK Electric Commercial Vehicle Battery Pack Market Revenue (Million) Forecast, by Application 2019 & 2032
- Table 55: Russia UK Electric Commercial Vehicle Battery Pack Market Revenue (Million) Forecast, by Application 2019 & 2032
- Table 56: Benelux UK Electric Commercial Vehicle Battery Pack Market Revenue (Million) Forecast, by Application 2019 & 2032
- Table 57: Nordics UK Electric Commercial Vehicle Battery Pack Market Revenue (Million) Forecast, by Application 2019 & 2032
- Table 58: Rest of Europe UK Electric Commercial Vehicle Battery Pack Market Revenue (Million) Forecast, by Application 2019 & 2032
- Table 59: Global UK Electric Commercial Vehicle Battery Pack Market Revenue Million Forecast, by Body Type 2019 & 2032
- Table 60: Global UK Electric Commercial Vehicle Battery Pack Market Revenue Million Forecast, by Propulsion Type 2019 & 2032
- Table 61: Global UK Electric Commercial Vehicle Battery Pack Market Revenue Million Forecast, by Battery Chemistry 2019 & 2032
- Table 62: Global UK Electric Commercial Vehicle Battery Pack Market Revenue Million Forecast, by Capacity 2019 & 2032
- Table 63: Global UK Electric Commercial Vehicle Battery Pack Market Revenue Million Forecast, by Battery Form 2019 & 2032
- Table 64: Global UK Electric Commercial Vehicle Battery Pack Market Revenue Million Forecast, by Method 2019 & 2032
- Table 65: Global UK Electric Commercial Vehicle Battery Pack Market Revenue Million Forecast, by Component 2019 & 2032
- Table 66: Global UK Electric Commercial Vehicle Battery Pack Market Revenue Million Forecast, by Material Type 2019 & 2032
- Table 67: Global UK Electric Commercial Vehicle Battery Pack Market Revenue Million Forecast, by Country 2019 & 2032
- Table 68: Turkey UK Electric Commercial Vehicle Battery Pack Market Revenue (Million) Forecast, by Application 2019 & 2032
- Table 69: Israel UK Electric Commercial Vehicle Battery Pack Market Revenue (Million) Forecast, by Application 2019 & 2032
- Table 70: GCC UK Electric Commercial Vehicle Battery Pack Market Revenue (Million) Forecast, by Application 2019 & 2032
- Table 71: North Africa UK Electric Commercial Vehicle Battery Pack Market Revenue (Million) Forecast, by Application 2019 & 2032
- Table 72: South Africa UK Electric Commercial Vehicle Battery Pack Market Revenue (Million) Forecast, by Application 2019 & 2032
- Table 73: Rest of Middle East & Africa UK Electric Commercial Vehicle Battery Pack Market Revenue (Million) Forecast, by Application 2019 & 2032
- Table 74: Global UK Electric Commercial Vehicle Battery Pack Market Revenue Million Forecast, by Body Type 2019 & 2032
- Table 75: Global UK Electric Commercial Vehicle Battery Pack Market Revenue Million Forecast, by Propulsion Type 2019 & 2032
- Table 76: Global UK Electric Commercial Vehicle Battery Pack Market Revenue Million Forecast, by Battery Chemistry 2019 & 2032
- Table 77: Global UK Electric Commercial Vehicle Battery Pack Market Revenue Million Forecast, by Capacity 2019 & 2032
- Table 78: Global UK Electric Commercial Vehicle Battery Pack Market Revenue Million Forecast, by Battery Form 2019 & 2032
- Table 79: Global UK Electric Commercial Vehicle Battery Pack Market Revenue Million Forecast, by Method 2019 & 2032
- Table 80: Global UK Electric Commercial Vehicle Battery Pack Market Revenue Million Forecast, by Component 2019 & 2032
- Table 81: Global UK Electric Commercial Vehicle Battery Pack Market Revenue Million Forecast, by Material Type 2019 & 2032
- Table 82: Global UK Electric Commercial Vehicle Battery Pack Market Revenue Million Forecast, by Country 2019 & 2032
- Table 83: China UK Electric Commercial Vehicle Battery Pack Market Revenue (Million) Forecast, by Application 2019 & 2032
- Table 84: India UK Electric Commercial Vehicle Battery Pack Market Revenue (Million) Forecast, by Application 2019 & 2032
- Table 85: Japan UK Electric Commercial Vehicle Battery Pack Market Revenue (Million) Forecast, by Application 2019 & 2032
- Table 86: South Korea UK Electric Commercial Vehicle Battery Pack Market Revenue (Million) Forecast, by Application 2019 & 2032
- Table 87: ASEAN UK Electric Commercial Vehicle Battery Pack Market Revenue (Million) Forecast, by Application 2019 & 2032
- Table 88: Oceania UK Electric Commercial Vehicle Battery Pack Market Revenue (Million) Forecast, by Application 2019 & 2032
- Table 89: Rest of Asia Pacific UK Electric Commercial Vehicle Battery Pack Market Revenue (Million) Forecast, by Application 2019 & 2032
Frequently Asked Questions
1. What is the projected Compound Annual Growth Rate (CAGR) of the UK Electric Commercial Vehicle Battery Pack Market?
The projected CAGR is approximately > 6.50%.
2. Which companies are prominent players in the UK Electric Commercial Vehicle Battery Pack Market?
Key companies in the market include ENVISION AESC UK Ltd, Ilika Technolgies Ltd, ZF Friedrichshafen A, Hyperdrive Innovation Holdings Ltd, Samsung SDI Co Ltd, LG Energy Solution Ltd, Power By Britishvolt Ltd, Contemporary Amperex Technology Co Ltd (CATL), Robert Bosch GmbH, BYD Company Ltd, Amte Power PLC, SK Innovation Co Ltd.
3. What are the main segments of the UK Electric Commercial Vehicle Battery Pack Market?
The market segments include Body Type, Propulsion Type, Battery Chemistry, Capacity, Battery Form, Method, Component, Material Type.
4. Can you provide details about the market size?
The market size is estimated to be USD XX Million as of 2022.
5. What are some drivers contributing to market growth?
Increasing Demand and Sales of Commercial Vehicles is Driving the Market for Hydraulic Systems.
6. What are the notable trends driving market growth?
OTHER KEY INDUSTRY TRENDS COVERED IN THE REPORT.
7. Are there any restraints impacting market growth?
Increasing Replacement of Conventional Hydraulic Systems with Fully-electric Hydraulic Systems Acts as a Restraint.
8. Can you provide examples of recent developments in the market?
January 2023: Ilika is leading an £8.2 million collaboration with industry experts to deliver its solid-state battery ready for automotive level performance.November 2022: AMTE Power PLC has received a conversion notice in respect of GBP150,000 worth of convertible loan notes from Arena Investors LP, resulting in the issue of 245,514 new shares at a conversion price of 61.10 pence each.October 2022: AMTE Power has agreed on a production contract with the UK Battery Industrialisation Centre for its Ultra High Power cells.
9. What pricing options are available for accessing the report?
Pricing options include single-user, multi-user, and enterprise licenses priced at USD 3800, USD 4500, and USD 5800 respectively.
10. Is the market size provided in terms of value or volume?
The market size is provided in terms of value, measured in Million.
11. Are there any specific market keywords associated with the report?
Yes, the market keyword associated with the report is "UK Electric Commercial Vehicle Battery Pack Market," which aids in identifying and referencing the specific market segment covered.
12. How do I determine which pricing option suits my needs best?
The pricing options vary based on user requirements and access needs. Individual users may opt for single-user licenses, while businesses requiring broader access may choose multi-user or enterprise licenses for cost-effective access to the report.
13. Are there any additional resources or data provided in the UK Electric Commercial Vehicle Battery Pack Market report?
While the report offers comprehensive insights, it's advisable to review the specific contents or supplementary materials provided to ascertain if additional resources or data are available.
14. How can I stay updated on further developments or reports in the UK Electric Commercial Vehicle Battery Pack Market?
To stay informed about further developments, trends, and reports in the UK Electric Commercial Vehicle Battery Pack Market, consider subscribing to industry newsletters, following relevant companies and organizations, or regularly checking reputable industry news sources and publications.
Methodology
Step 1 - Identification of Relevant Samples Size from Population Database


Step 2 - Approaches for Defining Global Market Size (Value, Volume* & Price*)

Note*: In applicable scenarios
Step 3 - Data Sources
Primary Research
- Web Analytics
- Survey Reports
- Research Institute
- Latest Research Reports
- Opinion Leaders
Secondary Research
- Annual Reports
- White Paper
- Latest Press Release
- Industry Association
- Paid Database
- Investor Presentations

Step 4 - Data Triangulation
Involves using different sources of information in order to increase the validity of a study
These sources are likely to be stakeholders in a program - participants, other researchers, program staff, other community members, and so on.
Then we put all data in single framework & apply various statistical tools to find out the dynamic on the market.
During the analysis stage, feedback from the stakeholder groups would be compared to determine areas of agreement as well as areas of divergence


