
Key Insights
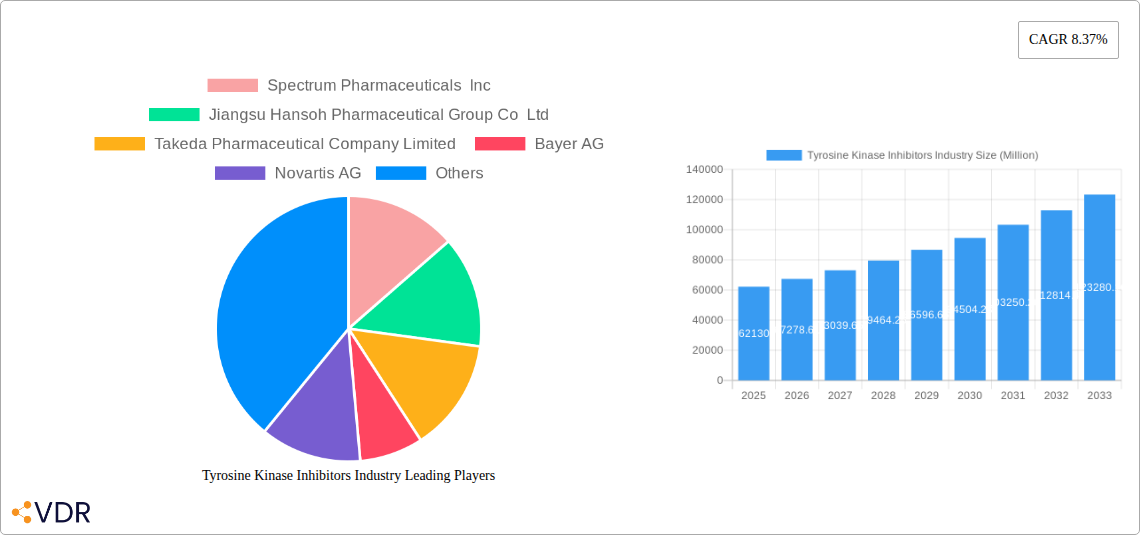
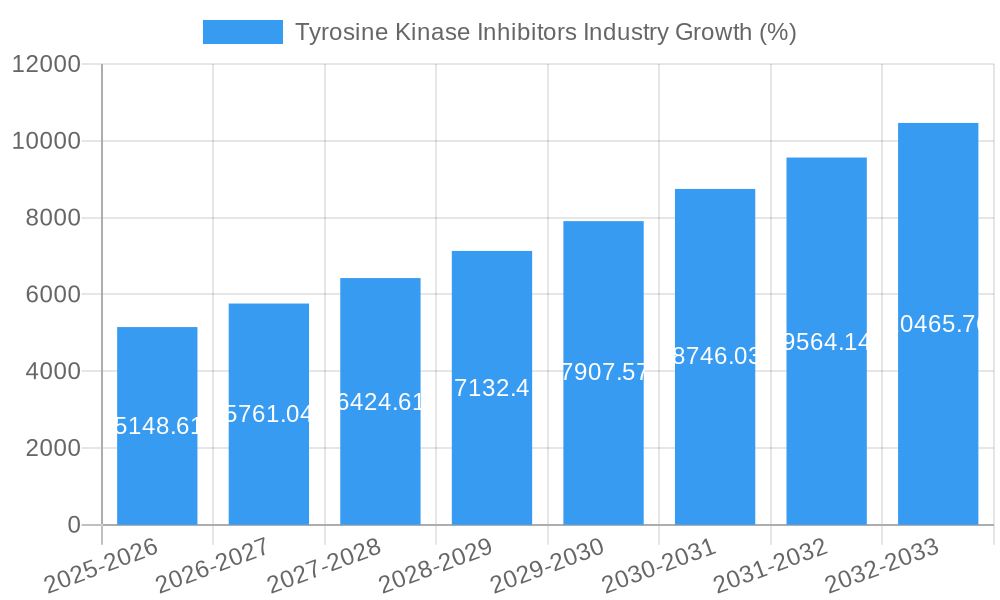
The Tyrosine Kinase Inhibitors (TKIs) market, valued at $62.13 billion in 2025, is projected for robust growth, driven by a Compound Annual Growth Rate (CAGR) of 8.37% from 2025 to 2033. This expansion is fueled by several key factors. Firstly, the increasing prevalence of cancers like Chronic Myeloid Leukemia (CML), lung cancer, and breast cancer, which are primary targets for TKIs, is significantly boosting market demand. Secondly, continuous advancements in TKI research and development are leading to the introduction of more effective and targeted therapies with improved safety profiles, attracting increased patient adoption and physician preference. Furthermore, the growing awareness about targeted therapies and the rising disposable incomes in emerging economies are further contributing to the market's positive trajectory. The market is segmented by type (BCR-ABL, EGFR, VEGFR, and others) and application (CML, lung cancer, breast cancer, renal cell carcinoma, and others), reflecting the diverse therapeutic applications of TKIs. Major players like Novartis, Roche, Pfizer, and AstraZeneca are actively engaged in research, development, and marketing, driving competition and innovation within the market.
The competitive landscape is characterized by the presence of both large multinational pharmaceutical companies and smaller specialized biotech firms. Large pharmaceutical companies possess significant resources for research, development, and marketing, enabling them to establish a strong market presence. Smaller companies, however, often focus on niche applications or innovative drug delivery systems, presenting a competitive challenge. Future growth will be shaped by factors such as the emergence of biosimilar TKIs, which could impact pricing dynamics, and the continued development of next-generation TKIs with improved efficacy and reduced side effects. The regulatory landscape also plays a crucial role, with approvals and reimbursement policies influencing market access and adoption rates in various regions. Geographic variations in healthcare infrastructure and cancer prevalence contribute to differing market growth rates across North America, Europe, Asia Pacific, and other regions.
Tyrosine Kinase Inhibitors (TKIs) Market Report: 2019-2033
This comprehensive report provides a detailed analysis of the Tyrosine Kinase Inhibitors (TKIs) market, encompassing market dynamics, growth trends, regional performance, product landscape, and key players. With a study period spanning 2019-2033, a base year of 2025, and a forecast period of 2025-2033, this report offers invaluable insights for industry professionals, investors, and stakeholders seeking to understand and capitalize on the opportunities within this rapidly evolving sector. The report analyzes both parent markets (oncology therapeutics) and child markets (specific TKI types and applications) for a granular view. The market size is presented in Million units.
Tyrosine Kinase Inhibitors Industry Market Dynamics & Structure
The Tyrosine Kinase Inhibitors (TKIs) market is characterized by a dynamic interplay of factors impacting its structure and growth trajectory. Market concentration is relatively high, with a few major pharmaceutical companies dominating the landscape. Technological innovation is a key driver, with ongoing research and development leading to the introduction of novel TKIs with improved efficacy and reduced side effects. Stringent regulatory frameworks govern the approval and marketing of TKIs, posing both challenges and opportunities for companies. Competitive pressures from biosimilar drugs and other treatment modalities are also significant. The end-user demographics are primarily patients with various types of cancer, including Chronic Myeloid Leukemia (CML), lung cancer, and others. The market has seen several significant mergers and acquisitions (M&A) in recent years, reflecting the intense competition and the pursuit of market share expansion.
- Market Concentration: High, with top 10 players holding xx% market share in 2024.
- Technological Innovation: Continuous development of targeted TKIs with enhanced specificity and reduced toxicity.
- Regulatory Frameworks: Stringent approval processes and post-market surveillance impact market entry and product lifecycle.
- Competitive Substitutes: Immunotherapy, chemotherapy, and other targeted therapies pose competitive challenges.
- M&A Activity: xx deals recorded between 2019 and 2024, valued at approximately xx Million.
- Innovation Barriers: High R&D costs, complex regulatory pathways, and the need for robust clinical trial data.
Tyrosine Kinase Inhibitors Industry Growth Trends & Insights
The TKI market has experienced significant growth over the past few years, driven by increasing cancer incidence, the rising adoption of targeted therapies, and advancements in TKI technology. The market size is estimated at xx Million in 2025, exhibiting a CAGR of xx% during the historical period (2019-2024). Technological disruptions, such as the development of next-generation TKIs with improved selectivity and efficacy, are further fueling market expansion. Shifts in consumer behavior, including increased patient awareness and demand for personalized medicine, are also contributing to market growth. The forecast period (2025-2033) projects continued expansion, with an expected CAGR of xx%, driven by factors such as the launch of new products, expansion into emerging markets, and increasing healthcare spending. Market penetration varies across different cancer types, with higher penetration rates observed in CML and lung cancer due to the established efficacy of TKIs in these indications.
Dominant Regions, Countries, or Segments in Tyrosine Kinase Inhibitors Industry
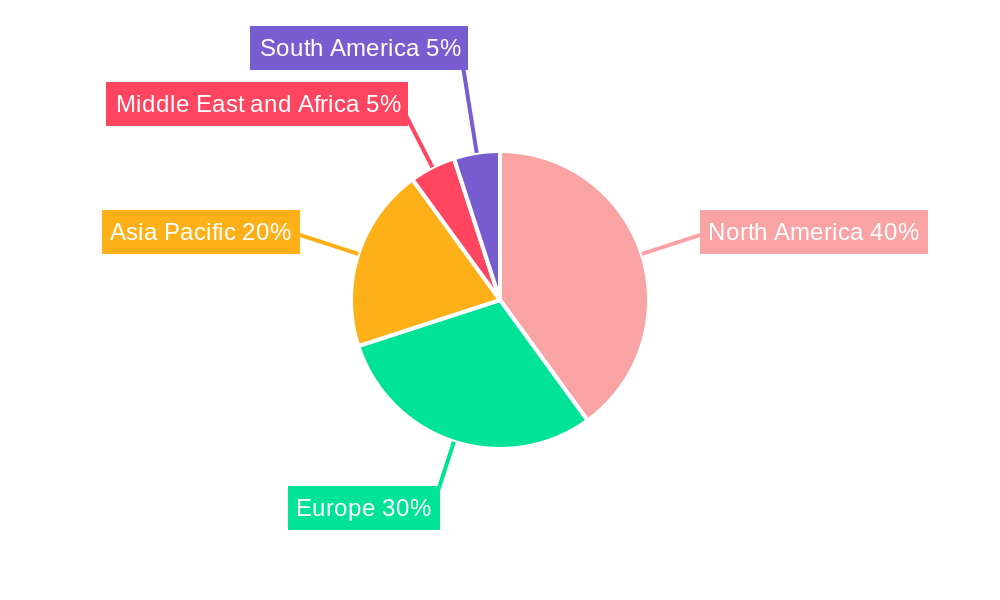
North America currently holds the largest market share in the TKI market, followed by Europe and Asia-Pacific. This dominance is attributed to factors such as higher healthcare expenditure, advanced healthcare infrastructure, and a high prevalence of cancer. Within the TKI market segmentation, EGFR TKIs and VEGFR TKIs hold significant market share, primarily driven by their widespread application in lung cancer and other solid tumors. The application segment dominated by lung cancer followed by CML due to the high incidence of these diseases and the proven efficacy of TKIs in their treatment.
- Leading Region: North America, driven by high healthcare spending and advanced infrastructure.
- Leading Application: Lung cancer, due to high prevalence and effectiveness of TKIs.
- Leading Type: EGFR TKIs, due to widespread use in various cancers.
- Key Drivers: Increasing cancer prevalence, rising healthcare expenditure, and advancements in TKI technology.
- Growth Potential: Significant growth potential exists in emerging markets, driven by increasing healthcare awareness and improved access to advanced therapies.
Tyrosine Kinase Inhibitors Industry Product Landscape
The TKI product landscape is characterized by a diverse range of products with varying mechanisms of action, efficacy profiles, and side-effect profiles. Product innovation focuses on enhancing target specificity, improving efficacy, and reducing toxicity. Technological advancements, such as the development of novel drug delivery systems, are aimed at improving patient compliance and reducing treatment-related side effects. Unique selling propositions often revolve around improved efficacy, reduced toxicity, and convenient administration.
Key Drivers, Barriers & Challenges in Tyrosine Kinase Inhibitors Industry
Key Drivers: Increasing cancer incidence, advancements in TKI technology leading to improved efficacy and safety, rising healthcare expenditure, and growing awareness among patients and healthcare professionals about targeted therapies.
Key Challenges: High R&D costs, stringent regulatory pathways, the emergence of drug resistance, and potential side effects associated with TKI use. The xx% failure rate in clinical trials represents a significant barrier to market entry for new TKIs. Supply chain disruptions can impact drug availability and affordability, leading to treatment delays.
Emerging Opportunities in Tyrosine Kinase Inhibitors Industry
Emerging opportunities in the TKI market include the development of novel TKIs targeting under-addressed cancer types, the exploration of combination therapies, and the development of personalized medicine approaches that tailor TKI treatment to individual patient characteristics. Untapped markets in emerging economies present a significant growth opportunity. The growing demand for biosimilars also represents a potential avenue for market expansion.
Growth Accelerators in the Tyrosine Kinase Inhibitors Industry
Long-term growth in the TKI market is driven by several factors, including technological breakthroughs leading to the development of novel TKIs with enhanced efficacy and safety profiles, strategic partnerships between pharmaceutical companies and research institutions to accelerate drug development, and market expansion into emerging economies with growing healthcare needs. Government initiatives supporting cancer research and access to advanced therapies also play a significant role in accelerating market growth.
Key Players Shaping the Tyrosine Kinase Inhibitors Industry Market
- Spectrum Pharmaceuticals Inc
- Jiangsu Hansoh Pharmaceutical Group Co Ltd
- Takeda Pharmaceutical Company Limited
- Bayer AG
- Novartis AG
- F Hoffmann-La Roche Ltd
- AstraZeneca PLC
- Eli Lilly and Company
- Johnson & Johnson
- Eisai Co Ltd
- Boehringer Ingelheim International
- Bristol-Myers Squibb Company
- Pfizer Inc
Notable Milestones in Tyrosine Kinase Inhibitors Industry Sector
- June 2022: The European Commission approved capmatinib (Tabrecta) for METex14-altered NSCLC.
- February 2022: The European Commission approved tepotinib (TEPMETKO) for advanced NSCLC.
In-Depth Tyrosine Kinase Inhibitors Industry Market Outlook
The future of the TKI market is bright, with continued growth driven by technological advancements, expanding applications, and increasing global healthcare spending. Strategic partnerships and acquisitions will play a crucial role in shaping the market landscape. The focus will increasingly shift towards personalized medicine and the development of combination therapies to improve treatment outcomes and address drug resistance. The market presents attractive opportunities for companies with innovative products and a strong commitment to research and development.
Tyrosine Kinase Inhibitors Industry Segmentation
-
1. Type
- 1.1. BCR-ABL Tyrosine Kinase Inhibitor
- 1.2. Epiderma
- 1.3. Vascular
- 1.4. Other Types
-
2. Application
- 2.1. Chronic Myeloid Leukemia (CML)
- 2.2. Lung Cancer
- 2.3. Breast Cancer
- 2.4. Renal Cell Cancer
- 2.5. Other Applications
Tyrosine Kinase Inhibitors Industry Segmentation By Geography
-
1. North America
- 1.1. United States
- 1.2. Canada
- 1.3. Mexico
-
2. Europe
- 2.1. Germany
- 2.2. United Kingdom
- 2.3. France
- 2.4. Italy
- 2.5. Spain
- 2.6. Rest of Europe
-
3. Asia Pacific
- 3.1. China
- 3.2. Japan
- 3.3. India
- 3.4. Australia
- 3.5. South Korea
- 3.6. Rest of Asia Pacific
-
4. Middle East and Africa
- 4.1. GCC
- 4.2. South Africa
- 4.3. Rest of Middle East and Africa
-
5. South America
- 5.1. Brazil
- 5.2. Argentina
- 5.3. Rest of South America
Tyrosine Kinase Inhibitors Industry REPORT HIGHLIGHTS
| Aspects | Details |
|---|---|
| Study Period | 2019-2033 |
| Base Year | 2024 |
| Estimated Year | 2025 |
| Forecast Period | 2025-2033 |
| Historical Period | 2019-2024 |
| Growth Rate | CAGR of 8.37% from 2019-2033 |
| Segmentation |
|
Table of Contents
- 1. Introduction
- 1.1. Research Scope
- 1.2. Market Segmentation
- 1.3. Research Methodology
- 1.4. Definitions and Assumptions
- 2. Executive Summary
- 2.1. Introduction
- 3. Market Dynamics
- 3.1. Introduction
- 3.2. Market Drivers
- 3.2.1. Increasing Prevalence of Cancer; Growing Research Activities and Investment in Tyrosine Kinase Inhibitors
- 3.3. Market Restrains
- 3.3.1. High Cost of Therapy
- 3.4. Market Trends
- 3.4.1. Breast Cancer Segment is Expected to Hold a Significant Market Share Over the Forecast Period
- 4. Market Factor Analysis
- 4.1. Porters Five Forces
- 4.2. Supply/Value Chain
- 4.3. PESTEL analysis
- 4.4. Market Entropy
- 4.5. Patent/Trademark Analysis
- 5. Global Tyrosine Kinase Inhibitors Industry Analysis, Insights and Forecast, 2019-2031
- 5.1. Market Analysis, Insights and Forecast - by Type
- 5.1.1. BCR-ABL Tyrosine Kinase Inhibitor
- 5.1.2. Epiderma
- 5.1.3. Vascular
- 5.1.4. Other Types
- 5.2. Market Analysis, Insights and Forecast - by Application
- 5.2.1. Chronic Myeloid Leukemia (CML)
- 5.2.2. Lung Cancer
- 5.2.3. Breast Cancer
- 5.2.4. Renal Cell Cancer
- 5.2.5. Other Applications
- 5.3. Market Analysis, Insights and Forecast - by Region
- 5.3.1. North America
- 5.3.2. Europe
- 5.3.3. Asia Pacific
- 5.3.4. Middle East and Africa
- 5.3.5. South America
- 5.1. Market Analysis, Insights and Forecast - by Type
- 6. North America Tyrosine Kinase Inhibitors Industry Analysis, Insights and Forecast, 2019-2031
- 6.1. Market Analysis, Insights and Forecast - by Type
- 6.1.1. BCR-ABL Tyrosine Kinase Inhibitor
- 6.1.2. Epiderma
- 6.1.3. Vascular
- 6.1.4. Other Types
- 6.2. Market Analysis, Insights and Forecast - by Application
- 6.2.1. Chronic Myeloid Leukemia (CML)
- 6.2.2. Lung Cancer
- 6.2.3. Breast Cancer
- 6.2.4. Renal Cell Cancer
- 6.2.5. Other Applications
- 6.1. Market Analysis, Insights and Forecast - by Type
- 7. Europe Tyrosine Kinase Inhibitors Industry Analysis, Insights and Forecast, 2019-2031
- 7.1. Market Analysis, Insights and Forecast - by Type
- 7.1.1. BCR-ABL Tyrosine Kinase Inhibitor
- 7.1.2. Epiderma
- 7.1.3. Vascular
- 7.1.4. Other Types
- 7.2. Market Analysis, Insights and Forecast - by Application
- 7.2.1. Chronic Myeloid Leukemia (CML)
- 7.2.2. Lung Cancer
- 7.2.3. Breast Cancer
- 7.2.4. Renal Cell Cancer
- 7.2.5. Other Applications
- 7.1. Market Analysis, Insights and Forecast - by Type
- 8. Asia Pacific Tyrosine Kinase Inhibitors Industry Analysis, Insights and Forecast, 2019-2031
- 8.1. Market Analysis, Insights and Forecast - by Type
- 8.1.1. BCR-ABL Tyrosine Kinase Inhibitor
- 8.1.2. Epiderma
- 8.1.3. Vascular
- 8.1.4. Other Types
- 8.2. Market Analysis, Insights and Forecast - by Application
- 8.2.1. Chronic Myeloid Leukemia (CML)
- 8.2.2. Lung Cancer
- 8.2.3. Breast Cancer
- 8.2.4. Renal Cell Cancer
- 8.2.5. Other Applications
- 8.1. Market Analysis, Insights and Forecast - by Type
- 9. Middle East and Africa Tyrosine Kinase Inhibitors Industry Analysis, Insights and Forecast, 2019-2031
- 9.1. Market Analysis, Insights and Forecast - by Type
- 9.1.1. BCR-ABL Tyrosine Kinase Inhibitor
- 9.1.2. Epiderma
- 9.1.3. Vascular
- 9.1.4. Other Types
- 9.2. Market Analysis, Insights and Forecast - by Application
- 9.2.1. Chronic Myeloid Leukemia (CML)
- 9.2.2. Lung Cancer
- 9.2.3. Breast Cancer
- 9.2.4. Renal Cell Cancer
- 9.2.5. Other Applications
- 9.1. Market Analysis, Insights and Forecast - by Type
- 10. South America Tyrosine Kinase Inhibitors Industry Analysis, Insights and Forecast, 2019-2031
- 10.1. Market Analysis, Insights and Forecast - by Type
- 10.1.1. BCR-ABL Tyrosine Kinase Inhibitor
- 10.1.2. Epiderma
- 10.1.3. Vascular
- 10.1.4. Other Types
- 10.2. Market Analysis, Insights and Forecast - by Application
- 10.2.1. Chronic Myeloid Leukemia (CML)
- 10.2.2. Lung Cancer
- 10.2.3. Breast Cancer
- 10.2.4. Renal Cell Cancer
- 10.2.5. Other Applications
- 10.1. Market Analysis, Insights and Forecast - by Type
- 11. North America Tyrosine Kinase Inhibitors Industry Analysis, Insights and Forecast, 2019-2031
- 11.1. Market Analysis, Insights and Forecast - By Country/Sub-region
- 11.1.1. undefined
- 12. Europe Tyrosine Kinase Inhibitors Industry Analysis, Insights and Forecast, 2019-2031
- 12.1. Market Analysis, Insights and Forecast - By Country/Sub-region
- 12.1.1. undefined
- 13. Asia Pacific Tyrosine Kinase Inhibitors Industry Analysis, Insights and Forecast, 2019-2031
- 13.1. Market Analysis, Insights and Forecast - By Country/Sub-region
- 13.1.1. undefined
- 14. Middle East and Africa Tyrosine Kinase Inhibitors Industry Analysis, Insights and Forecast, 2019-2031
- 14.1. Market Analysis, Insights and Forecast - By Country/Sub-region
- 14.1.1. undefined
- 15. South America Tyrosine Kinase Inhibitors Industry Analysis, Insights and Forecast, 2019-2031
- 15.1. Market Analysis, Insights and Forecast - By Country/Sub-region
- 15.1.1. undefined
- 16. Competitive Analysis
- 16.1. Global Market Share Analysis 2024
- 16.2. Company Profiles
- 16.2.1 Spectrum Pharmaceuticals Inc
- 16.2.1.1. Overview
- 16.2.1.2. Products
- 16.2.1.3. SWOT Analysis
- 16.2.1.4. Recent Developments
- 16.2.1.5. Financials (Based on Availability)
- 16.2.2 Jiangsu Hansoh Pharmaceutical Group Co Ltd
- 16.2.2.1. Overview
- 16.2.2.2. Products
- 16.2.2.3. SWOT Analysis
- 16.2.2.4. Recent Developments
- 16.2.2.5. Financials (Based on Availability)
- 16.2.3 Takeda Pharmaceutical Company Limited
- 16.2.3.1. Overview
- 16.2.3.2. Products
- 16.2.3.3. SWOT Analysis
- 16.2.3.4. Recent Developments
- 16.2.3.5. Financials (Based on Availability)
- 16.2.4 Bayer AG
- 16.2.4.1. Overview
- 16.2.4.2. Products
- 16.2.4.3. SWOT Analysis
- 16.2.4.4. Recent Developments
- 16.2.4.5. Financials (Based on Availability)
- 16.2.5 Novartis AG
- 16.2.5.1. Overview
- 16.2.5.2. Products
- 16.2.5.3. SWOT Analysis
- 16.2.5.4. Recent Developments
- 16.2.5.5. Financials (Based on Availability)
- 16.2.6 F Hoffmann-La Roche Ltd
- 16.2.6.1. Overview
- 16.2.6.2. Products
- 16.2.6.3. SWOT Analysis
- 16.2.6.4. Recent Developments
- 16.2.6.5. Financials (Based on Availability)
- 16.2.7 AstraZeneca PLC
- 16.2.7.1. Overview
- 16.2.7.2. Products
- 16.2.7.3. SWOT Analysis
- 16.2.7.4. Recent Developments
- 16.2.7.5. Financials (Based on Availability)
- 16.2.8 Eli Lilly and Company
- 16.2.8.1. Overview
- 16.2.8.2. Products
- 16.2.8.3. SWOT Analysis
- 16.2.8.4. Recent Developments
- 16.2.8.5. Financials (Based on Availability)
- 16.2.9 Johnson and Johnson
- 16.2.9.1. Overview
- 16.2.9.2. Products
- 16.2.9.3. SWOT Analysis
- 16.2.9.4. Recent Developments
- 16.2.9.5. Financials (Based on Availability)
- 16.2.10 Eisai Co Ltd
- 16.2.10.1. Overview
- 16.2.10.2. Products
- 16.2.10.3. SWOT Analysis
- 16.2.10.4. Recent Developments
- 16.2.10.5. Financials (Based on Availability)
- 16.2.11 Boehringer Ingelheim International
- 16.2.11.1. Overview
- 16.2.11.2. Products
- 16.2.11.3. SWOT Analysis
- 16.2.11.4. Recent Developments
- 16.2.11.5. Financials (Based on Availability)
- 16.2.12 Bristol-Myers Squibb Company
- 16.2.12.1. Overview
- 16.2.12.2. Products
- 16.2.12.3. SWOT Analysis
- 16.2.12.4. Recent Developments
- 16.2.12.5. Financials (Based on Availability)
- 16.2.13 Pfizer Inc
- 16.2.13.1. Overview
- 16.2.13.2. Products
- 16.2.13.3. SWOT Analysis
- 16.2.13.4. Recent Developments
- 16.2.13.5. Financials (Based on Availability)
- 16.2.1 Spectrum Pharmaceuticals Inc
List of Figures
- Figure 1: Global Tyrosine Kinase Inhibitors Industry Revenue Breakdown (Million, %) by Region 2024 & 2032
- Figure 2: Global Tyrosine Kinase Inhibitors Industry Volume Breakdown (K Unit, %) by Region 2024 & 2032
- Figure 3: North America Tyrosine Kinase Inhibitors Industry Revenue (Million), by Country 2024 & 2032
- Figure 4: North America Tyrosine Kinase Inhibitors Industry Volume (K Unit), by Country 2024 & 2032
- Figure 5: North America Tyrosine Kinase Inhibitors Industry Revenue Share (%), by Country 2024 & 2032
- Figure 6: North America Tyrosine Kinase Inhibitors Industry Volume Share (%), by Country 2024 & 2032
- Figure 7: Europe Tyrosine Kinase Inhibitors Industry Revenue (Million), by Country 2024 & 2032
- Figure 8: Europe Tyrosine Kinase Inhibitors Industry Volume (K Unit), by Country 2024 & 2032
- Figure 9: Europe Tyrosine Kinase Inhibitors Industry Revenue Share (%), by Country 2024 & 2032
- Figure 10: Europe Tyrosine Kinase Inhibitors Industry Volume Share (%), by Country 2024 & 2032
- Figure 11: Asia Pacific Tyrosine Kinase Inhibitors Industry Revenue (Million), by Country 2024 & 2032
- Figure 12: Asia Pacific Tyrosine Kinase Inhibitors Industry Volume (K Unit), by Country 2024 & 2032
- Figure 13: Asia Pacific Tyrosine Kinase Inhibitors Industry Revenue Share (%), by Country 2024 & 2032
- Figure 14: Asia Pacific Tyrosine Kinase Inhibitors Industry Volume Share (%), by Country 2024 & 2032
- Figure 15: Middle East and Africa Tyrosine Kinase Inhibitors Industry Revenue (Million), by Country 2024 & 2032
- Figure 16: Middle East and Africa Tyrosine Kinase Inhibitors Industry Volume (K Unit), by Country 2024 & 2032
- Figure 17: Middle East and Africa Tyrosine Kinase Inhibitors Industry Revenue Share (%), by Country 2024 & 2032
- Figure 18: Middle East and Africa Tyrosine Kinase Inhibitors Industry Volume Share (%), by Country 2024 & 2032
- Figure 19: South America Tyrosine Kinase Inhibitors Industry Revenue (Million), by Country 2024 & 2032
- Figure 20: South America Tyrosine Kinase Inhibitors Industry Volume (K Unit), by Country 2024 & 2032
- Figure 21: South America Tyrosine Kinase Inhibitors Industry Revenue Share (%), by Country 2024 & 2032
- Figure 22: South America Tyrosine Kinase Inhibitors Industry Volume Share (%), by Country 2024 & 2032
- Figure 23: North America Tyrosine Kinase Inhibitors Industry Revenue (Million), by Type 2024 & 2032
- Figure 24: North America Tyrosine Kinase Inhibitors Industry Volume (K Unit), by Type 2024 & 2032
- Figure 25: North America Tyrosine Kinase Inhibitors Industry Revenue Share (%), by Type 2024 & 2032
- Figure 26: North America Tyrosine Kinase Inhibitors Industry Volume Share (%), by Type 2024 & 2032
- Figure 27: North America Tyrosine Kinase Inhibitors Industry Revenue (Million), by Application 2024 & 2032
- Figure 28: North America Tyrosine Kinase Inhibitors Industry Volume (K Unit), by Application 2024 & 2032
- Figure 29: North America Tyrosine Kinase Inhibitors Industry Revenue Share (%), by Application 2024 & 2032
- Figure 30: North America Tyrosine Kinase Inhibitors Industry Volume Share (%), by Application 2024 & 2032
- Figure 31: North America Tyrosine Kinase Inhibitors Industry Revenue (Million), by Country 2024 & 2032
- Figure 32: North America Tyrosine Kinase Inhibitors Industry Volume (K Unit), by Country 2024 & 2032
- Figure 33: North America Tyrosine Kinase Inhibitors Industry Revenue Share (%), by Country 2024 & 2032
- Figure 34: North America Tyrosine Kinase Inhibitors Industry Volume Share (%), by Country 2024 & 2032
- Figure 35: Europe Tyrosine Kinase Inhibitors Industry Revenue (Million), by Type 2024 & 2032
- Figure 36: Europe Tyrosine Kinase Inhibitors Industry Volume (K Unit), by Type 2024 & 2032
- Figure 37: Europe Tyrosine Kinase Inhibitors Industry Revenue Share (%), by Type 2024 & 2032
- Figure 38: Europe Tyrosine Kinase Inhibitors Industry Volume Share (%), by Type 2024 & 2032
- Figure 39: Europe Tyrosine Kinase Inhibitors Industry Revenue (Million), by Application 2024 & 2032
- Figure 40: Europe Tyrosine Kinase Inhibitors Industry Volume (K Unit), by Application 2024 & 2032
- Figure 41: Europe Tyrosine Kinase Inhibitors Industry Revenue Share (%), by Application 2024 & 2032
- Figure 42: Europe Tyrosine Kinase Inhibitors Industry Volume Share (%), by Application 2024 & 2032
- Figure 43: Europe Tyrosine Kinase Inhibitors Industry Revenue (Million), by Country 2024 & 2032
- Figure 44: Europe Tyrosine Kinase Inhibitors Industry Volume (K Unit), by Country 2024 & 2032
- Figure 45: Europe Tyrosine Kinase Inhibitors Industry Revenue Share (%), by Country 2024 & 2032
- Figure 46: Europe Tyrosine Kinase Inhibitors Industry Volume Share (%), by Country 2024 & 2032
- Figure 47: Asia Pacific Tyrosine Kinase Inhibitors Industry Revenue (Million), by Type 2024 & 2032
- Figure 48: Asia Pacific Tyrosine Kinase Inhibitors Industry Volume (K Unit), by Type 2024 & 2032
- Figure 49: Asia Pacific Tyrosine Kinase Inhibitors Industry Revenue Share (%), by Type 2024 & 2032
- Figure 50: Asia Pacific Tyrosine Kinase Inhibitors Industry Volume Share (%), by Type 2024 & 2032
- Figure 51: Asia Pacific Tyrosine Kinase Inhibitors Industry Revenue (Million), by Application 2024 & 2032
- Figure 52: Asia Pacific Tyrosine Kinase Inhibitors Industry Volume (K Unit), by Application 2024 & 2032
- Figure 53: Asia Pacific Tyrosine Kinase Inhibitors Industry Revenue Share (%), by Application 2024 & 2032
- Figure 54: Asia Pacific Tyrosine Kinase Inhibitors Industry Volume Share (%), by Application 2024 & 2032
- Figure 55: Asia Pacific Tyrosine Kinase Inhibitors Industry Revenue (Million), by Country 2024 & 2032
- Figure 56: Asia Pacific Tyrosine Kinase Inhibitors Industry Volume (K Unit), by Country 2024 & 2032
- Figure 57: Asia Pacific Tyrosine Kinase Inhibitors Industry Revenue Share (%), by Country 2024 & 2032
- Figure 58: Asia Pacific Tyrosine Kinase Inhibitors Industry Volume Share (%), by Country 2024 & 2032
- Figure 59: Middle East and Africa Tyrosine Kinase Inhibitors Industry Revenue (Million), by Type 2024 & 2032
- Figure 60: Middle East and Africa Tyrosine Kinase Inhibitors Industry Volume (K Unit), by Type 2024 & 2032
- Figure 61: Middle East and Africa Tyrosine Kinase Inhibitors Industry Revenue Share (%), by Type 2024 & 2032
- Figure 62: Middle East and Africa Tyrosine Kinase Inhibitors Industry Volume Share (%), by Type 2024 & 2032
- Figure 63: Middle East and Africa Tyrosine Kinase Inhibitors Industry Revenue (Million), by Application 2024 & 2032
- Figure 64: Middle East and Africa Tyrosine Kinase Inhibitors Industry Volume (K Unit), by Application 2024 & 2032
- Figure 65: Middle East and Africa Tyrosine Kinase Inhibitors Industry Revenue Share (%), by Application 2024 & 2032
- Figure 66: Middle East and Africa Tyrosine Kinase Inhibitors Industry Volume Share (%), by Application 2024 & 2032
- Figure 67: Middle East and Africa Tyrosine Kinase Inhibitors Industry Revenue (Million), by Country 2024 & 2032
- Figure 68: Middle East and Africa Tyrosine Kinase Inhibitors Industry Volume (K Unit), by Country 2024 & 2032
- Figure 69: Middle East and Africa Tyrosine Kinase Inhibitors Industry Revenue Share (%), by Country 2024 & 2032
- Figure 70: Middle East and Africa Tyrosine Kinase Inhibitors Industry Volume Share (%), by Country 2024 & 2032
- Figure 71: South America Tyrosine Kinase Inhibitors Industry Revenue (Million), by Type 2024 & 2032
- Figure 72: South America Tyrosine Kinase Inhibitors Industry Volume (K Unit), by Type 2024 & 2032
- Figure 73: South America Tyrosine Kinase Inhibitors Industry Revenue Share (%), by Type 2024 & 2032
- Figure 74: South America Tyrosine Kinase Inhibitors Industry Volume Share (%), by Type 2024 & 2032
- Figure 75: South America Tyrosine Kinase Inhibitors Industry Revenue (Million), by Application 2024 & 2032
- Figure 76: South America Tyrosine Kinase Inhibitors Industry Volume (K Unit), by Application 2024 & 2032
- Figure 77: South America Tyrosine Kinase Inhibitors Industry Revenue Share (%), by Application 2024 & 2032
- Figure 78: South America Tyrosine Kinase Inhibitors Industry Volume Share (%), by Application 2024 & 2032
- Figure 79: South America Tyrosine Kinase Inhibitors Industry Revenue (Million), by Country 2024 & 2032
- Figure 80: South America Tyrosine Kinase Inhibitors Industry Volume (K Unit), by Country 2024 & 2032
- Figure 81: South America Tyrosine Kinase Inhibitors Industry Revenue Share (%), by Country 2024 & 2032
- Figure 82: South America Tyrosine Kinase Inhibitors Industry Volume Share (%), by Country 2024 & 2032
List of Tables
- Table 1: Global Tyrosine Kinase Inhibitors Industry Revenue Million Forecast, by Region 2019 & 2032
- Table 2: Global Tyrosine Kinase Inhibitors Industry Volume K Unit Forecast, by Region 2019 & 2032
- Table 3: Global Tyrosine Kinase Inhibitors Industry Revenue Million Forecast, by Type 2019 & 2032
- Table 4: Global Tyrosine Kinase Inhibitors Industry Volume K Unit Forecast, by Type 2019 & 2032
- Table 5: Global Tyrosine Kinase Inhibitors Industry Revenue Million Forecast, by Application 2019 & 2032
- Table 6: Global Tyrosine Kinase Inhibitors Industry Volume K Unit Forecast, by Application 2019 & 2032
- Table 7: Global Tyrosine Kinase Inhibitors Industry Revenue Million Forecast, by Region 2019 & 2032
- Table 8: Global Tyrosine Kinase Inhibitors Industry Volume K Unit Forecast, by Region 2019 & 2032
- Table 9: Global Tyrosine Kinase Inhibitors Industry Revenue Million Forecast, by Country 2019 & 2032
- Table 10: Global Tyrosine Kinase Inhibitors Industry Volume K Unit Forecast, by Country 2019 & 2032
- Table 11: Global Tyrosine Kinase Inhibitors Industry Revenue Million Forecast, by Country 2019 & 2032
- Table 12: Global Tyrosine Kinase Inhibitors Industry Volume K Unit Forecast, by Country 2019 & 2032
- Table 13: Global Tyrosine Kinase Inhibitors Industry Revenue Million Forecast, by Country 2019 & 2032
- Table 14: Global Tyrosine Kinase Inhibitors Industry Volume K Unit Forecast, by Country 2019 & 2032
- Table 15: Global Tyrosine Kinase Inhibitors Industry Revenue Million Forecast, by Country 2019 & 2032
- Table 16: Global Tyrosine Kinase Inhibitors Industry Volume K Unit Forecast, by Country 2019 & 2032
- Table 17: Global Tyrosine Kinase Inhibitors Industry Revenue Million Forecast, by Country 2019 & 2032
- Table 18: Global Tyrosine Kinase Inhibitors Industry Volume K Unit Forecast, by Country 2019 & 2032
- Table 19: Global Tyrosine Kinase Inhibitors Industry Revenue Million Forecast, by Type 2019 & 2032
- Table 20: Global Tyrosine Kinase Inhibitors Industry Volume K Unit Forecast, by Type 2019 & 2032
- Table 21: Global Tyrosine Kinase Inhibitors Industry Revenue Million Forecast, by Application 2019 & 2032
- Table 22: Global Tyrosine Kinase Inhibitors Industry Volume K Unit Forecast, by Application 2019 & 2032
- Table 23: Global Tyrosine Kinase Inhibitors Industry Revenue Million Forecast, by Country 2019 & 2032
- Table 24: Global Tyrosine Kinase Inhibitors Industry Volume K Unit Forecast, by Country 2019 & 2032
- Table 25: United States Tyrosine Kinase Inhibitors Industry Revenue (Million) Forecast, by Application 2019 & 2032
- Table 26: United States Tyrosine Kinase Inhibitors Industry Volume (K Unit) Forecast, by Application 2019 & 2032
- Table 27: Canada Tyrosine Kinase Inhibitors Industry Revenue (Million) Forecast, by Application 2019 & 2032
- Table 28: Canada Tyrosine Kinase Inhibitors Industry Volume (K Unit) Forecast, by Application 2019 & 2032
- Table 29: Mexico Tyrosine Kinase Inhibitors Industry Revenue (Million) Forecast, by Application 2019 & 2032
- Table 30: Mexico Tyrosine Kinase Inhibitors Industry Volume (K Unit) Forecast, by Application 2019 & 2032
- Table 31: Global Tyrosine Kinase Inhibitors Industry Revenue Million Forecast, by Type 2019 & 2032
- Table 32: Global Tyrosine Kinase Inhibitors Industry Volume K Unit Forecast, by Type 2019 & 2032
- Table 33: Global Tyrosine Kinase Inhibitors Industry Revenue Million Forecast, by Application 2019 & 2032
- Table 34: Global Tyrosine Kinase Inhibitors Industry Volume K Unit Forecast, by Application 2019 & 2032
- Table 35: Global Tyrosine Kinase Inhibitors Industry Revenue Million Forecast, by Country 2019 & 2032
- Table 36: Global Tyrosine Kinase Inhibitors Industry Volume K Unit Forecast, by Country 2019 & 2032
- Table 37: Germany Tyrosine Kinase Inhibitors Industry Revenue (Million) Forecast, by Application 2019 & 2032
- Table 38: Germany Tyrosine Kinase Inhibitors Industry Volume (K Unit) Forecast, by Application 2019 & 2032
- Table 39: United Kingdom Tyrosine Kinase Inhibitors Industry Revenue (Million) Forecast, by Application 2019 & 2032
- Table 40: United Kingdom Tyrosine Kinase Inhibitors Industry Volume (K Unit) Forecast, by Application 2019 & 2032
- Table 41: France Tyrosine Kinase Inhibitors Industry Revenue (Million) Forecast, by Application 2019 & 2032
- Table 42: France Tyrosine Kinase Inhibitors Industry Volume (K Unit) Forecast, by Application 2019 & 2032
- Table 43: Italy Tyrosine Kinase Inhibitors Industry Revenue (Million) Forecast, by Application 2019 & 2032
- Table 44: Italy Tyrosine Kinase Inhibitors Industry Volume (K Unit) Forecast, by Application 2019 & 2032
- Table 45: Spain Tyrosine Kinase Inhibitors Industry Revenue (Million) Forecast, by Application 2019 & 2032
- Table 46: Spain Tyrosine Kinase Inhibitors Industry Volume (K Unit) Forecast, by Application 2019 & 2032
- Table 47: Rest of Europe Tyrosine Kinase Inhibitors Industry Revenue (Million) Forecast, by Application 2019 & 2032
- Table 48: Rest of Europe Tyrosine Kinase Inhibitors Industry Volume (K Unit) Forecast, by Application 2019 & 2032
- Table 49: Global Tyrosine Kinase Inhibitors Industry Revenue Million Forecast, by Type 2019 & 2032
- Table 50: Global Tyrosine Kinase Inhibitors Industry Volume K Unit Forecast, by Type 2019 & 2032
- Table 51: Global Tyrosine Kinase Inhibitors Industry Revenue Million Forecast, by Application 2019 & 2032
- Table 52: Global Tyrosine Kinase Inhibitors Industry Volume K Unit Forecast, by Application 2019 & 2032
- Table 53: Global Tyrosine Kinase Inhibitors Industry Revenue Million Forecast, by Country 2019 & 2032
- Table 54: Global Tyrosine Kinase Inhibitors Industry Volume K Unit Forecast, by Country 2019 & 2032
- Table 55: China Tyrosine Kinase Inhibitors Industry Revenue (Million) Forecast, by Application 2019 & 2032
- Table 56: China Tyrosine Kinase Inhibitors Industry Volume (K Unit) Forecast, by Application 2019 & 2032
- Table 57: Japan Tyrosine Kinase Inhibitors Industry Revenue (Million) Forecast, by Application 2019 & 2032
- Table 58: Japan Tyrosine Kinase Inhibitors Industry Volume (K Unit) Forecast, by Application 2019 & 2032
- Table 59: India Tyrosine Kinase Inhibitors Industry Revenue (Million) Forecast, by Application 2019 & 2032
- Table 60: India Tyrosine Kinase Inhibitors Industry Volume (K Unit) Forecast, by Application 2019 & 2032
- Table 61: Australia Tyrosine Kinase Inhibitors Industry Revenue (Million) Forecast, by Application 2019 & 2032
- Table 62: Australia Tyrosine Kinase Inhibitors Industry Volume (K Unit) Forecast, by Application 2019 & 2032
- Table 63: South Korea Tyrosine Kinase Inhibitors Industry Revenue (Million) Forecast, by Application 2019 & 2032
- Table 64: South Korea Tyrosine Kinase Inhibitors Industry Volume (K Unit) Forecast, by Application 2019 & 2032
- Table 65: Rest of Asia Pacific Tyrosine Kinase Inhibitors Industry Revenue (Million) Forecast, by Application 2019 & 2032
- Table 66: Rest of Asia Pacific Tyrosine Kinase Inhibitors Industry Volume (K Unit) Forecast, by Application 2019 & 2032
- Table 67: Global Tyrosine Kinase Inhibitors Industry Revenue Million Forecast, by Type 2019 & 2032
- Table 68: Global Tyrosine Kinase Inhibitors Industry Volume K Unit Forecast, by Type 2019 & 2032
- Table 69: Global Tyrosine Kinase Inhibitors Industry Revenue Million Forecast, by Application 2019 & 2032
- Table 70: Global Tyrosine Kinase Inhibitors Industry Volume K Unit Forecast, by Application 2019 & 2032
- Table 71: Global Tyrosine Kinase Inhibitors Industry Revenue Million Forecast, by Country 2019 & 2032
- Table 72: Global Tyrosine Kinase Inhibitors Industry Volume K Unit Forecast, by Country 2019 & 2032
- Table 73: GCC Tyrosine Kinase Inhibitors Industry Revenue (Million) Forecast, by Application 2019 & 2032
- Table 74: GCC Tyrosine Kinase Inhibitors Industry Volume (K Unit) Forecast, by Application 2019 & 2032
- Table 75: South Africa Tyrosine Kinase Inhibitors Industry Revenue (Million) Forecast, by Application 2019 & 2032
- Table 76: South Africa Tyrosine Kinase Inhibitors Industry Volume (K Unit) Forecast, by Application 2019 & 2032
- Table 77: Rest of Middle East and Africa Tyrosine Kinase Inhibitors Industry Revenue (Million) Forecast, by Application 2019 & 2032
- Table 78: Rest of Middle East and Africa Tyrosine Kinase Inhibitors Industry Volume (K Unit) Forecast, by Application 2019 & 2032
- Table 79: Global Tyrosine Kinase Inhibitors Industry Revenue Million Forecast, by Type 2019 & 2032
- Table 80: Global Tyrosine Kinase Inhibitors Industry Volume K Unit Forecast, by Type 2019 & 2032
- Table 81: Global Tyrosine Kinase Inhibitors Industry Revenue Million Forecast, by Application 2019 & 2032
- Table 82: Global Tyrosine Kinase Inhibitors Industry Volume K Unit Forecast, by Application 2019 & 2032
- Table 83: Global Tyrosine Kinase Inhibitors Industry Revenue Million Forecast, by Country 2019 & 2032
- Table 84: Global Tyrosine Kinase Inhibitors Industry Volume K Unit Forecast, by Country 2019 & 2032
- Table 85: Brazil Tyrosine Kinase Inhibitors Industry Revenue (Million) Forecast, by Application 2019 & 2032
- Table 86: Brazil Tyrosine Kinase Inhibitors Industry Volume (K Unit) Forecast, by Application 2019 & 2032
- Table 87: Argentina Tyrosine Kinase Inhibitors Industry Revenue (Million) Forecast, by Application 2019 & 2032
- Table 88: Argentina Tyrosine Kinase Inhibitors Industry Volume (K Unit) Forecast, by Application 2019 & 2032
- Table 89: Rest of South America Tyrosine Kinase Inhibitors Industry Revenue (Million) Forecast, by Application 2019 & 2032
- Table 90: Rest of South America Tyrosine Kinase Inhibitors Industry Volume (K Unit) Forecast, by Application 2019 & 2032
Frequently Asked Questions
1. What is the projected Compound Annual Growth Rate (CAGR) of the Tyrosine Kinase Inhibitors Industry?
The projected CAGR is approximately 8.37%.
2. Which companies are prominent players in the Tyrosine Kinase Inhibitors Industry?
Key companies in the market include Spectrum Pharmaceuticals Inc, Jiangsu Hansoh Pharmaceutical Group Co Ltd, Takeda Pharmaceutical Company Limited , Bayer AG, Novartis AG, F Hoffmann-La Roche Ltd, AstraZeneca PLC, Eli Lilly and Company, Johnson and Johnson, Eisai Co Ltd, Boehringer Ingelheim International, Bristol-Myers Squibb Company, Pfizer Inc.
3. What are the main segments of the Tyrosine Kinase Inhibitors Industry?
The market segments include Type, Application.
4. Can you provide details about the market size?
The market size is estimated to be USD 62.13 Million as of 2022.
5. What are some drivers contributing to market growth?
Increasing Prevalence of Cancer; Growing Research Activities and Investment in Tyrosine Kinase Inhibitors.
6. What are the notable trends driving market growth?
Breast Cancer Segment is Expected to Hold a Significant Market Share Over the Forecast Period.
7. Are there any restraints impacting market growth?
High Cost of Therapy.
8. Can you provide examples of recent developments in the market?
In June 2022, The European Commission approved capmatinib (Tabrecta), a tyrosine kinase inhibitor, as a single agent for the treatment of patients with MET exon14 skipping (METex14) altered advanced non-small cell lung cancer (NSCLC) who require systemic therapy following prior treatment with immunotherapy and/or platinum-based chemotherapy.
9. What pricing options are available for accessing the report?
Pricing options include single-user, multi-user, and enterprise licenses priced at USD 4750, USD 5250, and USD 8750 respectively.
10. Is the market size provided in terms of value or volume?
The market size is provided in terms of value, measured in Million and volume, measured in K Unit.
11. Are there any specific market keywords associated with the report?
Yes, the market keyword associated with the report is "Tyrosine Kinase Inhibitors Industry," which aids in identifying and referencing the specific market segment covered.
12. How do I determine which pricing option suits my needs best?
The pricing options vary based on user requirements and access needs. Individual users may opt for single-user licenses, while businesses requiring broader access may choose multi-user or enterprise licenses for cost-effective access to the report.
13. Are there any additional resources or data provided in the Tyrosine Kinase Inhibitors Industry report?
While the report offers comprehensive insights, it's advisable to review the specific contents or supplementary materials provided to ascertain if additional resources or data are available.
14. How can I stay updated on further developments or reports in the Tyrosine Kinase Inhibitors Industry?
To stay informed about further developments, trends, and reports in the Tyrosine Kinase Inhibitors Industry, consider subscribing to industry newsletters, following relevant companies and organizations, or regularly checking reputable industry news sources and publications.
Methodology
Step 1 - Identification of Relevant Samples Size from Population Database


Step 2 - Approaches for Defining Global Market Size (Value, Volume* & Price*)

Note*: In applicable scenarios
Step 3 - Data Sources
Primary Research
- Web Analytics
- Survey Reports
- Research Institute
- Latest Research Reports
- Opinion Leaders
Secondary Research
- Annual Reports
- White Paper
- Latest Press Release
- Industry Association
- Paid Database
- Investor Presentations

Step 4 - Data Triangulation
Involves using different sources of information in order to increase the validity of a study
These sources are likely to be stakeholders in a program - participants, other researchers, program staff, other community members, and so on.
Then we put all data in single framework & apply various statistical tools to find out the dynamic on the market.
During the analysis stage, feedback from the stakeholder groups would be compared to determine areas of agreement as well as areas of divergence


