

Key Insights
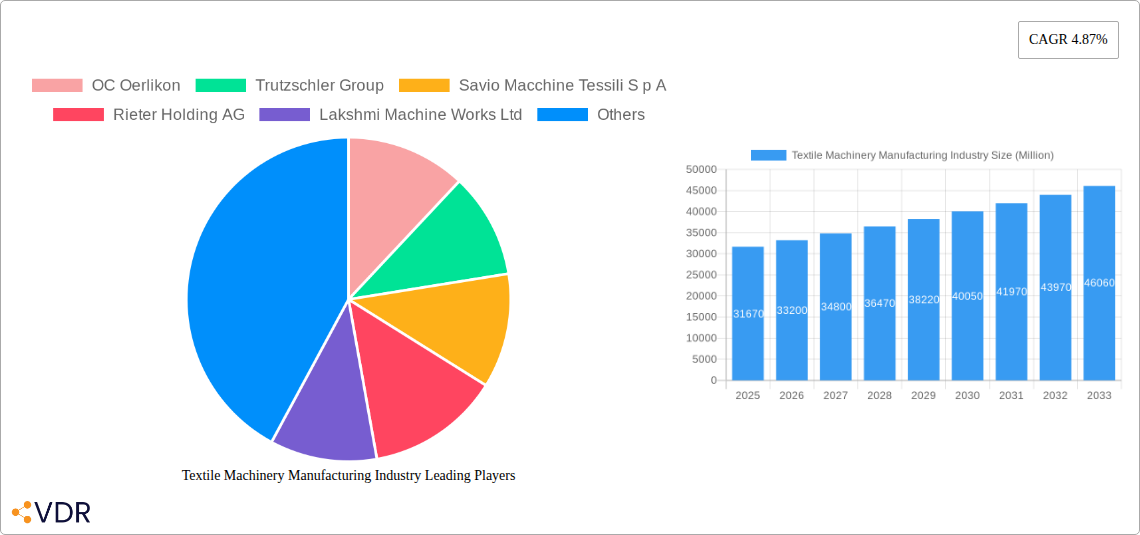
The global textile machinery manufacturing industry, valued at $31.67 billion in 2025, is projected to experience robust growth, driven by several key factors. Increasing demand for high-quality textiles from apparel, home furnishings, and industrial sectors fuels the need for advanced and efficient machinery. Automation and technological advancements, such as the integration of artificial intelligence and Industry 4.0 principles, are significantly enhancing productivity and reducing operational costs, driving further market expansion. The rising adoption of sustainable manufacturing practices, including eco-friendly materials and energy-efficient machinery, is also creating new opportunities for innovative players. Growth is further fueled by a shift towards customized and personalized textile products, necessitating flexible and adaptable machinery capable of handling shorter production runs. While challenges such as fluctuating raw material prices and global economic uncertainties exist, the long-term outlook for the textile machinery market remains positive.
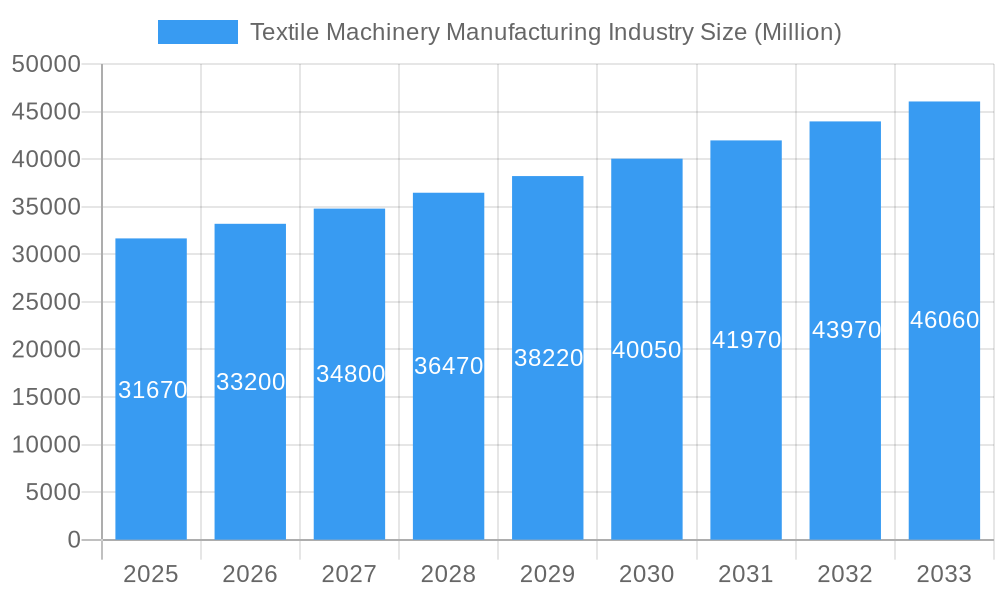
Textile Machinery Manufacturing Industry Market Size (In Billion)
Major players like OC Oerlikon, Trutzschler Group, and Rieter Holding AG are key contributors, leveraging their technological expertise and established global presence to secure market share. Competition remains intense, with companies focusing on product innovation, strategic partnerships, and mergers and acquisitions to expand their reach. Geographic expansion into emerging markets with burgeoning textile industries presents significant potential for growth. Regional variations in market dynamics are expected, with regions like Asia-Pacific and South Asia exhibiting strong growth due to robust domestic textile production and supportive government initiatives. Overall, the industry's trajectory suggests continued expansion, fueled by technological advancements, sustainable practices, and rising global textile demand.
Textile Machinery Manufacturing Industry Company Market Share
Textile Machinery Manufacturing Industry Market Report: 2019-2033
This comprehensive report provides a detailed analysis of the global Textile Machinery Manufacturing Industry, offering invaluable insights for industry professionals, investors, and strategic decision-makers. The report covers the period 2019-2033, with a focus on the forecast period 2025-2033 and a base year of 2025. The report leverages extensive market research to offer a granular view of market dynamics, growth trends, regional performance, and key players. The parent market is the broader machinery manufacturing industry, while the child market focuses specifically on textile machinery. Market values are presented in million units.
Textile Machinery Manufacturing Industry Market Dynamics & Structure
The textile machinery manufacturing industry is characterized by a moderately concentrated market structure, featuring a blend of a few dominant global players and a vibrant ecosystem of numerous smaller, highly specialized firms. This intricate structure is further detailed in the comprehensive report, offering a deeper analysis of market concentration and competitive positioning. A primary catalyst for growth is continuous technological innovation, with a pronounced emphasis on advancements in automation, digitalization, and the development of sustainable manufacturing processes. Concurrently, increasingly stringent environmental regulations worldwide, coupled with a growing consumer and industry demand for eco-friendly textile production methods, are significantly reshaping the industry's landscape and operational paradigms. The market also contends with competition from evolving substitute technologies, such as advanced 3D printing solutions that offer potential alternatives for specific textile applications. The industry's end-user demographics are remarkably diverse, spanning critical sectors like apparel, home textiles, automotive interiors, and a broad spectrum of industrial textile applications. Mergers and acquisitions (M&A) activity remains a dynamic aspect of the industry, with larger, established companies frequently acquiring smaller, specialized firms to strategically broaden their product portfolios, enhance their technological capabilities, and gain access to new markets. The full report provides an in-depth analysis of M&A deal volumes, precise market share percentages for key industry players, and a thorough examination of innovation barriers and complex competitive dynamics. Illustrative examples include:
- Market Concentration: Top 5 players accounted for approximately XX% of the market in 2024, with projections indicating a shift to approximately XX% by 2033, highlighting a trend towards further consolidation or strategic partnerships.
- M&A Activity: A total of XX significant M&A deals were recorded between 2019 and 2024, with an average reported deal value of XX million, underscoring strategic consolidation and acquisition-driven growth.
- Technological Innovation: The core focus of innovation is centered on advanced automation (including robotics and AI integration), comprehensive digitalization (leveraging IoT for connectivity and data analytics for insights), and cutting-edge sustainable technologies.
- Regulatory Landscape: The tightening of environmental regulations globally is a significant force, actively driving the demand for more energy-efficient and environmentally benign machinery solutions.
Textile Machinery Manufacturing Industry Growth Trends & Insights
The global textile machinery manufacturing market is experiencing robust growth, driven by several interconnected factors. The report projects a Compound Annual Growth Rate (CAGR) of xx% during the forecast period (2025-2033). This growth is fueled by increasing global textile production, rising demand for high-quality textiles, and the adoption of advanced technologies. The market size is estimated to reach xx million units by 2025 and xx million units by 2033. The adoption rate of advanced textile machinery is increasing steadily, particularly in developing economies. Technological disruptions, such as the introduction of smart factories and Industry 4.0 technologies, are transforming manufacturing processes and enhancing productivity. Consumer behavior shifts towards sustainable and ethically sourced products are also influencing the demand for eco-friendly textile machinery. The report provides a thorough analysis of these factors and their impact on market growth, including a detailed analysis of market penetration rates and technological advancements.
Dominant Regions, Countries, or Segments in Textile Machinery Manufacturing Industry
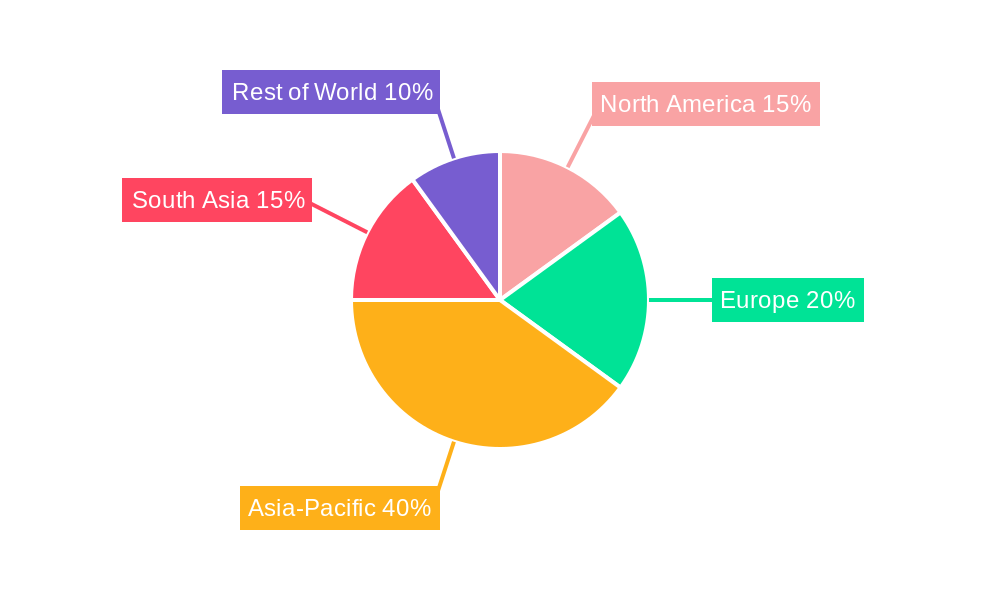
Asia-Pacific is currently the leading region in the textile machinery manufacturing market, driven by robust growth in countries like China, India, and Bangladesh. These countries benefit from favorable economic policies, substantial investments in textile infrastructure, and a large pool of skilled labor. Europe and North America also hold significant market share, although their growth rates are comparatively slower. The growth in the apparel and home textile sectors, coupled with rising investments in automation and innovative production techniques, are primary drivers of regional market dominance. The full report includes detailed analyses of regional market dynamics, growth projections, and market share for major countries:
- Asia-Pacific: Dominant market share driven by strong growth in China and India. Key drivers include government incentives and the substantial textile industry.
- Europe: Significant market presence, with a focus on high-end and specialized machinery. Innovation and sustainability are key drivers.
- North America: Relatively smaller market but high focus on technologically advanced machines for high-value applications.
Textile Machinery Manufacturing Industry Product Landscape
The textile machinery industry boasts an exceptionally diverse and sophisticated product portfolio, meticulously designed to address every critical stage of textile production. This spectrum ranges from the initial fiber preparation and intricate spinning processes to advanced weaving, high-speed knitting, and precision finishing operations. Recent product innovations are revolutionizing the sector, with the introduction of automated guided vehicles (AGVs) for streamlined material handling, sophisticated sensor systems enabling real-time process monitoring and quality control, and highly precise, digitally controlled machines that facilitate intricate and exact fabric creation. These advancements collectively contribute to substantial gains in productivity, significant improvements in end-product quality, and a notable reduction in material waste. The overarching industry imperative remains focused on enhancing operational efficiency, elevating product quality standards, and seamlessly integrating sustainable manufacturing practices across all production lines.
Key Drivers, Barriers & Challenges in Textile Machinery Manufacturing Industry
Key Drivers:
- Rising Global Textile Production: Increased demand for clothing and home textiles globally fuels the need for advanced machinery.
- Technological Advancements: Automation, digitalization, and sustainability initiatives are boosting productivity and efficiency.
- Government Support: Incentives and policies supporting the textile industry drive investment in new machinery.
Key Challenges:
- Supply Chain Disruptions: Global events (e.g., pandemics, geopolitical instability) impact the availability of raw materials and components. Estimated impact on market growth: xx% in 2022.
- High Initial Investment Costs: The cost of advanced machinery can be a barrier for smaller companies.
- Intense Competition: The market is competitive, with established players and new entrants vying for market share.
Emerging Opportunities in Textile Machinery Manufacturing Industry
- Growth in Sustainable Textiles: The escalating demand for textiles produced through eco-friendly methods presents a substantial opportunity for machinery manufacturers specializing in solutions that drastically reduce water and energy consumption, minimize chemical usage, and promote circular economy principles.
- Expansion into Emerging Markets: Developing economies, with their burgeoning textile sectors and increasing investments in manufacturing infrastructure, represent significant untapped potential and lucrative growth avenues for textile machinery manufacturers seeking to broaden their global reach.
- Smart Factory Integration: The pervasive adoption of Industry 4.0 technologies and principles opens up unparalleled opportunities to optimize textile production processes through the implementation of data-driven insights, predictive maintenance, and intelligent automation, leading to enhanced efficiency and flexibility.
Growth Accelerators in the Textile Machinery Manufacturing Industry
The long-term trajectory of growth for the textile machinery manufacturing industry will be propelled by a confluence of factors, including sustained investment in cutting-edge technological innovations, the formation of strategic partnerships and collaborative ventures, and aggressive expansion into new and emerging geographic markets. The continuous development and widespread adoption of sustainable and energy-efficient machinery will undeniably play a pivotal role in shaping the future landscape and competitive dynamics of the industry. Consequently, companies that demonstrate agility in adapting to rapid technological change, proactively address the growing imperative for sustainability, and foster strong collaborative relationships will be exceptionally well-positioned to achieve sustained growth and market leadership.
Key Players Shaping the Textile Machinery Manufacturing Industry Market
- OC Oerlikon
- Trutzschler Group
- Savio Macchine Tessili S p A
- Rieter Holding AG
- Lakshmi Machine Works Ltd
- Murata Machinery Ltd
- Santoni S p A
- Saurer Intelligent Technlogy AG
- TMT Machinery Inc
- Mayer & Cie GmbH & Co KG
- 63 Other Companies (Overview/Key Information available in the full report)
Notable Milestones in Textile Machinery Manufacturing Industry Sector
- June 2022: Trützschler Nonwovens & Man-Made Fibers, in collaboration with Texnology, launched the T-SUPREMA full needle-punching lines, representing a significant advancement in the efficiency and capability of dry-laid nonwoven production.
- January 2022: Morgan Tecnica unveiled PLY1, an innovative high-precision single-ply cutting system engineered to handle a diverse range of textile materials with exceptional accuracy and speed, optimizing cutting room operations.
- April 2021: While indirectly related, Ingersoll Machine Tools significantly expanded its facility by installing a state-of-the-art large milling center. This investment, serving demanding sectors like telescope and defense industries, highlights the growing capabilities in precision machining that are often transferable and beneficial to the broader, high-precision demands of textile machinery manufacturing.
In-Depth Textile Machinery Manufacturing Industry Market Outlook
The textile machinery manufacturing industry is poised for continued growth, driven by technological advancements, increasing global textile production, and a rising focus on sustainability. Strategic partnerships, investments in R&D, and expansion into new markets will be critical factors determining future success. Companies that can adapt to evolving consumer preferences and embrace sustainable practices will be well-positioned to capture significant market share. The potential for growth remains substantial, particularly in emerging economies and within the sustainable textile segment.
Textile Machinery Manufacturing Industry Segmentation
-
1. Raw Material
- 1.1. Cotton
- 1.2. Wool
- 1.3. Nylon
- 1.4. Polyester
- 1.5. Acrylic
- 1.6. Silk
- 1.7. Other Raw Materials
-
2. Machine Type
- 2.1. Spinning Machines
- 2.2. Weaving Machines
- 2.3. Knitting Machines
- 2.4. Texturing Machines
- 2.5. Other Machine Types
-
3. Distribution Channel
- 3.1. Direct
- 3.2. Indirect
-
4. Application
- 4.1. Garments & Apparels
- 4.2. Household and Home Textiles
- 4.3. Technica
Textile Machinery Manufacturing Industry Segmentation By Geography
-
1. North America
- 1.1. United States
- 1.2. Canada
- 1.3. Mexico
-
2. Europe
- 2.1. Germany
- 2.2. France
- 2.3. United Kingdom
- 2.4. Italy
- 2.5. Spain
- 2.6. Russia
- 2.7. Rest of Europe
-
3. Asia Pacific
- 3.1. China
- 3.2. Japan
- 3.3. India
- 3.4. Bangladesh
- 3.5. Turkey
- 3.6. South Korea
- 3.7. Australia
- 3.8. Indonesia
- 3.9. Rest of Asia Pacific
- 4. Middle East
-
5. Egypt
- 5.1. South Africa
- 5.2. Saudi Arabia
- 5.3. Rest of Middle East
-
6. South America
- 6.1. Brazil
- 6.2. Argentina
- 6.3. Rest of South America
Textile Machinery Manufacturing Industry Regional Market Share
Geographic Coverage of Textile Machinery Manufacturing Industry
Textile Machinery Manufacturing Industry REPORT HIGHLIGHTS
| Aspects | Details |
|---|---|
| Study Period | 2020-2034 |
| Base Year | 2025 |
| Estimated Year | 2026 |
| Forecast Period | 2026-2034 |
| Historical Period | 2020-2025 |
| Growth Rate | CAGR of 4.87% from 2020-2034 |
| Segmentation |
|
Table of Contents
- 1. Introduction
- 1.1. Research Scope
- 1.2. Market Segmentation
- 1.3. Research Objective
- 1.4. Definitions and Assumptions
- 2. Executive Summary
- 2.1. Market Snapshot
- 3. Market Dynamics
- 3.1. Market Drivers
- 3.2. Market Restrains
- 3.3. Market Trends
- 3.4. Market Opportunities
- 4. Market Factor Analysis
- 4.1. Porters Five Forces
- 4.1.1. Bargaining Power of Suppliers
- 4.1.2. Bargaining Power of Buyers
- 4.1.3. Threat of New Entrants
- 4.1.4. Threat of Substitutes
- 4.1.5. Competitive Rivalry
- 4.2. PESTEL analysis
- 4.3. BCG Analysis
- 4.3.1. Stars (High Growth, High Market Share)
- 4.3.2. Cash Cows (Low Growth, High Market Share)
- 4.3.3. Question Mark (High Growth, Low Market Share)
- 4.3.4. Dogs (Low Growth, Low Market Share)
- 4.4. Ansoff Matrix Analysis
- 4.5. Supply Chain Analysis
- 4.6. Regulatory Landscape
- 4.7. Current Market Potential and Opportunity Assessment (TAM–SAM–SOM Framework)
- 4.8. VDR Analyst Note
- 4.1. Porters Five Forces
- 5. Market Analysis, Insights and Forecast 2021-2033
- 5.1. Market Analysis, Insights and Forecast - by Raw Material
- 5.1.1. Cotton
- 5.1.2. Wool
- 5.1.3. Nylon
- 5.1.4. Polyester
- 5.1.5. Acrylic
- 5.1.6. Silk
- 5.1.7. Other Raw Materials
- 5.2. Market Analysis, Insights and Forecast - by Machine Type
- 5.2.1. Spinning Machines
- 5.2.2. Weaving Machines
- 5.2.3. Knitting Machines
- 5.2.4. Texturing Machines
- 5.2.5. Other Machine Types
- 5.3. Market Analysis, Insights and Forecast - by Distribution Channel
- 5.3.1. Direct
- 5.3.2. Indirect
- 5.4. Market Analysis, Insights and Forecast - by Application
- 5.4.1. Garments & Apparels
- 5.4.2. Household and Home Textiles
- 5.4.3. Technica
- 5.5. Market Analysis, Insights and Forecast - by Region
- 5.5.1. North America
- 5.5.2. Europe
- 5.5.3. Asia Pacific
- 5.5.4. Middle East
- 5.5.5. Egypt
- 5.5.6. South America
- 5.1. Market Analysis, Insights and Forecast - by Raw Material
- 6. Global Textile Machinery Manufacturing Industry Analysis, Insights and Forecast, 2021-2033
- 6.1. Market Analysis, Insights and Forecast - by Raw Material
- 6.1.1. Cotton
- 6.1.2. Wool
- 6.1.3. Nylon
- 6.1.4. Polyester
- 6.1.5. Acrylic
- 6.1.6. Silk
- 6.1.7. Other Raw Materials
- 6.2. Market Analysis, Insights and Forecast - by Machine Type
- 6.2.1. Spinning Machines
- 6.2.2. Weaving Machines
- 6.2.3. Knitting Machines
- 6.2.4. Texturing Machines
- 6.2.5. Other Machine Types
- 6.3. Market Analysis, Insights and Forecast - by Distribution Channel
- 6.3.1. Direct
- 6.3.2. Indirect
- 6.4. Market Analysis, Insights and Forecast - by Application
- 6.4.1. Garments & Apparels
- 6.4.2. Household and Home Textiles
- 6.4.3. Technica
- 6.1. Market Analysis, Insights and Forecast - by Raw Material
- 7. North America Textile Machinery Manufacturing Industry Analysis, Insights and Forecast, 2021-2033
- 7.1. Market Analysis, Insights and Forecast - by Raw Material
- 7.1.1. Cotton
- 7.1.2. Wool
- 7.1.3. Nylon
- 7.1.4. Polyester
- 7.1.5. Acrylic
- 7.1.6. Silk
- 7.1.7. Other Raw Materials
- 7.2. Market Analysis, Insights and Forecast - by Machine Type
- 7.2.1. Spinning Machines
- 7.2.2. Weaving Machines
- 7.2.3. Knitting Machines
- 7.2.4. Texturing Machines
- 7.2.5. Other Machine Types
- 7.3. Market Analysis, Insights and Forecast - by Distribution Channel
- 7.3.1. Direct
- 7.3.2. Indirect
- 7.4. Market Analysis, Insights and Forecast - by Application
- 7.4.1. Garments & Apparels
- 7.4.2. Household and Home Textiles
- 7.4.3. Technica
- 7.1. Market Analysis, Insights and Forecast - by Raw Material
- 8. Europe Textile Machinery Manufacturing Industry Analysis, Insights and Forecast, 2021-2033
- 8.1. Market Analysis, Insights and Forecast - by Raw Material
- 8.1.1. Cotton
- 8.1.2. Wool
- 8.1.3. Nylon
- 8.1.4. Polyester
- 8.1.5. Acrylic
- 8.1.6. Silk
- 8.1.7. Other Raw Materials
- 8.2. Market Analysis, Insights and Forecast - by Machine Type
- 8.2.1. Spinning Machines
- 8.2.2. Weaving Machines
- 8.2.3. Knitting Machines
- 8.2.4. Texturing Machines
- 8.2.5. Other Machine Types
- 8.3. Market Analysis, Insights and Forecast - by Distribution Channel
- 8.3.1. Direct
- 8.3.2. Indirect
- 8.4. Market Analysis, Insights and Forecast - by Application
- 8.4.1. Garments & Apparels
- 8.4.2. Household and Home Textiles
- 8.4.3. Technica
- 8.1. Market Analysis, Insights and Forecast - by Raw Material
- 9. Asia Pacific Textile Machinery Manufacturing Industry Analysis, Insights and Forecast, 2021-2033
- 9.1. Market Analysis, Insights and Forecast - by Raw Material
- 9.1.1. Cotton
- 9.1.2. Wool
- 9.1.3. Nylon
- 9.1.4. Polyester
- 9.1.5. Acrylic
- 9.1.6. Silk
- 9.1.7. Other Raw Materials
- 9.2. Market Analysis, Insights and Forecast - by Machine Type
- 9.2.1. Spinning Machines
- 9.2.2. Weaving Machines
- 9.2.3. Knitting Machines
- 9.2.4. Texturing Machines
- 9.2.5. Other Machine Types
- 9.3. Market Analysis, Insights and Forecast - by Distribution Channel
- 9.3.1. Direct
- 9.3.2. Indirect
- 9.4. Market Analysis, Insights and Forecast - by Application
- 9.4.1. Garments & Apparels
- 9.4.2. Household and Home Textiles
- 9.4.3. Technica
- 9.1. Market Analysis, Insights and Forecast - by Raw Material
- 10. Middle East Textile Machinery Manufacturing Industry Analysis, Insights and Forecast, 2021-2033
- 10.1. Market Analysis, Insights and Forecast - by Raw Material
- 10.1.1. Cotton
- 10.1.2. Wool
- 10.1.3. Nylon
- 10.1.4. Polyester
- 10.1.5. Acrylic
- 10.1.6. Silk
- 10.1.7. Other Raw Materials
- 10.2. Market Analysis, Insights and Forecast - by Machine Type
- 10.2.1. Spinning Machines
- 10.2.2. Weaving Machines
- 10.2.3. Knitting Machines
- 10.2.4. Texturing Machines
- 10.2.5. Other Machine Types
- 10.3. Market Analysis, Insights and Forecast - by Distribution Channel
- 10.3.1. Direct
- 10.3.2. Indirect
- 10.4. Market Analysis, Insights and Forecast - by Application
- 10.4.1. Garments & Apparels
- 10.4.2. Household and Home Textiles
- 10.4.3. Technica
- 10.1. Market Analysis, Insights and Forecast - by Raw Material
- 11. Egypt Textile Machinery Manufacturing Industry Analysis, Insights and Forecast, 2021-2033
- 11.1. Market Analysis, Insights and Forecast - by Raw Material
- 11.1.1. Cotton
- 11.1.2. Wool
- 11.1.3. Nylon
- 11.1.4. Polyester
- 11.1.5. Acrylic
- 11.1.6. Silk
- 11.1.7. Other Raw Materials
- 11.2. Market Analysis, Insights and Forecast - by Machine Type
- 11.2.1. Spinning Machines
- 11.2.2. Weaving Machines
- 11.2.3. Knitting Machines
- 11.2.4. Texturing Machines
- 11.2.5. Other Machine Types
- 11.3. Market Analysis, Insights and Forecast - by Distribution Channel
- 11.3.1. Direct
- 11.3.2. Indirect
- 11.4. Market Analysis, Insights and Forecast - by Application
- 11.4.1. Garments & Apparels
- 11.4.2. Household and Home Textiles
- 11.4.3. Technica
- 11.1. Market Analysis, Insights and Forecast - by Raw Material
- 12. South America Textile Machinery Manufacturing Industry Analysis, Insights and Forecast, 2021-2033
- 12.1. Market Analysis, Insights and Forecast - by Raw Material
- 12.1.1. Cotton
- 12.1.2. Wool
- 12.1.3. Nylon
- 12.1.4. Polyester
- 12.1.5. Acrylic
- 12.1.6. Silk
- 12.1.7. Other Raw Materials
- 12.2. Market Analysis, Insights and Forecast - by Machine Type
- 12.2.1. Spinning Machines
- 12.2.2. Weaving Machines
- 12.2.3. Knitting Machines
- 12.2.4. Texturing Machines
- 12.2.5. Other Machine Types
- 12.3. Market Analysis, Insights and Forecast - by Distribution Channel
- 12.3.1. Direct
- 12.3.2. Indirect
- 12.4. Market Analysis, Insights and Forecast - by Application
- 12.4.1. Garments & Apparels
- 12.4.2. Household and Home Textiles
- 12.4.3. Technica
- 12.1. Market Analysis, Insights and Forecast - by Raw Material
- 13. Competitive Analysis
- 13.1. Company Profiles
- 13.1.1 OC Oerlikon
- 13.1.1.1. Company Overview
- 13.1.1.2. Products
- 13.1.1.3. Company Financials
- 13.1.1.4. SWOT Analysis
- 13.1.2 Trutzschler Group
- 13.1.2.1. Company Overview
- 13.1.2.2. Products
- 13.1.2.3. Company Financials
- 13.1.2.4. SWOT Analysis
- 13.1.3 Savio Macchine Tessili S p A
- 13.1.3.1. Company Overview
- 13.1.3.2. Products
- 13.1.3.3. Company Financials
- 13.1.3.4. SWOT Analysis
- 13.1.4 Rieter Holding AG
- 13.1.4.1. Company Overview
- 13.1.4.2. Products
- 13.1.4.3. Company Financials
- 13.1.4.4. SWOT Analysis
- 13.1.5 Lakshmi Machine Works Ltd
- 13.1.5.1. Company Overview
- 13.1.5.2. Products
- 13.1.5.3. Company Financials
- 13.1.5.4. SWOT Analysis
- 13.1.6 Murata Machinery Ltd
- 13.1.6.1. Company Overview
- 13.1.6.2. Products
- 13.1.6.3. Company Financials
- 13.1.6.4. SWOT Analysis
- 13.1.7 Santoni S p A
- 13.1.7.1. Company Overview
- 13.1.7.2. Products
- 13.1.7.3. Company Financials
- 13.1.7.4. SWOT Analysis
- 13.1.8 Saurer Intelligent Technlogy AG
- 13.1.8.1. Company Overview
- 13.1.8.2. Products
- 13.1.8.3. Company Financials
- 13.1.8.4. SWOT Analysis
- 13.1.9 TMT Machinery Inc
- 13.1.9.1. Company Overview
- 13.1.9.2. Products
- 13.1.9.3. Company Financials
- 13.1.9.4. SWOT Analysis
- 13.1.10 Mayer & Cie GmbH & Co KG**List Not Exhaustive 6 3 Other Companies (Overview/Key Information
- 13.1.10.1. Company Overview
- 13.1.10.2. Products
- 13.1.10.3. Company Financials
- 13.1.10.4. SWOT Analysis
- 13.1.1 OC Oerlikon
- 13.2. Market Entropy
- 13.2.1 Company's Key Areas Served
- 13.2.2 Recent Developments
- 13.3. Company Market Share Analysis 2025
- 13.3.1 Top 5 Companies Market Share Analysis
- 13.3.2 Top 3 Companies Market Share Analysis
- 13.4. List of Potential Customers
- 14. Research Methodology
List of Figures
- Figure 1: Global Textile Machinery Manufacturing Industry Revenue Breakdown (Million, %) by Region 2025 & 2033
- Figure 2: Global Textile Machinery Manufacturing Industry Volume Breakdown (Billion, %) by Region 2025 & 2033
- Figure 3: North America Textile Machinery Manufacturing Industry Revenue (Million), by Raw Material 2025 & 2033
- Figure 4: North America Textile Machinery Manufacturing Industry Volume (Billion), by Raw Material 2025 & 2033
- Figure 5: North America Textile Machinery Manufacturing Industry Revenue Share (%), by Raw Material 2025 & 2033
- Figure 6: North America Textile Machinery Manufacturing Industry Volume Share (%), by Raw Material 2025 & 2033
- Figure 7: North America Textile Machinery Manufacturing Industry Revenue (Million), by Machine Type 2025 & 2033
- Figure 8: North America Textile Machinery Manufacturing Industry Volume (Billion), by Machine Type 2025 & 2033
- Figure 9: North America Textile Machinery Manufacturing Industry Revenue Share (%), by Machine Type 2025 & 2033
- Figure 10: North America Textile Machinery Manufacturing Industry Volume Share (%), by Machine Type 2025 & 2033
- Figure 11: North America Textile Machinery Manufacturing Industry Revenue (Million), by Distribution Channel 2025 & 2033
- Figure 12: North America Textile Machinery Manufacturing Industry Volume (Billion), by Distribution Channel 2025 & 2033
- Figure 13: North America Textile Machinery Manufacturing Industry Revenue Share (%), by Distribution Channel 2025 & 2033
- Figure 14: North America Textile Machinery Manufacturing Industry Volume Share (%), by Distribution Channel 2025 & 2033
- Figure 15: North America Textile Machinery Manufacturing Industry Revenue (Million), by Application 2025 & 2033
- Figure 16: North America Textile Machinery Manufacturing Industry Volume (Billion), by Application 2025 & 2033
- Figure 17: North America Textile Machinery Manufacturing Industry Revenue Share (%), by Application 2025 & 2033
- Figure 18: North America Textile Machinery Manufacturing Industry Volume Share (%), by Application 2025 & 2033
- Figure 19: North America Textile Machinery Manufacturing Industry Revenue (Million), by Country 2025 & 2033
- Figure 20: North America Textile Machinery Manufacturing Industry Volume (Billion), by Country 2025 & 2033
- Figure 21: North America Textile Machinery Manufacturing Industry Revenue Share (%), by Country 2025 & 2033
- Figure 22: North America Textile Machinery Manufacturing Industry Volume Share (%), by Country 2025 & 2033
- Figure 23: Europe Textile Machinery Manufacturing Industry Revenue (Million), by Raw Material 2025 & 2033
- Figure 24: Europe Textile Machinery Manufacturing Industry Volume (Billion), by Raw Material 2025 & 2033
- Figure 25: Europe Textile Machinery Manufacturing Industry Revenue Share (%), by Raw Material 2025 & 2033
- Figure 26: Europe Textile Machinery Manufacturing Industry Volume Share (%), by Raw Material 2025 & 2033
- Figure 27: Europe Textile Machinery Manufacturing Industry Revenue (Million), by Machine Type 2025 & 2033
- Figure 28: Europe Textile Machinery Manufacturing Industry Volume (Billion), by Machine Type 2025 & 2033
- Figure 29: Europe Textile Machinery Manufacturing Industry Revenue Share (%), by Machine Type 2025 & 2033
- Figure 30: Europe Textile Machinery Manufacturing Industry Volume Share (%), by Machine Type 2025 & 2033
- Figure 31: Europe Textile Machinery Manufacturing Industry Revenue (Million), by Distribution Channel 2025 & 2033
- Figure 32: Europe Textile Machinery Manufacturing Industry Volume (Billion), by Distribution Channel 2025 & 2033
- Figure 33: Europe Textile Machinery Manufacturing Industry Revenue Share (%), by Distribution Channel 2025 & 2033
- Figure 34: Europe Textile Machinery Manufacturing Industry Volume Share (%), by Distribution Channel 2025 & 2033
- Figure 35: Europe Textile Machinery Manufacturing Industry Revenue (Million), by Application 2025 & 2033
- Figure 36: Europe Textile Machinery Manufacturing Industry Volume (Billion), by Application 2025 & 2033
- Figure 37: Europe Textile Machinery Manufacturing Industry Revenue Share (%), by Application 2025 & 2033
- Figure 38: Europe Textile Machinery Manufacturing Industry Volume Share (%), by Application 2025 & 2033
- Figure 39: Europe Textile Machinery Manufacturing Industry Revenue (Million), by Country 2025 & 2033
- Figure 40: Europe Textile Machinery Manufacturing Industry Volume (Billion), by Country 2025 & 2033
- Figure 41: Europe Textile Machinery Manufacturing Industry Revenue Share (%), by Country 2025 & 2033
- Figure 42: Europe Textile Machinery Manufacturing Industry Volume Share (%), by Country 2025 & 2033
- Figure 43: Asia Pacific Textile Machinery Manufacturing Industry Revenue (Million), by Raw Material 2025 & 2033
- Figure 44: Asia Pacific Textile Machinery Manufacturing Industry Volume (Billion), by Raw Material 2025 & 2033
- Figure 45: Asia Pacific Textile Machinery Manufacturing Industry Revenue Share (%), by Raw Material 2025 & 2033
- Figure 46: Asia Pacific Textile Machinery Manufacturing Industry Volume Share (%), by Raw Material 2025 & 2033
- Figure 47: Asia Pacific Textile Machinery Manufacturing Industry Revenue (Million), by Machine Type 2025 & 2033
- Figure 48: Asia Pacific Textile Machinery Manufacturing Industry Volume (Billion), by Machine Type 2025 & 2033
- Figure 49: Asia Pacific Textile Machinery Manufacturing Industry Revenue Share (%), by Machine Type 2025 & 2033
- Figure 50: Asia Pacific Textile Machinery Manufacturing Industry Volume Share (%), by Machine Type 2025 & 2033
- Figure 51: Asia Pacific Textile Machinery Manufacturing Industry Revenue (Million), by Distribution Channel 2025 & 2033
- Figure 52: Asia Pacific Textile Machinery Manufacturing Industry Volume (Billion), by Distribution Channel 2025 & 2033
- Figure 53: Asia Pacific Textile Machinery Manufacturing Industry Revenue Share (%), by Distribution Channel 2025 & 2033
- Figure 54: Asia Pacific Textile Machinery Manufacturing Industry Volume Share (%), by Distribution Channel 2025 & 2033
- Figure 55: Asia Pacific Textile Machinery Manufacturing Industry Revenue (Million), by Application 2025 & 2033
- Figure 56: Asia Pacific Textile Machinery Manufacturing Industry Volume (Billion), by Application 2025 & 2033
- Figure 57: Asia Pacific Textile Machinery Manufacturing Industry Revenue Share (%), by Application 2025 & 2033
- Figure 58: Asia Pacific Textile Machinery Manufacturing Industry Volume Share (%), by Application 2025 & 2033
- Figure 59: Asia Pacific Textile Machinery Manufacturing Industry Revenue (Million), by Country 2025 & 2033
- Figure 60: Asia Pacific Textile Machinery Manufacturing Industry Volume (Billion), by Country 2025 & 2033
- Figure 61: Asia Pacific Textile Machinery Manufacturing Industry Revenue Share (%), by Country 2025 & 2033
- Figure 62: Asia Pacific Textile Machinery Manufacturing Industry Volume Share (%), by Country 2025 & 2033
- Figure 63: Middle East Textile Machinery Manufacturing Industry Revenue (Million), by Raw Material 2025 & 2033
- Figure 64: Middle East Textile Machinery Manufacturing Industry Volume (Billion), by Raw Material 2025 & 2033
- Figure 65: Middle East Textile Machinery Manufacturing Industry Revenue Share (%), by Raw Material 2025 & 2033
- Figure 66: Middle East Textile Machinery Manufacturing Industry Volume Share (%), by Raw Material 2025 & 2033
- Figure 67: Middle East Textile Machinery Manufacturing Industry Revenue (Million), by Machine Type 2025 & 2033
- Figure 68: Middle East Textile Machinery Manufacturing Industry Volume (Billion), by Machine Type 2025 & 2033
- Figure 69: Middle East Textile Machinery Manufacturing Industry Revenue Share (%), by Machine Type 2025 & 2033
- Figure 70: Middle East Textile Machinery Manufacturing Industry Volume Share (%), by Machine Type 2025 & 2033
- Figure 71: Middle East Textile Machinery Manufacturing Industry Revenue (Million), by Distribution Channel 2025 & 2033
- Figure 72: Middle East Textile Machinery Manufacturing Industry Volume (Billion), by Distribution Channel 2025 & 2033
- Figure 73: Middle East Textile Machinery Manufacturing Industry Revenue Share (%), by Distribution Channel 2025 & 2033
- Figure 74: Middle East Textile Machinery Manufacturing Industry Volume Share (%), by Distribution Channel 2025 & 2033
- Figure 75: Middle East Textile Machinery Manufacturing Industry Revenue (Million), by Application 2025 & 2033
- Figure 76: Middle East Textile Machinery Manufacturing Industry Volume (Billion), by Application 2025 & 2033
- Figure 77: Middle East Textile Machinery Manufacturing Industry Revenue Share (%), by Application 2025 & 2033
- Figure 78: Middle East Textile Machinery Manufacturing Industry Volume Share (%), by Application 2025 & 2033
- Figure 79: Middle East Textile Machinery Manufacturing Industry Revenue (Million), by Country 2025 & 2033
- Figure 80: Middle East Textile Machinery Manufacturing Industry Volume (Billion), by Country 2025 & 2033
- Figure 81: Middle East Textile Machinery Manufacturing Industry Revenue Share (%), by Country 2025 & 2033
- Figure 82: Middle East Textile Machinery Manufacturing Industry Volume Share (%), by Country 2025 & 2033
- Figure 83: Egypt Textile Machinery Manufacturing Industry Revenue (Million), by Raw Material 2025 & 2033
- Figure 84: Egypt Textile Machinery Manufacturing Industry Volume (Billion), by Raw Material 2025 & 2033
- Figure 85: Egypt Textile Machinery Manufacturing Industry Revenue Share (%), by Raw Material 2025 & 2033
- Figure 86: Egypt Textile Machinery Manufacturing Industry Volume Share (%), by Raw Material 2025 & 2033
- Figure 87: Egypt Textile Machinery Manufacturing Industry Revenue (Million), by Machine Type 2025 & 2033
- Figure 88: Egypt Textile Machinery Manufacturing Industry Volume (Billion), by Machine Type 2025 & 2033
- Figure 89: Egypt Textile Machinery Manufacturing Industry Revenue Share (%), by Machine Type 2025 & 2033
- Figure 90: Egypt Textile Machinery Manufacturing Industry Volume Share (%), by Machine Type 2025 & 2033
- Figure 91: Egypt Textile Machinery Manufacturing Industry Revenue (Million), by Distribution Channel 2025 & 2033
- Figure 92: Egypt Textile Machinery Manufacturing Industry Volume (Billion), by Distribution Channel 2025 & 2033
- Figure 93: Egypt Textile Machinery Manufacturing Industry Revenue Share (%), by Distribution Channel 2025 & 2033
- Figure 94: Egypt Textile Machinery Manufacturing Industry Volume Share (%), by Distribution Channel 2025 & 2033
- Figure 95: Egypt Textile Machinery Manufacturing Industry Revenue (Million), by Application 2025 & 2033
- Figure 96: Egypt Textile Machinery Manufacturing Industry Volume (Billion), by Application 2025 & 2033
- Figure 97: Egypt Textile Machinery Manufacturing Industry Revenue Share (%), by Application 2025 & 2033
- Figure 98: Egypt Textile Machinery Manufacturing Industry Volume Share (%), by Application 2025 & 2033
- Figure 99: Egypt Textile Machinery Manufacturing Industry Revenue (Million), by Country 2025 & 2033
- Figure 100: Egypt Textile Machinery Manufacturing Industry Volume (Billion), by Country 2025 & 2033
- Figure 101: Egypt Textile Machinery Manufacturing Industry Revenue Share (%), by Country 2025 & 2033
- Figure 102: Egypt Textile Machinery Manufacturing Industry Volume Share (%), by Country 2025 & 2033
- Figure 103: South America Textile Machinery Manufacturing Industry Revenue (Million), by Raw Material 2025 & 2033
- Figure 104: South America Textile Machinery Manufacturing Industry Volume (Billion), by Raw Material 2025 & 2033
- Figure 105: South America Textile Machinery Manufacturing Industry Revenue Share (%), by Raw Material 2025 & 2033
- Figure 106: South America Textile Machinery Manufacturing Industry Volume Share (%), by Raw Material 2025 & 2033
- Figure 107: South America Textile Machinery Manufacturing Industry Revenue (Million), by Machine Type 2025 & 2033
- Figure 108: South America Textile Machinery Manufacturing Industry Volume (Billion), by Machine Type 2025 & 2033
- Figure 109: South America Textile Machinery Manufacturing Industry Revenue Share (%), by Machine Type 2025 & 2033
- Figure 110: South America Textile Machinery Manufacturing Industry Volume Share (%), by Machine Type 2025 & 2033
- Figure 111: South America Textile Machinery Manufacturing Industry Revenue (Million), by Distribution Channel 2025 & 2033
- Figure 112: South America Textile Machinery Manufacturing Industry Volume (Billion), by Distribution Channel 2025 & 2033
- Figure 113: South America Textile Machinery Manufacturing Industry Revenue Share (%), by Distribution Channel 2025 & 2033
- Figure 114: South America Textile Machinery Manufacturing Industry Volume Share (%), by Distribution Channel 2025 & 2033
- Figure 115: South America Textile Machinery Manufacturing Industry Revenue (Million), by Application 2025 & 2033
- Figure 116: South America Textile Machinery Manufacturing Industry Volume (Billion), by Application 2025 & 2033
- Figure 117: South America Textile Machinery Manufacturing Industry Revenue Share (%), by Application 2025 & 2033
- Figure 118: South America Textile Machinery Manufacturing Industry Volume Share (%), by Application 2025 & 2033
- Figure 119: South America Textile Machinery Manufacturing Industry Revenue (Million), by Country 2025 & 2033
- Figure 120: South America Textile Machinery Manufacturing Industry Volume (Billion), by Country 2025 & 2033
- Figure 121: South America Textile Machinery Manufacturing Industry Revenue Share (%), by Country 2025 & 2033
- Figure 122: South America Textile Machinery Manufacturing Industry Volume Share (%), by Country 2025 & 2033
List of Tables
- Table 1: Global Textile Machinery Manufacturing Industry Revenue Million Forecast, by Raw Material 2020 & 2033
- Table 2: Global Textile Machinery Manufacturing Industry Volume Billion Forecast, by Raw Material 2020 & 2033
- Table 3: Global Textile Machinery Manufacturing Industry Revenue Million Forecast, by Machine Type 2020 & 2033
- Table 4: Global Textile Machinery Manufacturing Industry Volume Billion Forecast, by Machine Type 2020 & 2033
- Table 5: Global Textile Machinery Manufacturing Industry Revenue Million Forecast, by Distribution Channel 2020 & 2033
- Table 6: Global Textile Machinery Manufacturing Industry Volume Billion Forecast, by Distribution Channel 2020 & 2033
- Table 7: Global Textile Machinery Manufacturing Industry Revenue Million Forecast, by Application 2020 & 2033
- Table 8: Global Textile Machinery Manufacturing Industry Volume Billion Forecast, by Application 2020 & 2033
- Table 9: Global Textile Machinery Manufacturing Industry Revenue Million Forecast, by Region 2020 & 2033
- Table 10: Global Textile Machinery Manufacturing Industry Volume Billion Forecast, by Region 2020 & 2033
- Table 11: Global Textile Machinery Manufacturing Industry Revenue Million Forecast, by Raw Material 2020 & 2033
- Table 12: Global Textile Machinery Manufacturing Industry Volume Billion Forecast, by Raw Material 2020 & 2033
- Table 13: Global Textile Machinery Manufacturing Industry Revenue Million Forecast, by Machine Type 2020 & 2033
- Table 14: Global Textile Machinery Manufacturing Industry Volume Billion Forecast, by Machine Type 2020 & 2033
- Table 15: Global Textile Machinery Manufacturing Industry Revenue Million Forecast, by Distribution Channel 2020 & 2033
- Table 16: Global Textile Machinery Manufacturing Industry Volume Billion Forecast, by Distribution Channel 2020 & 2033
- Table 17: Global Textile Machinery Manufacturing Industry Revenue Million Forecast, by Application 2020 & 2033
- Table 18: Global Textile Machinery Manufacturing Industry Volume Billion Forecast, by Application 2020 & 2033
- Table 19: Global Textile Machinery Manufacturing Industry Revenue Million Forecast, by Country 2020 & 2033
- Table 20: Global Textile Machinery Manufacturing Industry Volume Billion Forecast, by Country 2020 & 2033
- Table 21: United States Textile Machinery Manufacturing Industry Revenue (Million) Forecast, by Application 2020 & 2033
- Table 22: United States Textile Machinery Manufacturing Industry Volume (Billion) Forecast, by Application 2020 & 2033
- Table 23: Canada Textile Machinery Manufacturing Industry Revenue (Million) Forecast, by Application 2020 & 2033
- Table 24: Canada Textile Machinery Manufacturing Industry Volume (Billion) Forecast, by Application 2020 & 2033
- Table 25: Mexico Textile Machinery Manufacturing Industry Revenue (Million) Forecast, by Application 2020 & 2033
- Table 26: Mexico Textile Machinery Manufacturing Industry Volume (Billion) Forecast, by Application 2020 & 2033
- Table 27: Global Textile Machinery Manufacturing Industry Revenue Million Forecast, by Raw Material 2020 & 2033
- Table 28: Global Textile Machinery Manufacturing Industry Volume Billion Forecast, by Raw Material 2020 & 2033
- Table 29: Global Textile Machinery Manufacturing Industry Revenue Million Forecast, by Machine Type 2020 & 2033
- Table 30: Global Textile Machinery Manufacturing Industry Volume Billion Forecast, by Machine Type 2020 & 2033
- Table 31: Global Textile Machinery Manufacturing Industry Revenue Million Forecast, by Distribution Channel 2020 & 2033
- Table 32: Global Textile Machinery Manufacturing Industry Volume Billion Forecast, by Distribution Channel 2020 & 2033
- Table 33: Global Textile Machinery Manufacturing Industry Revenue Million Forecast, by Application 2020 & 2033
- Table 34: Global Textile Machinery Manufacturing Industry Volume Billion Forecast, by Application 2020 & 2033
- Table 35: Global Textile Machinery Manufacturing Industry Revenue Million Forecast, by Country 2020 & 2033
- Table 36: Global Textile Machinery Manufacturing Industry Volume Billion Forecast, by Country 2020 & 2033
- Table 37: Germany Textile Machinery Manufacturing Industry Revenue (Million) Forecast, by Application 2020 & 2033
- Table 38: Germany Textile Machinery Manufacturing Industry Volume (Billion) Forecast, by Application 2020 & 2033
- Table 39: France Textile Machinery Manufacturing Industry Revenue (Million) Forecast, by Application 2020 & 2033
- Table 40: France Textile Machinery Manufacturing Industry Volume (Billion) Forecast, by Application 2020 & 2033
- Table 41: United Kingdom Textile Machinery Manufacturing Industry Revenue (Million) Forecast, by Application 2020 & 2033
- Table 42: United Kingdom Textile Machinery Manufacturing Industry Volume (Billion) Forecast, by Application 2020 & 2033
- Table 43: Italy Textile Machinery Manufacturing Industry Revenue (Million) Forecast, by Application 2020 & 2033
- Table 44: Italy Textile Machinery Manufacturing Industry Volume (Billion) Forecast, by Application 2020 & 2033
- Table 45: Spain Textile Machinery Manufacturing Industry Revenue (Million) Forecast, by Application 2020 & 2033
- Table 46: Spain Textile Machinery Manufacturing Industry Volume (Billion) Forecast, by Application 2020 & 2033
- Table 47: Russia Textile Machinery Manufacturing Industry Revenue (Million) Forecast, by Application 2020 & 2033
- Table 48: Russia Textile Machinery Manufacturing Industry Volume (Billion) Forecast, by Application 2020 & 2033
- Table 49: Rest of Europe Textile Machinery Manufacturing Industry Revenue (Million) Forecast, by Application 2020 & 2033
- Table 50: Rest of Europe Textile Machinery Manufacturing Industry Volume (Billion) Forecast, by Application 2020 & 2033
- Table 51: Global Textile Machinery Manufacturing Industry Revenue Million Forecast, by Raw Material 2020 & 2033
- Table 52: Global Textile Machinery Manufacturing Industry Volume Billion Forecast, by Raw Material 2020 & 2033
- Table 53: Global Textile Machinery Manufacturing Industry Revenue Million Forecast, by Machine Type 2020 & 2033
- Table 54: Global Textile Machinery Manufacturing Industry Volume Billion Forecast, by Machine Type 2020 & 2033
- Table 55: Global Textile Machinery Manufacturing Industry Revenue Million Forecast, by Distribution Channel 2020 & 2033
- Table 56: Global Textile Machinery Manufacturing Industry Volume Billion Forecast, by Distribution Channel 2020 & 2033
- Table 57: Global Textile Machinery Manufacturing Industry Revenue Million Forecast, by Application 2020 & 2033
- Table 58: Global Textile Machinery Manufacturing Industry Volume Billion Forecast, by Application 2020 & 2033
- Table 59: Global Textile Machinery Manufacturing Industry Revenue Million Forecast, by Country 2020 & 2033
- Table 60: Global Textile Machinery Manufacturing Industry Volume Billion Forecast, by Country 2020 & 2033
- Table 61: China Textile Machinery Manufacturing Industry Revenue (Million) Forecast, by Application 2020 & 2033
- Table 62: China Textile Machinery Manufacturing Industry Volume (Billion) Forecast, by Application 2020 & 2033
- Table 63: Japan Textile Machinery Manufacturing Industry Revenue (Million) Forecast, by Application 2020 & 2033
- Table 64: Japan Textile Machinery Manufacturing Industry Volume (Billion) Forecast, by Application 2020 & 2033
- Table 65: India Textile Machinery Manufacturing Industry Revenue (Million) Forecast, by Application 2020 & 2033
- Table 66: India Textile Machinery Manufacturing Industry Volume (Billion) Forecast, by Application 2020 & 2033
- Table 67: Bangladesh Textile Machinery Manufacturing Industry Revenue (Million) Forecast, by Application 2020 & 2033
- Table 68: Bangladesh Textile Machinery Manufacturing Industry Volume (Billion) Forecast, by Application 2020 & 2033
- Table 69: Turkey Textile Machinery Manufacturing Industry Revenue (Million) Forecast, by Application 2020 & 2033
- Table 70: Turkey Textile Machinery Manufacturing Industry Volume (Billion) Forecast, by Application 2020 & 2033
- Table 71: South Korea Textile Machinery Manufacturing Industry Revenue (Million) Forecast, by Application 2020 & 2033
- Table 72: South Korea Textile Machinery Manufacturing Industry Volume (Billion) Forecast, by Application 2020 & 2033
- Table 73: Australia Textile Machinery Manufacturing Industry Revenue (Million) Forecast, by Application 2020 & 2033
- Table 74: Australia Textile Machinery Manufacturing Industry Volume (Billion) Forecast, by Application 2020 & 2033
- Table 75: Indonesia Textile Machinery Manufacturing Industry Revenue (Million) Forecast, by Application 2020 & 2033
- Table 76: Indonesia Textile Machinery Manufacturing Industry Volume (Billion) Forecast, by Application 2020 & 2033
- Table 77: Rest of Asia Pacific Textile Machinery Manufacturing Industry Revenue (Million) Forecast, by Application 2020 & 2033
- Table 78: Rest of Asia Pacific Textile Machinery Manufacturing Industry Volume (Billion) Forecast, by Application 2020 & 2033
- Table 79: Global Textile Machinery Manufacturing Industry Revenue Million Forecast, by Raw Material 2020 & 2033
- Table 80: Global Textile Machinery Manufacturing Industry Volume Billion Forecast, by Raw Material 2020 & 2033
- Table 81: Global Textile Machinery Manufacturing Industry Revenue Million Forecast, by Machine Type 2020 & 2033
- Table 82: Global Textile Machinery Manufacturing Industry Volume Billion Forecast, by Machine Type 2020 & 2033
- Table 83: Global Textile Machinery Manufacturing Industry Revenue Million Forecast, by Distribution Channel 2020 & 2033
- Table 84: Global Textile Machinery Manufacturing Industry Volume Billion Forecast, by Distribution Channel 2020 & 2033
- Table 85: Global Textile Machinery Manufacturing Industry Revenue Million Forecast, by Application 2020 & 2033
- Table 86: Global Textile Machinery Manufacturing Industry Volume Billion Forecast, by Application 2020 & 2033
- Table 87: Global Textile Machinery Manufacturing Industry Revenue Million Forecast, by Country 2020 & 2033
- Table 88: Global Textile Machinery Manufacturing Industry Volume Billion Forecast, by Country 2020 & 2033
- Table 89: Global Textile Machinery Manufacturing Industry Revenue Million Forecast, by Raw Material 2020 & 2033
- Table 90: Global Textile Machinery Manufacturing Industry Volume Billion Forecast, by Raw Material 2020 & 2033
- Table 91: Global Textile Machinery Manufacturing Industry Revenue Million Forecast, by Machine Type 2020 & 2033
- Table 92: Global Textile Machinery Manufacturing Industry Volume Billion Forecast, by Machine Type 2020 & 2033
- Table 93: Global Textile Machinery Manufacturing Industry Revenue Million Forecast, by Distribution Channel 2020 & 2033
- Table 94: Global Textile Machinery Manufacturing Industry Volume Billion Forecast, by Distribution Channel 2020 & 2033
- Table 95: Global Textile Machinery Manufacturing Industry Revenue Million Forecast, by Application 2020 & 2033
- Table 96: Global Textile Machinery Manufacturing Industry Volume Billion Forecast, by Application 2020 & 2033
- Table 97: Global Textile Machinery Manufacturing Industry Revenue Million Forecast, by Country 2020 & 2033
- Table 98: Global Textile Machinery Manufacturing Industry Volume Billion Forecast, by Country 2020 & 2033
- Table 99: South Africa Textile Machinery Manufacturing Industry Revenue (Million) Forecast, by Application 2020 & 2033
- Table 100: South Africa Textile Machinery Manufacturing Industry Volume (Billion) Forecast, by Application 2020 & 2033
- Table 101: Saudi Arabia Textile Machinery Manufacturing Industry Revenue (Million) Forecast, by Application 2020 & 2033
- Table 102: Saudi Arabia Textile Machinery Manufacturing Industry Volume (Billion) Forecast, by Application 2020 & 2033
- Table 103: Rest of Middle East Textile Machinery Manufacturing Industry Revenue (Million) Forecast, by Application 2020 & 2033
- Table 104: Rest of Middle East Textile Machinery Manufacturing Industry Volume (Billion) Forecast, by Application 2020 & 2033
- Table 105: Global Textile Machinery Manufacturing Industry Revenue Million Forecast, by Raw Material 2020 & 2033
- Table 106: Global Textile Machinery Manufacturing Industry Volume Billion Forecast, by Raw Material 2020 & 2033
- Table 107: Global Textile Machinery Manufacturing Industry Revenue Million Forecast, by Machine Type 2020 & 2033
- Table 108: Global Textile Machinery Manufacturing Industry Volume Billion Forecast, by Machine Type 2020 & 2033
- Table 109: Global Textile Machinery Manufacturing Industry Revenue Million Forecast, by Distribution Channel 2020 & 2033
- Table 110: Global Textile Machinery Manufacturing Industry Volume Billion Forecast, by Distribution Channel 2020 & 2033
- Table 111: Global Textile Machinery Manufacturing Industry Revenue Million Forecast, by Application 2020 & 2033
- Table 112: Global Textile Machinery Manufacturing Industry Volume Billion Forecast, by Application 2020 & 2033
- Table 113: Global Textile Machinery Manufacturing Industry Revenue Million Forecast, by Country 2020 & 2033
- Table 114: Global Textile Machinery Manufacturing Industry Volume Billion Forecast, by Country 2020 & 2033
- Table 115: Brazil Textile Machinery Manufacturing Industry Revenue (Million) Forecast, by Application 2020 & 2033
- Table 116: Brazil Textile Machinery Manufacturing Industry Volume (Billion) Forecast, by Application 2020 & 2033
- Table 117: Argentina Textile Machinery Manufacturing Industry Revenue (Million) Forecast, by Application 2020 & 2033
- Table 118: Argentina Textile Machinery Manufacturing Industry Volume (Billion) Forecast, by Application 2020 & 2033
- Table 119: Rest of South America Textile Machinery Manufacturing Industry Revenue (Million) Forecast, by Application 2020 & 2033
- Table 120: Rest of South America Textile Machinery Manufacturing Industry Volume (Billion) Forecast, by Application 2020 & 2033
Frequently Asked Questions
1. What is the projected Compound Annual Growth Rate (CAGR) of the Textile Machinery Manufacturing Industry?
The projected CAGR is approximately 4.87%.
2. Which companies are prominent players in the Textile Machinery Manufacturing Industry?
Key companies in the market include OC Oerlikon, Trutzschler Group, Savio Macchine Tessili S p A, Rieter Holding AG, Lakshmi Machine Works Ltd, Murata Machinery Ltd, Santoni S p A, Saurer Intelligent Technlogy AG, TMT Machinery Inc, Mayer & Cie GmbH & Co KG**List Not Exhaustive 6 3 Other Companies (Overview/Key Information.
3. What are the main segments of the Textile Machinery Manufacturing Industry?
The market segments include Raw Material, Machine Type, Distribution Channel, Application.
4. Can you provide details about the market size?
The market size is estimated to be USD 31.67 Million as of 2022.
5. What are some drivers contributing to market growth?
N/A
6. What are the notable trends driving market growth?
Spinning Machine Segment is the Fastest Growing Machinery Segment.
7. Are there any restraints impacting market growth?
N/A
8. Can you provide examples of recent developments in the market?
June, 2022: Trützschler Nonwovens & Man-Made Fibers work with Texnology, an Italian textile machinery company, to develop full needle-punching lines. T-SUPREMA will be the brand name for the lines, which will be accessible immediately. Web bonding using steel needles is the most important manufacturing method in the dry-laid nonwoven industry. The majority of uses are of a technical nature, with the most significant being durable geotextiles, automotive textiles, and filter media.
9. What pricing options are available for accessing the report?
Pricing options include single-user, multi-user, and enterprise licenses priced at USD 4750, USD 5250, and USD 8750 respectively.
10. Is the market size provided in terms of value or volume?
The market size is provided in terms of value, measured in Million and volume, measured in Billion.
11. Are there any specific market keywords associated with the report?
Yes, the market keyword associated with the report is "Textile Machinery Manufacturing Industry," which aids in identifying and referencing the specific market segment covered.
12. How do I determine which pricing option suits my needs best?
The pricing options vary based on user requirements and access needs. Individual users may opt for single-user licenses, while businesses requiring broader access may choose multi-user or enterprise licenses for cost-effective access to the report.
13. Are there any additional resources or data provided in the Textile Machinery Manufacturing Industry report?
While the report offers comprehensive insights, it's advisable to review the specific contents or supplementary materials provided to ascertain if additional resources or data are available.
14. How can I stay updated on further developments or reports in the Textile Machinery Manufacturing Industry?
To stay informed about further developments, trends, and reports in the Textile Machinery Manufacturing Industry, consider subscribing to industry newsletters, following relevant companies and organizations, or regularly checking reputable industry news sources and publications.
Methodology
Step 1 - Identification of Relevant Samples Size from Population Database


Step 2 - Approaches for Defining Global Market Size (Value, Volume* & Price*)

Note*: In applicable scenarios
Step 3 - Data Sources
Primary Research
- Web Analytics
- Survey Reports
- Research Institute
- Latest Research Reports
- Opinion Leaders
Secondary Research
- Annual Reports
- White Paper
- Latest Press Release
- Industry Association
- Paid Database
- Investor Presentations

Step 4 - Data Triangulation
Involves using different sources of information in order to increase the validity of a study
These sources are likely to be stakeholders in a program - participants, other researchers, program staff, other community members, and so on.
Then we put all data in single framework & apply various statistical tools to find out the dynamic on the market.
During the analysis stage, feedback from the stakeholder groups would be compared to determine areas of agreement as well as areas of divergence