
Key Insights
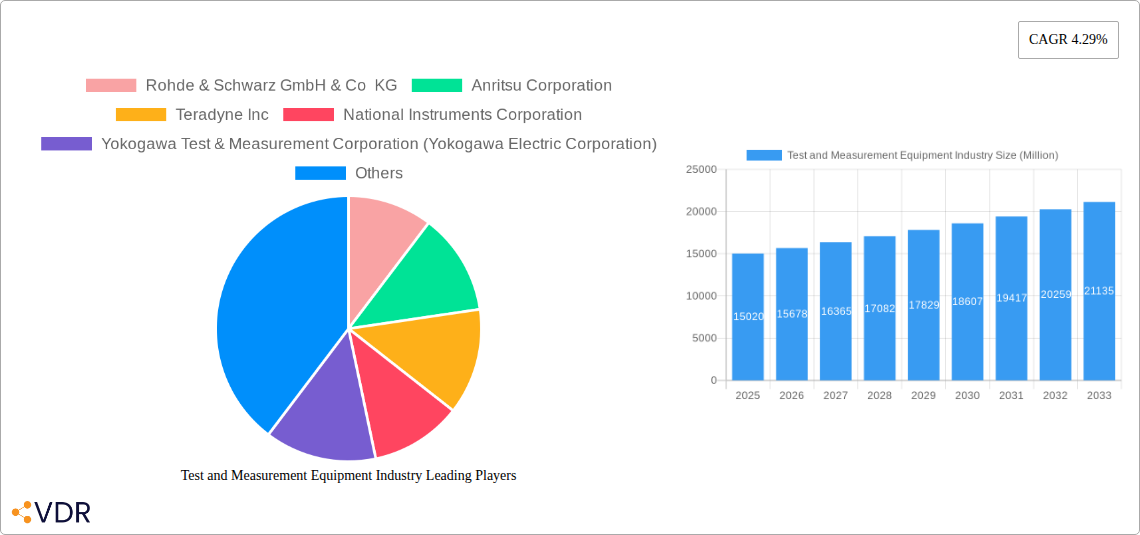
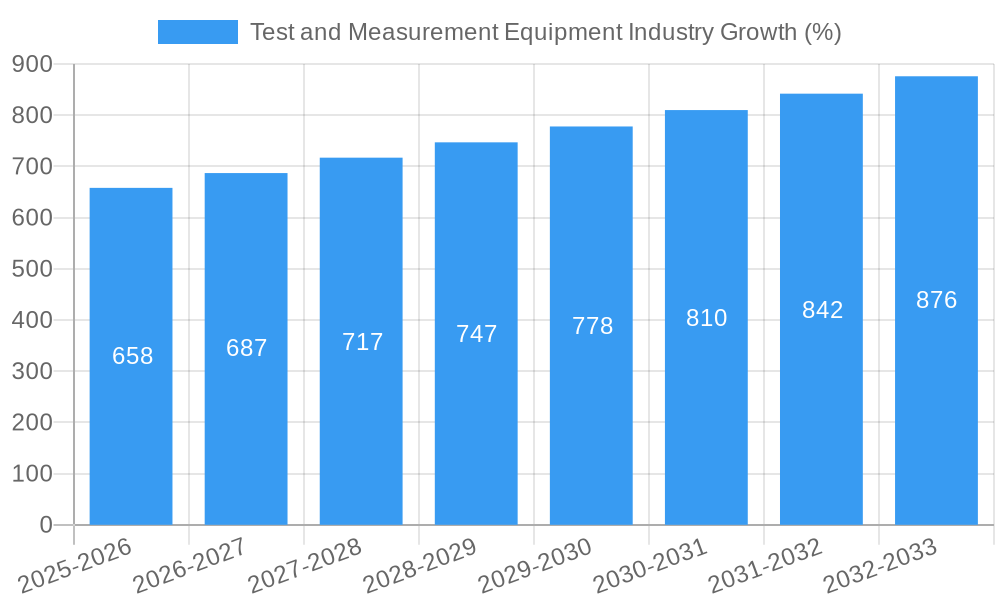
The global Test and Measurement Equipment market is experiencing robust growth, projected to reach \$15.02 billion in 2025 and maintain a Compound Annual Growth Rate (CAGR) of 4.29% from 2025 to 2033. This expansion is driven by several key factors. The increasing demand for higher-speed data transmission in 5G and beyond networks fuels the need for sophisticated testing solutions. Furthermore, the rapid growth of the semiconductor industry, particularly in advanced nodes and high-performance computing, necessitates rigorous testing protocols and advanced equipment. The automotive sector's shift toward electric vehicles (EVs) and autonomous driving systems presents another significant growth driver, as these technologies require comprehensive testing and validation. Finally, the rising adoption of IoT devices and the increasing complexity of electronic systems across various industries are contributing to market expansion. The market is segmented by equipment type (Semiconductor ATE, RF Test Equipment, Digital Test Equipment, Electrical and Environmental Test, Data Acquisition) and end-user industry (Communications, Semiconductors and Computing, Aerospace and Defense, Consumer Electronics, Electric Vehicles, Others), offering diverse opportunities for players across the value chain.
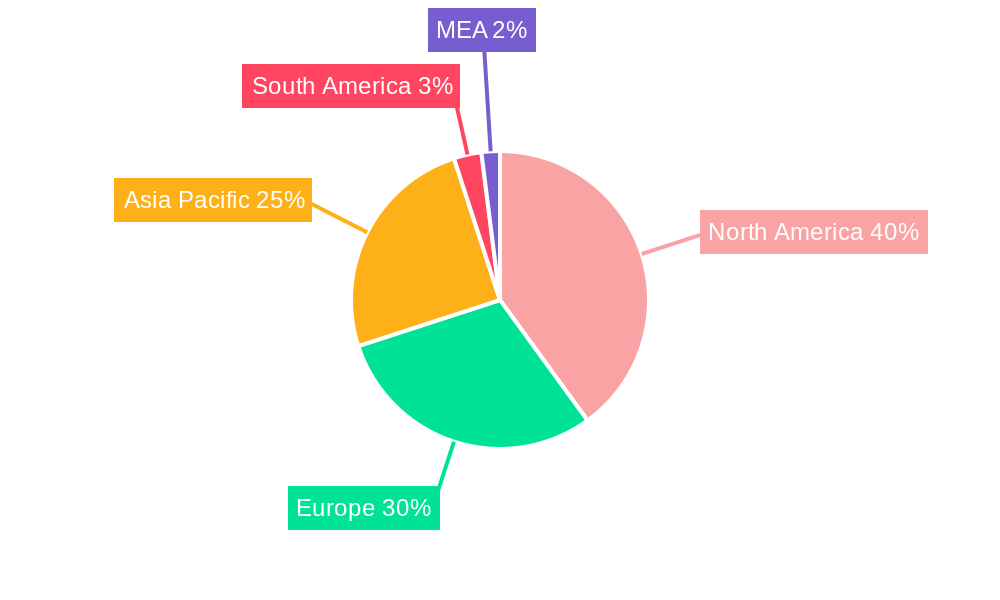
Market restraints include the high cost of advanced test equipment, potentially limiting adoption among smaller companies. Furthermore, the cyclical nature of the semiconductor and electronics industries can impact demand. However, these challenges are being mitigated by technological advancements, increased automation, and the emergence of cloud-based testing solutions that enhance accessibility and reduce costs. The market demonstrates regional variations in growth, with North America and Asia-Pacific expected to lead, driven by substantial investments in technological infrastructure and innovation within these regions. Major players, including Rohde & Schwarz, Anritsu, Teradyne, National Instruments, and Keysight Technologies, are actively engaged in product innovation and strategic partnerships to maintain their market positions and capture future growth opportunities. The market's positive outlook indicates sustained growth, driven by technological advancements and the expanding need for robust testing capabilities across various sectors.
Test and Measurement Equipment Industry Market Report: 2019-2033
This comprehensive report provides an in-depth analysis of the Test and Measurement Equipment market, encompassing market dynamics, growth trends, regional dominance, product landscape, key players, and future outlook. The study period covers 2019-2033, with 2025 as the base and estimated year. The report leverages extensive data analysis to offer actionable insights for industry professionals, investors, and stakeholders. The market is segmented by type (Semiconductor Automatic Test Equipment (ATE), Radio Frequency (RF) Test Equipment, Digital Test Equipment, Electrical and Environmental Test, Data Acquisition (DAQ)) and end-user industry (Communications, Semiconductors and Computing, Aerospace and Defense, Consumer Electronics, Electric Vehicles (EVs), Other End-user Industries). The total market size is projected to reach xx Million units by 2033.
Test and Measurement Equipment Industry Market Dynamics & Structure
The Test and Measurement Equipment market is characterized by a moderately concentrated landscape with key players like Rohde & Schwarz GmbH & Co KG, Anritsu Corporation, and Keysight Technologies Inc. holding significant market share. Technological innovation, particularly in areas like 5G, AI, and IoT, is a major driver, pushing demand for advanced testing solutions. Stringent regulatory compliance requirements, especially in sectors like aerospace and defense, influence market growth. The emergence of sophisticated software-defined testing solutions presents a challenge to traditional hardware-centric players. The market also witnesses continuous M&A activity, with recent examples such as Microtest Group's acquisition of Test Inspire in June 2023. This trend is likely to continue, driven by the need to expand product portfolios and gain access to new technologies.
- Market Concentration: Moderately concentrated, with top 5 players holding approximately xx% market share in 2025.
- Technological Innovation: 5G, AI, IoT, and advancements in semiconductor technology are key drivers.
- Regulatory Frameworks: Stringent regulations in aerospace, defense, and automotive sectors impact market dynamics.
- Competitive Substitutes: Software-defined testing and cloud-based solutions pose a competitive threat.
- M&A Activity: Significant M&A activity observed, with xx major deals recorded between 2019 and 2024.
Test and Measurement Equipment Industry Growth Trends & Insights
The Test and Measurement Equipment market experienced robust growth during the historical period (2019-2024), with a CAGR of xx%. This growth is primarily attributed to the increasing demand for high-performance electronics across various end-user industries. The adoption rate of advanced testing solutions, particularly ATE for semiconductor testing and RF test equipment for 5G infrastructure, is rising significantly. Technological disruptions, such as the shift towards software-defined instrumentation and the integration of AI/ML in test processes, are reshaping the market landscape. Consumer behavior is shifting towards more sophisticated and integrated solutions, impacting product design and market demand. The market is expected to maintain a healthy CAGR of xx% during the forecast period (2025-2033), driven by sustained demand from the semiconductor, telecommunications, and automotive industries.
Dominant Regions, Countries, or Segments in Test and Measurement Equipment Industry
North America currently holds the largest market share, followed by Asia Pacific. Within the segments, Semiconductor ATE dominates in terms of revenue, driven by the booming semiconductor industry. However, RF Test Equipment is expected to witness significant growth due to the expansion of 5G networks globally.
- Leading Region: North America (xx% market share in 2025)
- High-Growth Region: Asia-Pacific (xx% CAGR during forecast period)
- Dominant Segment (by type): Semiconductor ATE (xx% market share in 2025)
- Fastest Growing Segment (by type): RF Test Equipment (xx% CAGR during forecast period)
- Key Drivers: Robust semiconductor industry growth in Asia-Pacific, increasing investments in 5G infrastructure globally, and government regulations promoting technological advancement.
Test and Measurement Equipment Industry Product Landscape
The market offers a wide range of products, from basic multimeters to sophisticated ATE systems, each tailored to specific applications. Recent innovations include the integration of AI algorithms for automated defect analysis and improved measurement accuracy. The use of cloud-based platforms for data storage and remote access is gaining traction. Key selling propositions focus on increased accuracy, faster testing speeds, and better data analysis capabilities. Technological advancements continue to drive product differentiation and enhance testing efficiency.
Key Drivers, Barriers & Challenges in Test and Measurement Equipment Industry
Key Drivers:
- Increasing demand for high-performance electronics across various sectors.
- Advancements in semiconductor technology, driving demand for more sophisticated ATE solutions.
- Expansion of 5G networks and IoT devices, stimulating demand for RF test equipment.
- Government investments in research and development in advanced electronics.
Key Challenges:
- High initial investment costs for advanced testing solutions, particularly ATE.
- Intense competition among established players and the emergence of new entrants.
- Supply chain disruptions and component shortages.
- Regulatory complexities and compliance requirements varying across geographies.
Emerging Opportunities in Test and Measurement Equipment Industry
- Growing demand for test and measurement solutions in electric vehicle manufacturing and related supply chains.
- Increasing adoption of IoT devices and the need for reliable testing solutions for these interconnected systems.
- Development of innovative testing solutions for emerging technologies, like quantum computing and artificial intelligence.
- Expansion into untapped markets in developing economies.
Growth Accelerators in the Test and Measurement Equipment Industry
Technological breakthroughs, such as advancements in AI-powered analytics and miniaturization of test equipment, are expected to accelerate market growth. Strategic partnerships between test equipment manufacturers and semiconductor companies will further propel market expansion. Focused efforts to expand into new geographic markets, especially in developing economies with burgeoning electronics industries, will also contribute to long-term growth.
Key Players Shaping the Test and Measurement Equipment Industry Market
- Rohde & Schwarz GmbH & Co KG
- Anritsu Corporation
- Teradyne Inc
- National Instruments Corporation
- Yokogawa Test & Measurement Corporation (Yokogawa Electric Corporation)
- Advantest Corporation
- Chauvin Arnoux Group
- Fortive Corporation
- Teledyne Lecroy (Teledyne Technologies Incorporated)
- Keysight Technologies Inc
Notable Milestones in Test and Measurement Equipment Industry Sector
- July 2023: Teradyne Unveils Archimedes Analytics Solution – Launch of a real-time analytics solution for semiconductor testing, improving efficiency and yield.
- June 2023: Microtest Group Completes Acquisition of Test Inspire – Strategic acquisition enhancing semiconductor testing capabilities in Europe.
In-Depth Test and Measurement Equipment Industry Market Outlook
The Test and Measurement Equipment market is poised for continued growth, driven by technological advancements and increasing demand across diverse sectors. Strategic partnerships and expansion into emerging markets will play a crucial role in shaping the future market landscape. The focus on developing AI-powered, highly integrated, and user-friendly testing solutions will be key to success in this dynamic industry. The market is anticipated to see a significant increase in the adoption of cloud-based testing solutions, further enhancing accessibility and collaboration.
Test and Measurement Equipment Industry Segmentation
-
1. Type
- 1.1. Semiconductor Automatic Test Equipment (ATE)
- 1.2. Radio Frequency (RF) Test Equipment
- 1.3. Digital Test Equipment
- 1.4. Electrical and Environmental Test
- 1.5. Data Acquisition (DAQ)
-
2. End-user Industry
- 2.1. Communications
- 2.2. Semiconductors and Computing
- 2.3. Aerospace and Defense
- 2.4. Consumer Electronics
- 2.5. Electric Vehicles (EVs)
- 2.6. Other End-user Industries
Test and Measurement Equipment Industry Segmentation By Geography
- 1. North America
- 2. Europe
- 3. Asia
- 4. Australia and New Zealand
- 5. Latin America
- 6. Middle East and Africa
Test and Measurement Equipment Industry REPORT HIGHLIGHTS
| Aspects | Details |
|---|---|
| Study Period | 2019-2033 |
| Base Year | 2024 |
| Estimated Year | 2025 |
| Forecast Period | 2025-2033 |
| Historical Period | 2019-2024 |
| Growth Rate | CAGR of 4.29% from 2019-2033 |
| Segmentation |
|
Table of Contents
- 1. Introduction
- 1.1. Research Scope
- 1.2. Market Segmentation
- 1.3. Research Methodology
- 1.4. Definitions and Assumptions
- 2. Executive Summary
- 2.1. Introduction
- 3. Market Dynamics
- 3.1. Introduction
- 3.2. Market Drivers
- 3.2.1. Technological Advancements Leading to the need for Test and Measurement Equipment; Emerging Trend of Electric and Hybrid Vehicle
- 3.3. Market Restrains
- 3.3.1. Difficulty in Integrating Firewalls with Existing Network Infrastructure; Complexity of Deploying and Managing Firewalls due to Limited Expertise
- 3.4. Market Trends
- 3.4.1. Semiconductors and Computing to be the Largest End-user Industry
- 4. Market Factor Analysis
- 4.1. Porters Five Forces
- 4.2. Supply/Value Chain
- 4.3. PESTEL analysis
- 4.4. Market Entropy
- 4.5. Patent/Trademark Analysis
- 5. Global Test and Measurement Equipment Industry Analysis, Insights and Forecast, 2019-2031
- 5.1. Market Analysis, Insights and Forecast - by Type
- 5.1.1. Semiconductor Automatic Test Equipment (ATE)
- 5.1.2. Radio Frequency (RF) Test Equipment
- 5.1.3. Digital Test Equipment
- 5.1.4. Electrical and Environmental Test
- 5.1.5. Data Acquisition (DAQ)
- 5.2. Market Analysis, Insights and Forecast - by End-user Industry
- 5.2.1. Communications
- 5.2.2. Semiconductors and Computing
- 5.2.3. Aerospace and Defense
- 5.2.4. Consumer Electronics
- 5.2.5. Electric Vehicles (EVs)
- 5.2.6. Other End-user Industries
- 5.3. Market Analysis, Insights and Forecast - by Region
- 5.3.1. North America
- 5.3.2. Europe
- 5.3.3. Asia
- 5.3.4. Australia and New Zealand
- 5.3.5. Latin America
- 5.3.6. Middle East and Africa
- 5.1. Market Analysis, Insights and Forecast - by Type
- 6. North America Test and Measurement Equipment Industry Analysis, Insights and Forecast, 2019-2031
- 6.1. Market Analysis, Insights and Forecast - by Type
- 6.1.1. Semiconductor Automatic Test Equipment (ATE)
- 6.1.2. Radio Frequency (RF) Test Equipment
- 6.1.3. Digital Test Equipment
- 6.1.4. Electrical and Environmental Test
- 6.1.5. Data Acquisition (DAQ)
- 6.2. Market Analysis, Insights and Forecast - by End-user Industry
- 6.2.1. Communications
- 6.2.2. Semiconductors and Computing
- 6.2.3. Aerospace and Defense
- 6.2.4. Consumer Electronics
- 6.2.5. Electric Vehicles (EVs)
- 6.2.6. Other End-user Industries
- 6.1. Market Analysis, Insights and Forecast - by Type
- 7. Europe Test and Measurement Equipment Industry Analysis, Insights and Forecast, 2019-2031
- 7.1. Market Analysis, Insights and Forecast - by Type
- 7.1.1. Semiconductor Automatic Test Equipment (ATE)
- 7.1.2. Radio Frequency (RF) Test Equipment
- 7.1.3. Digital Test Equipment
- 7.1.4. Electrical and Environmental Test
- 7.1.5. Data Acquisition (DAQ)
- 7.2. Market Analysis, Insights and Forecast - by End-user Industry
- 7.2.1. Communications
- 7.2.2. Semiconductors and Computing
- 7.2.3. Aerospace and Defense
- 7.2.4. Consumer Electronics
- 7.2.5. Electric Vehicles (EVs)
- 7.2.6. Other End-user Industries
- 7.1. Market Analysis, Insights and Forecast - by Type
- 8. Asia Test and Measurement Equipment Industry Analysis, Insights and Forecast, 2019-2031
- 8.1. Market Analysis, Insights and Forecast - by Type
- 8.1.1. Semiconductor Automatic Test Equipment (ATE)
- 8.1.2. Radio Frequency (RF) Test Equipment
- 8.1.3. Digital Test Equipment
- 8.1.4. Electrical and Environmental Test
- 8.1.5. Data Acquisition (DAQ)
- 8.2. Market Analysis, Insights and Forecast - by End-user Industry
- 8.2.1. Communications
- 8.2.2. Semiconductors and Computing
- 8.2.3. Aerospace and Defense
- 8.2.4. Consumer Electronics
- 8.2.5. Electric Vehicles (EVs)
- 8.2.6. Other End-user Industries
- 8.1. Market Analysis, Insights and Forecast - by Type
- 9. Australia and New Zealand Test and Measurement Equipment Industry Analysis, Insights and Forecast, 2019-2031
- 9.1. Market Analysis, Insights and Forecast - by Type
- 9.1.1. Semiconductor Automatic Test Equipment (ATE)
- 9.1.2. Radio Frequency (RF) Test Equipment
- 9.1.3. Digital Test Equipment
- 9.1.4. Electrical and Environmental Test
- 9.1.5. Data Acquisition (DAQ)
- 9.2. Market Analysis, Insights and Forecast - by End-user Industry
- 9.2.1. Communications
- 9.2.2. Semiconductors and Computing
- 9.2.3. Aerospace and Defense
- 9.2.4. Consumer Electronics
- 9.2.5. Electric Vehicles (EVs)
- 9.2.6. Other End-user Industries
- 9.1. Market Analysis, Insights and Forecast - by Type
- 10. Latin America Test and Measurement Equipment Industry Analysis, Insights and Forecast, 2019-2031
- 10.1. Market Analysis, Insights and Forecast - by Type
- 10.1.1. Semiconductor Automatic Test Equipment (ATE)
- 10.1.2. Radio Frequency (RF) Test Equipment
- 10.1.3. Digital Test Equipment
- 10.1.4. Electrical and Environmental Test
- 10.1.5. Data Acquisition (DAQ)
- 10.2. Market Analysis, Insights and Forecast - by End-user Industry
- 10.2.1. Communications
- 10.2.2. Semiconductors and Computing
- 10.2.3. Aerospace and Defense
- 10.2.4. Consumer Electronics
- 10.2.5. Electric Vehicles (EVs)
- 10.2.6. Other End-user Industries
- 10.1. Market Analysis, Insights and Forecast - by Type
- 11. Middle East and Africa Test and Measurement Equipment Industry Analysis, Insights and Forecast, 2019-2031
- 11.1. Market Analysis, Insights and Forecast - by Type
- 11.1.1. Semiconductor Automatic Test Equipment (ATE)
- 11.1.2. Radio Frequency (RF) Test Equipment
- 11.1.3. Digital Test Equipment
- 11.1.4. Electrical and Environmental Test
- 11.1.5. Data Acquisition (DAQ)
- 11.2. Market Analysis, Insights and Forecast - by End-user Industry
- 11.2.1. Communications
- 11.2.2. Semiconductors and Computing
- 11.2.3. Aerospace and Defense
- 11.2.4. Consumer Electronics
- 11.2.5. Electric Vehicles (EVs)
- 11.2.6. Other End-user Industries
- 11.1. Market Analysis, Insights and Forecast - by Type
- 12. North America Test and Measurement Equipment Industry Analysis, Insights and Forecast, 2019-2031
- 12.1. Market Analysis, Insights and Forecast - By Country/Sub-region
- 12.1.1 United States
- 12.1.2 Canada
- 12.1.3 Mexico
- 13. Europe Test and Measurement Equipment Industry Analysis, Insights and Forecast, 2019-2031
- 13.1. Market Analysis, Insights and Forecast - By Country/Sub-region
- 13.1.1 Germany
- 13.1.2 United Kingdom
- 13.1.3 France
- 13.1.4 Spain
- 13.1.5 Italy
- 13.1.6 Spain
- 13.1.7 Belgium
- 13.1.8 Netherland
- 13.1.9 Nordics
- 13.1.10 Rest of Europe
- 14. Asia Pacific Test and Measurement Equipment Industry Analysis, Insights and Forecast, 2019-2031
- 14.1. Market Analysis, Insights and Forecast - By Country/Sub-region
- 14.1.1 China
- 14.1.2 Japan
- 14.1.3 India
- 14.1.4 South Korea
- 14.1.5 Southeast Asia
- 14.1.6 Australia
- 14.1.7 Indonesia
- 14.1.8 Phillipes
- 14.1.9 Singapore
- 14.1.10 Thailandc
- 14.1.11 Rest of Asia Pacific
- 15. South America Test and Measurement Equipment Industry Analysis, Insights and Forecast, 2019-2031
- 15.1. Market Analysis, Insights and Forecast - By Country/Sub-region
- 15.1.1 Brazil
- 15.1.2 Argentina
- 15.1.3 Peru
- 15.1.4 Chile
- 15.1.5 Colombia
- 15.1.6 Ecuador
- 15.1.7 Venezuela
- 15.1.8 Rest of South America
- 16. North America Test and Measurement Equipment Industry Analysis, Insights and Forecast, 2019-2031
- 16.1. Market Analysis, Insights and Forecast - By Country/Sub-region
- 16.1.1 United States
- 16.1.2 Canada
- 16.1.3 Mexico
- 17. MEA Test and Measurement Equipment Industry Analysis, Insights and Forecast, 2019-2031
- 17.1. Market Analysis, Insights and Forecast - By Country/Sub-region
- 17.1.1 United Arab Emirates
- 17.1.2 Saudi Arabia
- 17.1.3 South Africa
- 17.1.4 Rest of Middle East and Africa
- 18. Competitive Analysis
- 18.1. Global Market Share Analysis 2024
- 18.2. Company Profiles
- 18.2.1 Rohde & Schwarz GmbH & Co KG
- 18.2.1.1. Overview
- 18.2.1.2. Products
- 18.2.1.3. SWOT Analysis
- 18.2.1.4. Recent Developments
- 18.2.1.5. Financials (Based on Availability)
- 18.2.2 Anritsu Corporation
- 18.2.2.1. Overview
- 18.2.2.2. Products
- 18.2.2.3. SWOT Analysis
- 18.2.2.4. Recent Developments
- 18.2.2.5. Financials (Based on Availability)
- 18.2.3 Teradyne Inc
- 18.2.3.1. Overview
- 18.2.3.2. Products
- 18.2.3.3. SWOT Analysis
- 18.2.3.4. Recent Developments
- 18.2.3.5. Financials (Based on Availability)
- 18.2.4 National Instruments Corporation
- 18.2.4.1. Overview
- 18.2.4.2. Products
- 18.2.4.3. SWOT Analysis
- 18.2.4.4. Recent Developments
- 18.2.4.5. Financials (Based on Availability)
- 18.2.5 Yokogawa Test & Measurement Corporation (Yokogawa Electric Corporation)
- 18.2.5.1. Overview
- 18.2.5.2. Products
- 18.2.5.3. SWOT Analysis
- 18.2.5.4. Recent Developments
- 18.2.5.5. Financials (Based on Availability)
- 18.2.6 Advantest Corporatio
- 18.2.6.1. Overview
- 18.2.6.2. Products
- 18.2.6.3. SWOT Analysis
- 18.2.6.4. Recent Developments
- 18.2.6.5. Financials (Based on Availability)
- 18.2.7 Chauvin Arnoux Group
- 18.2.7.1. Overview
- 18.2.7.2. Products
- 18.2.7.3. SWOT Analysis
- 18.2.7.4. Recent Developments
- 18.2.7.5. Financials (Based on Availability)
- 18.2.8 Fortive Corporation
- 18.2.8.1. Overview
- 18.2.8.2. Products
- 18.2.8.3. SWOT Analysis
- 18.2.8.4. Recent Developments
- 18.2.8.5. Financials (Based on Availability)
- 18.2.9 Teledyne Lecroy (Teledyne Technologies Incorporated)
- 18.2.9.1. Overview
- 18.2.9.2. Products
- 18.2.9.3. SWOT Analysis
- 18.2.9.4. Recent Developments
- 18.2.9.5. Financials (Based on Availability)
- 18.2.10 Keysight Technologies Inc
- 18.2.10.1. Overview
- 18.2.10.2. Products
- 18.2.10.3. SWOT Analysis
- 18.2.10.4. Recent Developments
- 18.2.10.5. Financials (Based on Availability)
- 18.2.1 Rohde & Schwarz GmbH & Co KG
List of Figures
- Figure 1: Global Test and Measurement Equipment Industry Revenue Breakdown (Million, %) by Region 2024 & 2032
- Figure 2: Global Test and Measurement Equipment Industry Volume Breakdown (K Unit, %) by Region 2024 & 2032
- Figure 3: North America Test and Measurement Equipment Industry Revenue (Million), by Country 2024 & 2032
- Figure 4: North America Test and Measurement Equipment Industry Volume (K Unit), by Country 2024 & 2032
- Figure 5: North America Test and Measurement Equipment Industry Revenue Share (%), by Country 2024 & 2032
- Figure 6: North America Test and Measurement Equipment Industry Volume Share (%), by Country 2024 & 2032
- Figure 7: Europe Test and Measurement Equipment Industry Revenue (Million), by Country 2024 & 2032
- Figure 8: Europe Test and Measurement Equipment Industry Volume (K Unit), by Country 2024 & 2032
- Figure 9: Europe Test and Measurement Equipment Industry Revenue Share (%), by Country 2024 & 2032
- Figure 10: Europe Test and Measurement Equipment Industry Volume Share (%), by Country 2024 & 2032
- Figure 11: Asia Pacific Test and Measurement Equipment Industry Revenue (Million), by Country 2024 & 2032
- Figure 12: Asia Pacific Test and Measurement Equipment Industry Volume (K Unit), by Country 2024 & 2032
- Figure 13: Asia Pacific Test and Measurement Equipment Industry Revenue Share (%), by Country 2024 & 2032
- Figure 14: Asia Pacific Test and Measurement Equipment Industry Volume Share (%), by Country 2024 & 2032
- Figure 15: South America Test and Measurement Equipment Industry Revenue (Million), by Country 2024 & 2032
- Figure 16: South America Test and Measurement Equipment Industry Volume (K Unit), by Country 2024 & 2032
- Figure 17: South America Test and Measurement Equipment Industry Revenue Share (%), by Country 2024 & 2032
- Figure 18: South America Test and Measurement Equipment Industry Volume Share (%), by Country 2024 & 2032
- Figure 19: North America Test and Measurement Equipment Industry Revenue (Million), by Country 2024 & 2032
- Figure 20: North America Test and Measurement Equipment Industry Volume (K Unit), by Country 2024 & 2032
- Figure 21: North America Test and Measurement Equipment Industry Revenue Share (%), by Country 2024 & 2032
- Figure 22: North America Test and Measurement Equipment Industry Volume Share (%), by Country 2024 & 2032
- Figure 23: MEA Test and Measurement Equipment Industry Revenue (Million), by Country 2024 & 2032
- Figure 24: MEA Test and Measurement Equipment Industry Volume (K Unit), by Country 2024 & 2032
- Figure 25: MEA Test and Measurement Equipment Industry Revenue Share (%), by Country 2024 & 2032
- Figure 26: MEA Test and Measurement Equipment Industry Volume Share (%), by Country 2024 & 2032
- Figure 27: North America Test and Measurement Equipment Industry Revenue (Million), by Type 2024 & 2032
- Figure 28: North America Test and Measurement Equipment Industry Volume (K Unit), by Type 2024 & 2032
- Figure 29: North America Test and Measurement Equipment Industry Revenue Share (%), by Type 2024 & 2032
- Figure 30: North America Test and Measurement Equipment Industry Volume Share (%), by Type 2024 & 2032
- Figure 31: North America Test and Measurement Equipment Industry Revenue (Million), by End-user Industry 2024 & 2032
- Figure 32: North America Test and Measurement Equipment Industry Volume (K Unit), by End-user Industry 2024 & 2032
- Figure 33: North America Test and Measurement Equipment Industry Revenue Share (%), by End-user Industry 2024 & 2032
- Figure 34: North America Test and Measurement Equipment Industry Volume Share (%), by End-user Industry 2024 & 2032
- Figure 35: North America Test and Measurement Equipment Industry Revenue (Million), by Country 2024 & 2032
- Figure 36: North America Test and Measurement Equipment Industry Volume (K Unit), by Country 2024 & 2032
- Figure 37: North America Test and Measurement Equipment Industry Revenue Share (%), by Country 2024 & 2032
- Figure 38: North America Test and Measurement Equipment Industry Volume Share (%), by Country 2024 & 2032
- Figure 39: Europe Test and Measurement Equipment Industry Revenue (Million), by Type 2024 & 2032
- Figure 40: Europe Test and Measurement Equipment Industry Volume (K Unit), by Type 2024 & 2032
- Figure 41: Europe Test and Measurement Equipment Industry Revenue Share (%), by Type 2024 & 2032
- Figure 42: Europe Test and Measurement Equipment Industry Volume Share (%), by Type 2024 & 2032
- Figure 43: Europe Test and Measurement Equipment Industry Revenue (Million), by End-user Industry 2024 & 2032
- Figure 44: Europe Test and Measurement Equipment Industry Volume (K Unit), by End-user Industry 2024 & 2032
- Figure 45: Europe Test and Measurement Equipment Industry Revenue Share (%), by End-user Industry 2024 & 2032
- Figure 46: Europe Test and Measurement Equipment Industry Volume Share (%), by End-user Industry 2024 & 2032
- Figure 47: Europe Test and Measurement Equipment Industry Revenue (Million), by Country 2024 & 2032
- Figure 48: Europe Test and Measurement Equipment Industry Volume (K Unit), by Country 2024 & 2032
- Figure 49: Europe Test and Measurement Equipment Industry Revenue Share (%), by Country 2024 & 2032
- Figure 50: Europe Test and Measurement Equipment Industry Volume Share (%), by Country 2024 & 2032
- Figure 51: Asia Test and Measurement Equipment Industry Revenue (Million), by Type 2024 & 2032
- Figure 52: Asia Test and Measurement Equipment Industry Volume (K Unit), by Type 2024 & 2032
- Figure 53: Asia Test and Measurement Equipment Industry Revenue Share (%), by Type 2024 & 2032
- Figure 54: Asia Test and Measurement Equipment Industry Volume Share (%), by Type 2024 & 2032
- Figure 55: Asia Test and Measurement Equipment Industry Revenue (Million), by End-user Industry 2024 & 2032
- Figure 56: Asia Test and Measurement Equipment Industry Volume (K Unit), by End-user Industry 2024 & 2032
- Figure 57: Asia Test and Measurement Equipment Industry Revenue Share (%), by End-user Industry 2024 & 2032
- Figure 58: Asia Test and Measurement Equipment Industry Volume Share (%), by End-user Industry 2024 & 2032
- Figure 59: Asia Test and Measurement Equipment Industry Revenue (Million), by Country 2024 & 2032
- Figure 60: Asia Test and Measurement Equipment Industry Volume (K Unit), by Country 2024 & 2032
- Figure 61: Asia Test and Measurement Equipment Industry Revenue Share (%), by Country 2024 & 2032
- Figure 62: Asia Test and Measurement Equipment Industry Volume Share (%), by Country 2024 & 2032
- Figure 63: Australia and New Zealand Test and Measurement Equipment Industry Revenue (Million), by Type 2024 & 2032
- Figure 64: Australia and New Zealand Test and Measurement Equipment Industry Volume (K Unit), by Type 2024 & 2032
- Figure 65: Australia and New Zealand Test and Measurement Equipment Industry Revenue Share (%), by Type 2024 & 2032
- Figure 66: Australia and New Zealand Test and Measurement Equipment Industry Volume Share (%), by Type 2024 & 2032
- Figure 67: Australia and New Zealand Test and Measurement Equipment Industry Revenue (Million), by End-user Industry 2024 & 2032
- Figure 68: Australia and New Zealand Test and Measurement Equipment Industry Volume (K Unit), by End-user Industry 2024 & 2032
- Figure 69: Australia and New Zealand Test and Measurement Equipment Industry Revenue Share (%), by End-user Industry 2024 & 2032
- Figure 70: Australia and New Zealand Test and Measurement Equipment Industry Volume Share (%), by End-user Industry 2024 & 2032
- Figure 71: Australia and New Zealand Test and Measurement Equipment Industry Revenue (Million), by Country 2024 & 2032
- Figure 72: Australia and New Zealand Test and Measurement Equipment Industry Volume (K Unit), by Country 2024 & 2032
- Figure 73: Australia and New Zealand Test and Measurement Equipment Industry Revenue Share (%), by Country 2024 & 2032
- Figure 74: Australia and New Zealand Test and Measurement Equipment Industry Volume Share (%), by Country 2024 & 2032
- Figure 75: Latin America Test and Measurement Equipment Industry Revenue (Million), by Type 2024 & 2032
- Figure 76: Latin America Test and Measurement Equipment Industry Volume (K Unit), by Type 2024 & 2032
- Figure 77: Latin America Test and Measurement Equipment Industry Revenue Share (%), by Type 2024 & 2032
- Figure 78: Latin America Test and Measurement Equipment Industry Volume Share (%), by Type 2024 & 2032
- Figure 79: Latin America Test and Measurement Equipment Industry Revenue (Million), by End-user Industry 2024 & 2032
- Figure 80: Latin America Test and Measurement Equipment Industry Volume (K Unit), by End-user Industry 2024 & 2032
- Figure 81: Latin America Test and Measurement Equipment Industry Revenue Share (%), by End-user Industry 2024 & 2032
- Figure 82: Latin America Test and Measurement Equipment Industry Volume Share (%), by End-user Industry 2024 & 2032
- Figure 83: Latin America Test and Measurement Equipment Industry Revenue (Million), by Country 2024 & 2032
- Figure 84: Latin America Test and Measurement Equipment Industry Volume (K Unit), by Country 2024 & 2032
- Figure 85: Latin America Test and Measurement Equipment Industry Revenue Share (%), by Country 2024 & 2032
- Figure 86: Latin America Test and Measurement Equipment Industry Volume Share (%), by Country 2024 & 2032
- Figure 87: Middle East and Africa Test and Measurement Equipment Industry Revenue (Million), by Type 2024 & 2032
- Figure 88: Middle East and Africa Test and Measurement Equipment Industry Volume (K Unit), by Type 2024 & 2032
- Figure 89: Middle East and Africa Test and Measurement Equipment Industry Revenue Share (%), by Type 2024 & 2032
- Figure 90: Middle East and Africa Test and Measurement Equipment Industry Volume Share (%), by Type 2024 & 2032
- Figure 91: Middle East and Africa Test and Measurement Equipment Industry Revenue (Million), by End-user Industry 2024 & 2032
- Figure 92: Middle East and Africa Test and Measurement Equipment Industry Volume (K Unit), by End-user Industry 2024 & 2032
- Figure 93: Middle East and Africa Test and Measurement Equipment Industry Revenue Share (%), by End-user Industry 2024 & 2032
- Figure 94: Middle East and Africa Test and Measurement Equipment Industry Volume Share (%), by End-user Industry 2024 & 2032
- Figure 95: Middle East and Africa Test and Measurement Equipment Industry Revenue (Million), by Country 2024 & 2032
- Figure 96: Middle East and Africa Test and Measurement Equipment Industry Volume (K Unit), by Country 2024 & 2032
- Figure 97: Middle East and Africa Test and Measurement Equipment Industry Revenue Share (%), by Country 2024 & 2032
- Figure 98: Middle East and Africa Test and Measurement Equipment Industry Volume Share (%), by Country 2024 & 2032
List of Tables
- Table 1: Global Test and Measurement Equipment Industry Revenue Million Forecast, by Region 2019 & 2032
- Table 2: Global Test and Measurement Equipment Industry Volume K Unit Forecast, by Region 2019 & 2032
- Table 3: Global Test and Measurement Equipment Industry Revenue Million Forecast, by Type 2019 & 2032
- Table 4: Global Test and Measurement Equipment Industry Volume K Unit Forecast, by Type 2019 & 2032
- Table 5: Global Test and Measurement Equipment Industry Revenue Million Forecast, by End-user Industry 2019 & 2032
- Table 6: Global Test and Measurement Equipment Industry Volume K Unit Forecast, by End-user Industry 2019 & 2032
- Table 7: Global Test and Measurement Equipment Industry Revenue Million Forecast, by Region 2019 & 2032
- Table 8: Global Test and Measurement Equipment Industry Volume K Unit Forecast, by Region 2019 & 2032
- Table 9: Global Test and Measurement Equipment Industry Revenue Million Forecast, by Country 2019 & 2032
- Table 10: Global Test and Measurement Equipment Industry Volume K Unit Forecast, by Country 2019 & 2032
- Table 11: United States Test and Measurement Equipment Industry Revenue (Million) Forecast, by Application 2019 & 2032
- Table 12: United States Test and Measurement Equipment Industry Volume (K Unit) Forecast, by Application 2019 & 2032
- Table 13: Canada Test and Measurement Equipment Industry Revenue (Million) Forecast, by Application 2019 & 2032
- Table 14: Canada Test and Measurement Equipment Industry Volume (K Unit) Forecast, by Application 2019 & 2032
- Table 15: Mexico Test and Measurement Equipment Industry Revenue (Million) Forecast, by Application 2019 & 2032
- Table 16: Mexico Test and Measurement Equipment Industry Volume (K Unit) Forecast, by Application 2019 & 2032
- Table 17: Global Test and Measurement Equipment Industry Revenue Million Forecast, by Country 2019 & 2032
- Table 18: Global Test and Measurement Equipment Industry Volume K Unit Forecast, by Country 2019 & 2032
- Table 19: Germany Test and Measurement Equipment Industry Revenue (Million) Forecast, by Application 2019 & 2032
- Table 20: Germany Test and Measurement Equipment Industry Volume (K Unit) Forecast, by Application 2019 & 2032
- Table 21: United Kingdom Test and Measurement Equipment Industry Revenue (Million) Forecast, by Application 2019 & 2032
- Table 22: United Kingdom Test and Measurement Equipment Industry Volume (K Unit) Forecast, by Application 2019 & 2032
- Table 23: France Test and Measurement Equipment Industry Revenue (Million) Forecast, by Application 2019 & 2032
- Table 24: France Test and Measurement Equipment Industry Volume (K Unit) Forecast, by Application 2019 & 2032
- Table 25: Spain Test and Measurement Equipment Industry Revenue (Million) Forecast, by Application 2019 & 2032
- Table 26: Spain Test and Measurement Equipment Industry Volume (K Unit) Forecast, by Application 2019 & 2032
- Table 27: Italy Test and Measurement Equipment Industry Revenue (Million) Forecast, by Application 2019 & 2032
- Table 28: Italy Test and Measurement Equipment Industry Volume (K Unit) Forecast, by Application 2019 & 2032
- Table 29: Spain Test and Measurement Equipment Industry Revenue (Million) Forecast, by Application 2019 & 2032
- Table 30: Spain Test and Measurement Equipment Industry Volume (K Unit) Forecast, by Application 2019 & 2032
- Table 31: Belgium Test and Measurement Equipment Industry Revenue (Million) Forecast, by Application 2019 & 2032
- Table 32: Belgium Test and Measurement Equipment Industry Volume (K Unit) Forecast, by Application 2019 & 2032
- Table 33: Netherland Test and Measurement Equipment Industry Revenue (Million) Forecast, by Application 2019 & 2032
- Table 34: Netherland Test and Measurement Equipment Industry Volume (K Unit) Forecast, by Application 2019 & 2032
- Table 35: Nordics Test and Measurement Equipment Industry Revenue (Million) Forecast, by Application 2019 & 2032
- Table 36: Nordics Test and Measurement Equipment Industry Volume (K Unit) Forecast, by Application 2019 & 2032
- Table 37: Rest of Europe Test and Measurement Equipment Industry Revenue (Million) Forecast, by Application 2019 & 2032
- Table 38: Rest of Europe Test and Measurement Equipment Industry Volume (K Unit) Forecast, by Application 2019 & 2032
- Table 39: Global Test and Measurement Equipment Industry Revenue Million Forecast, by Country 2019 & 2032
- Table 40: Global Test and Measurement Equipment Industry Volume K Unit Forecast, by Country 2019 & 2032
- Table 41: China Test and Measurement Equipment Industry Revenue (Million) Forecast, by Application 2019 & 2032
- Table 42: China Test and Measurement Equipment Industry Volume (K Unit) Forecast, by Application 2019 & 2032
- Table 43: Japan Test and Measurement Equipment Industry Revenue (Million) Forecast, by Application 2019 & 2032
- Table 44: Japan Test and Measurement Equipment Industry Volume (K Unit) Forecast, by Application 2019 & 2032
- Table 45: India Test and Measurement Equipment Industry Revenue (Million) Forecast, by Application 2019 & 2032
- Table 46: India Test and Measurement Equipment Industry Volume (K Unit) Forecast, by Application 2019 & 2032
- Table 47: South Korea Test and Measurement Equipment Industry Revenue (Million) Forecast, by Application 2019 & 2032
- Table 48: South Korea Test and Measurement Equipment Industry Volume (K Unit) Forecast, by Application 2019 & 2032
- Table 49: Southeast Asia Test and Measurement Equipment Industry Revenue (Million) Forecast, by Application 2019 & 2032
- Table 50: Southeast Asia Test and Measurement Equipment Industry Volume (K Unit) Forecast, by Application 2019 & 2032
- Table 51: Australia Test and Measurement Equipment Industry Revenue (Million) Forecast, by Application 2019 & 2032
- Table 52: Australia Test and Measurement Equipment Industry Volume (K Unit) Forecast, by Application 2019 & 2032
- Table 53: Indonesia Test and Measurement Equipment Industry Revenue (Million) Forecast, by Application 2019 & 2032
- Table 54: Indonesia Test and Measurement Equipment Industry Volume (K Unit) Forecast, by Application 2019 & 2032
- Table 55: Phillipes Test and Measurement Equipment Industry Revenue (Million) Forecast, by Application 2019 & 2032
- Table 56: Phillipes Test and Measurement Equipment Industry Volume (K Unit) Forecast, by Application 2019 & 2032
- Table 57: Singapore Test and Measurement Equipment Industry Revenue (Million) Forecast, by Application 2019 & 2032
- Table 58: Singapore Test and Measurement Equipment Industry Volume (K Unit) Forecast, by Application 2019 & 2032
- Table 59: Thailandc Test and Measurement Equipment Industry Revenue (Million) Forecast, by Application 2019 & 2032
- Table 60: Thailandc Test and Measurement Equipment Industry Volume (K Unit) Forecast, by Application 2019 & 2032
- Table 61: Rest of Asia Pacific Test and Measurement Equipment Industry Revenue (Million) Forecast, by Application 2019 & 2032
- Table 62: Rest of Asia Pacific Test and Measurement Equipment Industry Volume (K Unit) Forecast, by Application 2019 & 2032
- Table 63: Global Test and Measurement Equipment Industry Revenue Million Forecast, by Country 2019 & 2032
- Table 64: Global Test and Measurement Equipment Industry Volume K Unit Forecast, by Country 2019 & 2032
- Table 65: Brazil Test and Measurement Equipment Industry Revenue (Million) Forecast, by Application 2019 & 2032
- Table 66: Brazil Test and Measurement Equipment Industry Volume (K Unit) Forecast, by Application 2019 & 2032
- Table 67: Argentina Test and Measurement Equipment Industry Revenue (Million) Forecast, by Application 2019 & 2032
- Table 68: Argentina Test and Measurement Equipment Industry Volume (K Unit) Forecast, by Application 2019 & 2032
- Table 69: Peru Test and Measurement Equipment Industry Revenue (Million) Forecast, by Application 2019 & 2032
- Table 70: Peru Test and Measurement Equipment Industry Volume (K Unit) Forecast, by Application 2019 & 2032
- Table 71: Chile Test and Measurement Equipment Industry Revenue (Million) Forecast, by Application 2019 & 2032
- Table 72: Chile Test and Measurement Equipment Industry Volume (K Unit) Forecast, by Application 2019 & 2032
- Table 73: Colombia Test and Measurement Equipment Industry Revenue (Million) Forecast, by Application 2019 & 2032
- Table 74: Colombia Test and Measurement Equipment Industry Volume (K Unit) Forecast, by Application 2019 & 2032
- Table 75: Ecuador Test and Measurement Equipment Industry Revenue (Million) Forecast, by Application 2019 & 2032
- Table 76: Ecuador Test and Measurement Equipment Industry Volume (K Unit) Forecast, by Application 2019 & 2032
- Table 77: Venezuela Test and Measurement Equipment Industry Revenue (Million) Forecast, by Application 2019 & 2032
- Table 78: Venezuela Test and Measurement Equipment Industry Volume (K Unit) Forecast, by Application 2019 & 2032
- Table 79: Rest of South America Test and Measurement Equipment Industry Revenue (Million) Forecast, by Application 2019 & 2032
- Table 80: Rest of South America Test and Measurement Equipment Industry Volume (K Unit) Forecast, by Application 2019 & 2032
- Table 81: Global Test and Measurement Equipment Industry Revenue Million Forecast, by Country 2019 & 2032
- Table 82: Global Test and Measurement Equipment Industry Volume K Unit Forecast, by Country 2019 & 2032
- Table 83: United States Test and Measurement Equipment Industry Revenue (Million) Forecast, by Application 2019 & 2032
- Table 84: United States Test and Measurement Equipment Industry Volume (K Unit) Forecast, by Application 2019 & 2032
- Table 85: Canada Test and Measurement Equipment Industry Revenue (Million) Forecast, by Application 2019 & 2032
- Table 86: Canada Test and Measurement Equipment Industry Volume (K Unit) Forecast, by Application 2019 & 2032
- Table 87: Mexico Test and Measurement Equipment Industry Revenue (Million) Forecast, by Application 2019 & 2032
- Table 88: Mexico Test and Measurement Equipment Industry Volume (K Unit) Forecast, by Application 2019 & 2032
- Table 89: Global Test and Measurement Equipment Industry Revenue Million Forecast, by Country 2019 & 2032
- Table 90: Global Test and Measurement Equipment Industry Volume K Unit Forecast, by Country 2019 & 2032
- Table 91: United Arab Emirates Test and Measurement Equipment Industry Revenue (Million) Forecast, by Application 2019 & 2032
- Table 92: United Arab Emirates Test and Measurement Equipment Industry Volume (K Unit) Forecast, by Application 2019 & 2032
- Table 93: Saudi Arabia Test and Measurement Equipment Industry Revenue (Million) Forecast, by Application 2019 & 2032
- Table 94: Saudi Arabia Test and Measurement Equipment Industry Volume (K Unit) Forecast, by Application 2019 & 2032
- Table 95: South Africa Test and Measurement Equipment Industry Revenue (Million) Forecast, by Application 2019 & 2032
- Table 96: South Africa Test and Measurement Equipment Industry Volume (K Unit) Forecast, by Application 2019 & 2032
- Table 97: Rest of Middle East and Africa Test and Measurement Equipment Industry Revenue (Million) Forecast, by Application 2019 & 2032
- Table 98: Rest of Middle East and Africa Test and Measurement Equipment Industry Volume (K Unit) Forecast, by Application 2019 & 2032
- Table 99: Global Test and Measurement Equipment Industry Revenue Million Forecast, by Type 2019 & 2032
- Table 100: Global Test and Measurement Equipment Industry Volume K Unit Forecast, by Type 2019 & 2032
- Table 101: Global Test and Measurement Equipment Industry Revenue Million Forecast, by End-user Industry 2019 & 2032
- Table 102: Global Test and Measurement Equipment Industry Volume K Unit Forecast, by End-user Industry 2019 & 2032
- Table 103: Global Test and Measurement Equipment Industry Revenue Million Forecast, by Country 2019 & 2032
- Table 104: Global Test and Measurement Equipment Industry Volume K Unit Forecast, by Country 2019 & 2032
- Table 105: Global Test and Measurement Equipment Industry Revenue Million Forecast, by Type 2019 & 2032
- Table 106: Global Test and Measurement Equipment Industry Volume K Unit Forecast, by Type 2019 & 2032
- Table 107: Global Test and Measurement Equipment Industry Revenue Million Forecast, by End-user Industry 2019 & 2032
- Table 108: Global Test and Measurement Equipment Industry Volume K Unit Forecast, by End-user Industry 2019 & 2032
- Table 109: Global Test and Measurement Equipment Industry Revenue Million Forecast, by Country 2019 & 2032
- Table 110: Global Test and Measurement Equipment Industry Volume K Unit Forecast, by Country 2019 & 2032
- Table 111: Global Test and Measurement Equipment Industry Revenue Million Forecast, by Type 2019 & 2032
- Table 112: Global Test and Measurement Equipment Industry Volume K Unit Forecast, by Type 2019 & 2032
- Table 113: Global Test and Measurement Equipment Industry Revenue Million Forecast, by End-user Industry 2019 & 2032
- Table 114: Global Test and Measurement Equipment Industry Volume K Unit Forecast, by End-user Industry 2019 & 2032
- Table 115: Global Test and Measurement Equipment Industry Revenue Million Forecast, by Country 2019 & 2032
- Table 116: Global Test and Measurement Equipment Industry Volume K Unit Forecast, by Country 2019 & 2032
- Table 117: Global Test and Measurement Equipment Industry Revenue Million Forecast, by Type 2019 & 2032
- Table 118: Global Test and Measurement Equipment Industry Volume K Unit Forecast, by Type 2019 & 2032
- Table 119: Global Test and Measurement Equipment Industry Revenue Million Forecast, by End-user Industry 2019 & 2032
- Table 120: Global Test and Measurement Equipment Industry Volume K Unit Forecast, by End-user Industry 2019 & 2032
- Table 121: Global Test and Measurement Equipment Industry Revenue Million Forecast, by Country 2019 & 2032
- Table 122: Global Test and Measurement Equipment Industry Volume K Unit Forecast, by Country 2019 & 2032
- Table 123: Global Test and Measurement Equipment Industry Revenue Million Forecast, by Type 2019 & 2032
- Table 124: Global Test and Measurement Equipment Industry Volume K Unit Forecast, by Type 2019 & 2032
- Table 125: Global Test and Measurement Equipment Industry Revenue Million Forecast, by End-user Industry 2019 & 2032
- Table 126: Global Test and Measurement Equipment Industry Volume K Unit Forecast, by End-user Industry 2019 & 2032
- Table 127: Global Test and Measurement Equipment Industry Revenue Million Forecast, by Country 2019 & 2032
- Table 128: Global Test and Measurement Equipment Industry Volume K Unit Forecast, by Country 2019 & 2032
- Table 129: Global Test and Measurement Equipment Industry Revenue Million Forecast, by Type 2019 & 2032
- Table 130: Global Test and Measurement Equipment Industry Volume K Unit Forecast, by Type 2019 & 2032
- Table 131: Global Test and Measurement Equipment Industry Revenue Million Forecast, by End-user Industry 2019 & 2032
- Table 132: Global Test and Measurement Equipment Industry Volume K Unit Forecast, by End-user Industry 2019 & 2032
- Table 133: Global Test and Measurement Equipment Industry Revenue Million Forecast, by Country 2019 & 2032
- Table 134: Global Test and Measurement Equipment Industry Volume K Unit Forecast, by Country 2019 & 2032
Frequently Asked Questions
1. What is the projected Compound Annual Growth Rate (CAGR) of the Test and Measurement Equipment Industry?
The projected CAGR is approximately 4.29%.
2. Which companies are prominent players in the Test and Measurement Equipment Industry?
Key companies in the market include Rohde & Schwarz GmbH & Co KG, Anritsu Corporation, Teradyne Inc, National Instruments Corporation, Yokogawa Test & Measurement Corporation (Yokogawa Electric Corporation), Advantest Corporatio, Chauvin Arnoux Group, Fortive Corporation, Teledyne Lecroy (Teledyne Technologies Incorporated), Keysight Technologies Inc.
3. What are the main segments of the Test and Measurement Equipment Industry?
The market segments include Type, End-user Industry.
4. Can you provide details about the market size?
The market size is estimated to be USD 15.02 Million as of 2022.
5. What are some drivers contributing to market growth?
Technological Advancements Leading to the need for Test and Measurement Equipment; Emerging Trend of Electric and Hybrid Vehicle.
6. What are the notable trends driving market growth?
Semiconductors and Computing to be the Largest End-user Industry.
7. Are there any restraints impacting market growth?
Difficulty in Integrating Firewalls with Existing Network Infrastructure; Complexity of Deploying and Managing Firewalls due to Limited Expertise.
8. Can you provide examples of recent developments in the market?
July 2023: Teradyne Unveils Archimedes Analytics Solution officially launched the Teradyne Archimedes Analytics Solution, a groundbreaking open architecture that introduces real-time analytics into semiconductor testing. This innovation streamlines test processes, enhances yield rates, and reduces costs, all while mitigating security concerns associated with cloud-based alternatives. With the semiconductor industry witnessing a growing demand for high-quality devices employing advanced processes, comprehensive test and analytics solutions have become indispensable.
9. What pricing options are available for accessing the report?
Pricing options include single-user, multi-user, and enterprise licenses priced at USD 4750, USD 5250, and USD 8750 respectively.
10. Is the market size provided in terms of value or volume?
The market size is provided in terms of value, measured in Million and volume, measured in K Unit.
11. Are there any specific market keywords associated with the report?
Yes, the market keyword associated with the report is "Test and Measurement Equipment Industry," which aids in identifying and referencing the specific market segment covered.
12. How do I determine which pricing option suits my needs best?
The pricing options vary based on user requirements and access needs. Individual users may opt for single-user licenses, while businesses requiring broader access may choose multi-user or enterprise licenses for cost-effective access to the report.
13. Are there any additional resources or data provided in the Test and Measurement Equipment Industry report?
While the report offers comprehensive insights, it's advisable to review the specific contents or supplementary materials provided to ascertain if additional resources or data are available.
14. How can I stay updated on further developments or reports in the Test and Measurement Equipment Industry?
To stay informed about further developments, trends, and reports in the Test and Measurement Equipment Industry, consider subscribing to industry newsletters, following relevant companies and organizations, or regularly checking reputable industry news sources and publications.
Methodology
Step 1 - Identification of Relevant Samples Size from Population Database


Step 2 - Approaches for Defining Global Market Size (Value, Volume* & Price*)

Note*: In applicable scenarios
Step 3 - Data Sources
Primary Research
- Web Analytics
- Survey Reports
- Research Institute
- Latest Research Reports
- Opinion Leaders
Secondary Research
- Annual Reports
- White Paper
- Latest Press Release
- Industry Association
- Paid Database
- Investor Presentations

Step 4 - Data Triangulation
Involves using different sources of information in order to increase the validity of a study
These sources are likely to be stakeholders in a program - participants, other researchers, program staff, other community members, and so on.
Then we put all data in single framework & apply various statistical tools to find out the dynamic on the market.
During the analysis stage, feedback from the stakeholder groups would be compared to determine areas of agreement as well as areas of divergence


