
Key Insights
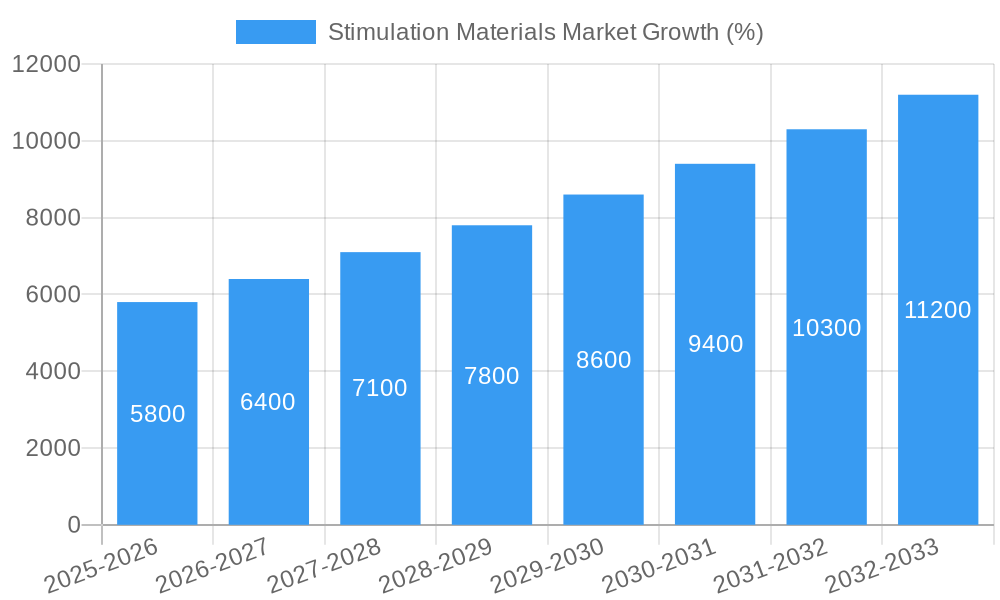
The global Stimulation Materials market, valued at $59.6 billion in 2025, is projected to experience robust growth, driven by a Compound Annual Growth Rate (CAGR) of 9.8% from 2025 to 2033. This expansion is fueled by several key factors. The increasing demand for oil and natural gas, coupled with the ongoing exploration and development of unconventional hydrocarbon resources like shale gas and tight oil, necessitates the widespread use of stimulation materials for enhanced reservoir productivity. Hydraulic fracturing, a crucial technique in unconventional resource extraction, relies heavily on proppants and other stimulation materials, thereby directly driving market growth. Technological advancements, such as the development of high-strength proppants and more efficient chemical additives, further enhance the effectiveness of stimulation treatments and contribute to the market's expansion. The shift toward environmentally friendly and sustainable stimulation techniques also presents opportunities for innovation and growth within the market. Growth is expected to be particularly strong in regions with significant unconventional resource reserves, such as North America and Asia-Pacific.
However, the market also faces certain restraints. Fluctuations in oil and gas prices directly impact exploration and production activities, leading to variable demand for stimulation materials. Regulatory changes and environmental concerns surrounding hydraulic fracturing can also affect market growth, necessitating the adoption of sustainable practices and stricter operational guidelines. Competition among various material types, such as ceramic and resin-coated proppants, influences pricing and market share dynamics. Despite these challenges, the long-term outlook for the Stimulation Materials market remains positive, given the continued reliance on unconventional resources and ongoing technological advancements in the industry. The increasing adoption of digitalization and data analytics in reservoir management will contribute to more efficient stimulation treatments and further boost market growth. Diversification within the material types, along with expansion into new geographical regions with untapped resources, also positions the market for sustained growth over the forecast period.
This comprehensive report provides an in-depth analysis of the Stimulation Materials Market, encompassing market dynamics, growth trends, regional insights, product landscapes, and key players. The study period covers 2019-2033, with 2025 as the base and estimated year, and a forecast period of 2025-2033. The report segments the market by Material Type (Proppants, Ceramic, Chemical) and analyzes the parent market of Oil and Gas Services and the child market of Hydraulic Fracturing. The market size is valued in Billion units.

Stimulation Materials Market Dynamics & Structure
The Stimulation Materials Market is characterized by a moderately concentrated structure with several major players holding significant market share. Technological innovation, particularly in proppant design and chemical formulations, is a key driver, while regulatory frameworks concerning environmental impact and safety play a crucial role. Competitive substitutes, such as alternative stimulation techniques, pose a challenge. The market exhibits diverse end-user demographics, primarily oil and gas companies, and demonstrates a moderate level of M&A activity. The historical period (2019-2024) saw approximately xx M&A deals, with an average deal size of xx Billion.
- Market Concentration: The top 5 players hold approximately xx% of the market share in 2025.
- Technological Innovation: Focus on developing high-strength proppants and environmentally friendly chemicals.
- Regulatory Framework: Stringent environmental regulations impact material selection and disposal methods.
- Competitive Substitutes: Alternative stimulation techniques, such as water-based fracturing, compete for market share.
- End-User Demographics: Primarily oil and gas exploration and production companies.
- M&A Trends: Consolidation among proppant producers and chemical suppliers is expected to continue. Innovation barriers include high R&D costs and lengthy regulatory approval processes.
Stimulation Materials Market Growth Trends & Insights
The Stimulation Materials Market experienced robust growth during the historical period (2019-2024), driven by increasing oil and gas exploration and production activities globally. The market size reached xx Billion in 2024 and is projected to reach xx Billion by 2033, exhibiting a CAGR of xx% during the forecast period (2025-2033). This growth is attributed to the rising demand for shale gas and tight oil extraction, along with technological advancements leading to higher efficiency and cost reduction in hydraulic fracturing operations. The adoption rate of advanced proppants and chemicals is increasing, indicating a shift towards more efficient and sustainable solutions. Consumer behavior is driven by a preference for high-performance materials with lower environmental impact.
Dominant Regions, Countries, or Segments in Stimulation Materials Market
North America (particularly the United States) currently dominates the Stimulation Materials Market, owing to its extensive shale gas reserves and established hydraulic fracturing industry. The region's well-developed infrastructure and supportive government policies contribute significantly to its leading position. Within the segment breakdown, proppants hold the largest market share, followed by ceramic and chemical proppants.
- Key Drivers in North America:
- Abundant shale gas reserves
- Established hydraulic fracturing industry
- Supportive government policies
- Well-developed infrastructure
- Dominance Factors:
- High demand for hydraulic fracturing services
- Early adoption of advanced proppant and chemical technologies
- Favorable regulatory environment
- Growth Potential: Continued growth is expected due to ongoing exploration and production activities, although growth rates are projected to moderate compared to previous periods.
Stimulation Materials Market Product Landscape
The Stimulation Materials Market features a diverse product landscape, with continuous innovation driving the development of higher-performance proppants and chemicals. Proppants are categorized by material type (e.g., sand, ceramic), while chemicals are classified by their function (e.g., friction reducers, breakers). Key advancements include the development of high-strength, resin-coated proppants, and environmentally friendly fracturing fluids that minimize water usage and environmental impact. Unique selling propositions often center around improved proppant conductivity, enhanced fracture conductivity, and reduced environmental footprint.
Key Drivers, Barriers & Challenges in Stimulation Materials Market
Key Drivers: The primary drivers include the increasing demand for shale gas and tight oil, technological advancements leading to improved efficiency and cost-effectiveness in hydraulic fracturing, and government support for domestic energy production.
Key Challenges and Restraints: Fluctuations in oil and gas prices significantly impact market demand. Environmental concerns and stringent regulations impose constraints on material selection and disposal methods. Competition among established players and the emergence of new entrants create pricing pressures and affect profit margins. Supply chain disruptions caused by geopolitical factors or natural disasters can lead to material shortages and price increases, impacting the market. These factors, especially price volatility and regulatory hurdles, can reduce profitability and increase market uncertainty.
Emerging Opportunities in Stimulation Materials Market
Emerging opportunities lie in the development of sustainable and environmentally friendly stimulation materials, including biodegradable fracturing fluids and recycled proppants. Expanding into untapped markets, particularly in developing regions with significant unconventional hydrocarbon resources, presents significant potential. The rising focus on carbon capture and storage technologies also offers opportunities for innovative material solutions.
Growth Accelerators in the Stimulation Materials Market Industry
Long-term growth is propelled by several factors, including ongoing technological advancements in proppant and chemical formulations, strategic partnerships between material suppliers and oilfield service companies, and market expansion into new geographical regions. The increasing adoption of digital technologies for optimizing hydraulic fracturing operations also contributes to market expansion.
Key Players Shaping the Stimulation Materials Market Market
- Mineracao Curimbaba Ltda
- Ecolab
- Chevron Phillips Chemicals Company
- Solvay
- All Energy Sand
- Baker Hughes
- Imerys
- CoorsTek Inc
- Baltic Ceramics Investments S A
- Weatherford International plc
- Saint-Gobain (Saint-Gobain Proppants)
- Halliburton
- Royal Dutch Shell PLC
- Carbo Ceramics Inc
- Hi-Crush Inc
- Badger Mining Corporation
- Schlumberger Limited
- Unimin Corporation
- Hexion Inc
Notable Milestones in Stimulation Materials Market Sector
- 2020-Q4: Introduction of a new generation of high-strength ceramic proppants by Company X.
- 2021-Q2: Merger between two major proppant producers, resulting in increased market concentration.
- 2022-Q3: Launch of an environmentally friendly fracturing fluid by Company Y.
- 2023-Q1: Significant investment in R&D for developing sustainable proppants by Company Z. (Note: Replace Company X, Y, Z with actual company names and details as available).
In-Depth Stimulation Materials Market Outlook
The Stimulation Materials Market is poised for continued growth, driven by sustained demand for unconventional hydrocarbon extraction, technological innovations leading to improved efficiency and sustainability, and strategic partnerships among industry players. Opportunities exist in developing advanced proppant and chemical formulations, expanding into new markets, and leveraging digital technologies for optimizing hydraulic fracturing operations. The market’s future success hinges on navigating environmental concerns, managing price volatility, and adapting to changing regulatory landscapes.
Stimulation Materials Market Segmentation
-
1. Material Type
-
1.1. Proppants
- 1.1.1. Frac Sand
- 1.1.2. Resin Coated
- 1.1.3. Ceramic
-
1.2. Chemical
- 1.2.1. Surfactants
- 1.2.2. Gelling Agents
- 1.2.3. Friction Reducers
- 1.2.4. Breakers
- 1.2.5. Crosslinking Agents
- 1.2.6. Corrosion and Scale Inhibitors
- 1.2.7. Biocides
- 1.2.8. Other Chemicals
-
1.1. Proppants
Stimulation Materials Market Segmentation By Geography
-
1. Asia Pacific
- 1.1. China
- 1.2. India
- 1.3. Japan
- 1.4. South Korea
- 1.5. Rest of Asia Pacific
-
2. North America
- 2.1. United States
- 2.2. Canada
- 2.3. Mexico
-
3. Europe
- 3.1. Germany
- 3.2. United Kingdom
- 3.3. France
- 3.4. Italy
- 3.5. Rest of Europe
-
4. South America
- 4.1. Brazil
- 4.2. Argentina
- 4.3. Rest of South America
- 5. Middle East
-
6. Saudi Arabia
- 6.1. South Africa
- 6.2. Rest of Middle East

Stimulation Materials Market REPORT HIGHLIGHTS
| Aspects | Details |
|---|---|
| Study Period | 2019-2033 |
| Base Year | 2024 |
| Estimated Year | 2025 |
| Forecast Period | 2025-2033 |
| Historical Period | 2019-2024 |
| Growth Rate | CAGR of 9.8% from 2019-2033 |
| Segmentation |
|
Table of Contents
- 1. Introduction
- 1.1. Research Scope
- 1.2. Market Segmentation
- 1.3. Research Methodology
- 1.4. Definitions and Assumptions
- 2. Executive Summary
- 2.1. Introduction
- 3. Market Dynamics
- 3.1. Introduction
- 3.2. Market Drivers
- 3.2.1. ; Development of Unconventional Gas Resources; Increase in Mature Oilfields
- 3.3. Market Restrains
- 3.3.1. ; Environmental and Regulation Challenges
- 3.4. Market Trends
- 3.4.1. Proppants Segment to Dominate the Market Demand
- 4. Market Factor Analysis
- 4.1. Porters Five Forces
- 4.2. Supply/Value Chain
- 4.3. PESTEL analysis
- 4.4. Market Entropy
- 4.5. Patent/Trademark Analysis
- 5. Global Stimulation Materials Market Analysis, Insights and Forecast, 2019-2031
- 5.1. Market Analysis, Insights and Forecast - by Material Type
- 5.1.1. Proppants
- 5.1.1.1. Frac Sand
- 5.1.1.2. Resin Coated
- 5.1.1.3. Ceramic
- 5.1.2. Chemical
- 5.1.2.1. Surfactants
- 5.1.2.2. Gelling Agents
- 5.1.2.3. Friction Reducers
- 5.1.2.4. Breakers
- 5.1.2.5. Crosslinking Agents
- 5.1.2.6. Corrosion and Scale Inhibitors
- 5.1.2.7. Biocides
- 5.1.2.8. Other Chemicals
- 5.1.1. Proppants
- 5.2. Market Analysis, Insights and Forecast - by Region
- 5.2.1. Asia Pacific
- 5.2.2. North America
- 5.2.3. Europe
- 5.2.4. South America
- 5.2.5. Middle East
- 5.2.6. Saudi Arabia
- 5.1. Market Analysis, Insights and Forecast - by Material Type
- 6. Asia Pacific Stimulation Materials Market Analysis, Insights and Forecast, 2019-2031
- 6.1. Market Analysis, Insights and Forecast - by Material Type
- 6.1.1. Proppants
- 6.1.1.1. Frac Sand
- 6.1.1.2. Resin Coated
- 6.1.1.3. Ceramic
- 6.1.2. Chemical
- 6.1.2.1. Surfactants
- 6.1.2.2. Gelling Agents
- 6.1.2.3. Friction Reducers
- 6.1.2.4. Breakers
- 6.1.2.5. Crosslinking Agents
- 6.1.2.6. Corrosion and Scale Inhibitors
- 6.1.2.7. Biocides
- 6.1.2.8. Other Chemicals
- 6.1.1. Proppants
- 6.1. Market Analysis, Insights and Forecast - by Material Type
- 7. North America Stimulation Materials Market Analysis, Insights and Forecast, 2019-2031
- 7.1. Market Analysis, Insights and Forecast - by Material Type
- 7.1.1. Proppants
- 7.1.1.1. Frac Sand
- 7.1.1.2. Resin Coated
- 7.1.1.3. Ceramic
- 7.1.2. Chemical
- 7.1.2.1. Surfactants
- 7.1.2.2. Gelling Agents
- 7.1.2.3. Friction Reducers
- 7.1.2.4. Breakers
- 7.1.2.5. Crosslinking Agents
- 7.1.2.6. Corrosion and Scale Inhibitors
- 7.1.2.7. Biocides
- 7.1.2.8. Other Chemicals
- 7.1.1. Proppants
- 7.1. Market Analysis, Insights and Forecast - by Material Type
- 8. Europe Stimulation Materials Market Analysis, Insights and Forecast, 2019-2031
- 8.1. Market Analysis, Insights and Forecast - by Material Type
- 8.1.1. Proppants
- 8.1.1.1. Frac Sand
- 8.1.1.2. Resin Coated
- 8.1.1.3. Ceramic
- 8.1.2. Chemical
- 8.1.2.1. Surfactants
- 8.1.2.2. Gelling Agents
- 8.1.2.3. Friction Reducers
- 8.1.2.4. Breakers
- 8.1.2.5. Crosslinking Agents
- 8.1.2.6. Corrosion and Scale Inhibitors
- 8.1.2.7. Biocides
- 8.1.2.8. Other Chemicals
- 8.1.1. Proppants
- 8.1. Market Analysis, Insights and Forecast - by Material Type
- 9. South America Stimulation Materials Market Analysis, Insights and Forecast, 2019-2031
- 9.1. Market Analysis, Insights and Forecast - by Material Type
- 9.1.1. Proppants
- 9.1.1.1. Frac Sand
- 9.1.1.2. Resin Coated
- 9.1.1.3. Ceramic
- 9.1.2. Chemical
- 9.1.2.1. Surfactants
- 9.1.2.2. Gelling Agents
- 9.1.2.3. Friction Reducers
- 9.1.2.4. Breakers
- 9.1.2.5. Crosslinking Agents
- 9.1.2.6. Corrosion and Scale Inhibitors
- 9.1.2.7. Biocides
- 9.1.2.8. Other Chemicals
- 9.1.1. Proppants
- 9.1. Market Analysis, Insights and Forecast - by Material Type
- 10. Middle East Stimulation Materials Market Analysis, Insights and Forecast, 2019-2031
- 10.1. Market Analysis, Insights and Forecast - by Material Type
- 10.1.1. Proppants
- 10.1.1.1. Frac Sand
- 10.1.1.2. Resin Coated
- 10.1.1.3. Ceramic
- 10.1.2. Chemical
- 10.1.2.1. Surfactants
- 10.1.2.2. Gelling Agents
- 10.1.2.3. Friction Reducers
- 10.1.2.4. Breakers
- 10.1.2.5. Crosslinking Agents
- 10.1.2.6. Corrosion and Scale Inhibitors
- 10.1.2.7. Biocides
- 10.1.2.8. Other Chemicals
- 10.1.1. Proppants
- 10.1. Market Analysis, Insights and Forecast - by Material Type
- 11. Saudi Arabia Stimulation Materials Market Analysis, Insights and Forecast, 2019-2031
- 11.1. Market Analysis, Insights and Forecast - by Material Type
- 11.1.1. Proppants
- 11.1.1.1. Frac Sand
- 11.1.1.2. Resin Coated
- 11.1.1.3. Ceramic
- 11.1.2. Chemical
- 11.1.2.1. Surfactants
- 11.1.2.2. Gelling Agents
- 11.1.2.3. Friction Reducers
- 11.1.2.4. Breakers
- 11.1.2.5. Crosslinking Agents
- 11.1.2.6. Corrosion and Scale Inhibitors
- 11.1.2.7. Biocides
- 11.1.2.8. Other Chemicals
- 11.1.1. Proppants
- 11.1. Market Analysis, Insights and Forecast - by Material Type
- 12. North America Stimulation Materials Market Analysis, Insights and Forecast, 2019-2031
- 12.1. Market Analysis, Insights and Forecast - By Country/Sub-region
- 12.1.1 United States
- 12.1.2 Canada
- 12.1.3 Mexico
- 13. Europe Stimulation Materials Market Analysis, Insights and Forecast, 2019-2031
- 13.1. Market Analysis, Insights and Forecast - By Country/Sub-region
- 13.1.1 Germany
- 13.1.2 France
- 13.1.3 Italy
- 13.1.4 United Kingdom
- 13.1.5 Netherlands
- 13.1.6 Rest of Europe
- 14. Asia Pacific Stimulation Materials Market Analysis, Insights and Forecast, 2019-2031
- 14.1. Market Analysis, Insights and Forecast - By Country/Sub-region
- 14.1.1 China
- 14.1.2 Japan
- 14.1.3 India
- 14.1.4 South Korea
- 14.1.5 Taiwan
- 14.1.6 Australia
- 14.1.7 Rest of Asia-Pacific
- 15. South America Stimulation Materials Market Analysis, Insights and Forecast, 2019-2031
- 15.1. Market Analysis, Insights and Forecast - By Country/Sub-region
- 15.1.1 Brazil
- 15.1.2 Argentina
- 15.1.3 Rest of South America
- 16. MEA Stimulation Materials Market Analysis, Insights and Forecast, 2019-2031
- 16.1. Market Analysis, Insights and Forecast - By Country/Sub-region
- 16.1.1 Middle East
- 16.1.2 Africa
- 17. Competitive Analysis
- 17.1. Global Market Share Analysis 2024
- 17.2. Company Profiles
- 17.2.1 Mineracao Curimbaba Ltda
- 17.2.1.1. Overview
- 17.2.1.2. Products
- 17.2.1.3. SWOT Analysis
- 17.2.1.4. Recent Developments
- 17.2.1.5. Financials (Based on Availability)
- 17.2.2 Ecolab
- 17.2.2.1. Overview
- 17.2.2.2. Products
- 17.2.2.3. SWOT Analysis
- 17.2.2.4. Recent Developments
- 17.2.2.5. Financials (Based on Availability)
- 17.2.3 Chevron Phillips Chemicals Company
- 17.2.3.1. Overview
- 17.2.3.2. Products
- 17.2.3.3. SWOT Analysis
- 17.2.3.4. Recent Developments
- 17.2.3.5. Financials (Based on Availability)
- 17.2.4 Solvay
- 17.2.4.1. Overview
- 17.2.4.2. Products
- 17.2.4.3. SWOT Analysis
- 17.2.4.4. Recent Developments
- 17.2.4.5. Financials (Based on Availability)
- 17.2.5 All Energy Sand
- 17.2.5.1. Overview
- 17.2.5.2. Products
- 17.2.5.3. SWOT Analysis
- 17.2.5.4. Recent Developments
- 17.2.5.5. Financials (Based on Availability)
- 17.2.6 Baker Hughes
- 17.2.6.1. Overview
- 17.2.6.2. Products
- 17.2.6.3. SWOT Analysis
- 17.2.6.4. Recent Developments
- 17.2.6.5. Financials (Based on Availability)
- 17.2.7 Imerys
- 17.2.7.1. Overview
- 17.2.7.2. Products
- 17.2.7.3. SWOT Analysis
- 17.2.7.4. Recent Developments
- 17.2.7.5. Financials (Based on Availability)
- 17.2.8 CoorsTek Inc
- 17.2.8.1. Overview
- 17.2.8.2. Products
- 17.2.8.3. SWOT Analysis
- 17.2.8.4. Recent Developments
- 17.2.8.5. Financials (Based on Availability)
- 17.2.9 Baltic Ceramics Investments S A
- 17.2.9.1. Overview
- 17.2.9.2. Products
- 17.2.9.3. SWOT Analysis
- 17.2.9.4. Recent Developments
- 17.2.9.5. Financials (Based on Availability)
- 17.2.10 Weatherford International plc
- 17.2.10.1. Overview
- 17.2.10.2. Products
- 17.2.10.3. SWOT Analysis
- 17.2.10.4. Recent Developments
- 17.2.10.5. Financials (Based on Availability)
- 17.2.11 Saint-Gobain (Saint-Gobain Proppants)
- 17.2.11.1. Overview
- 17.2.11.2. Products
- 17.2.11.3. SWOT Analysis
- 17.2.11.4. Recent Developments
- 17.2.11.5. Financials (Based on Availability)
- 17.2.12 Halliburton
- 17.2.12.1. Overview
- 17.2.12.2. Products
- 17.2.12.3. SWOT Analysis
- 17.2.12.4. Recent Developments
- 17.2.12.5. Financials (Based on Availability)
- 17.2.13 Royal Dutch Shell PLC
- 17.2.13.1. Overview
- 17.2.13.2. Products
- 17.2.13.3. SWOT Analysis
- 17.2.13.4. Recent Developments
- 17.2.13.5. Financials (Based on Availability)
- 17.2.14 Carbo Ceramics Inc
- 17.2.14.1. Overview
- 17.2.14.2. Products
- 17.2.14.3. SWOT Analysis
- 17.2.14.4. Recent Developments
- 17.2.14.5. Financials (Based on Availability)
- 17.2.15 Hi-Crush Inc
- 17.2.15.1. Overview
- 17.2.15.2. Products
- 17.2.15.3. SWOT Analysis
- 17.2.15.4. Recent Developments
- 17.2.15.5. Financials (Based on Availability)
- 17.2.16 Badger Mining Corporation
- 17.2.16.1. Overview
- 17.2.16.2. Products
- 17.2.16.3. SWOT Analysis
- 17.2.16.4. Recent Developments
- 17.2.16.5. Financials (Based on Availability)
- 17.2.17 Schlumberger Limited
- 17.2.17.1. Overview
- 17.2.17.2. Products
- 17.2.17.3. SWOT Analysis
- 17.2.17.4. Recent Developments
- 17.2.17.5. Financials (Based on Availability)
- 17.2.18 Unimin Corporation
- 17.2.18.1. Overview
- 17.2.18.2. Products
- 17.2.18.3. SWOT Analysis
- 17.2.18.4. Recent Developments
- 17.2.18.5. Financials (Based on Availability)
- 17.2.19 Hexion Inc
- 17.2.19.1. Overview
- 17.2.19.2. Products
- 17.2.19.3. SWOT Analysis
- 17.2.19.4. Recent Developments
- 17.2.19.5. Financials (Based on Availability)
- 17.2.1 Mineracao Curimbaba Ltda
List of Figures
- Figure 1: Global Stimulation Materials Market Revenue Breakdown (Billion, %) by Region 2024 & 2032
- Figure 2: Global Stimulation Materials Market Volume Breakdown (K Tons, %) by Region 2024 & 2032
- Figure 3: North America Stimulation Materials Market Revenue (Billion), by Country 2024 & 2032
- Figure 4: North America Stimulation Materials Market Volume (K Tons), by Country 2024 & 2032
- Figure 5: North America Stimulation Materials Market Revenue Share (%), by Country 2024 & 2032
- Figure 6: North America Stimulation Materials Market Volume Share (%), by Country 2024 & 2032
- Figure 7: Europe Stimulation Materials Market Revenue (Billion), by Country 2024 & 2032
- Figure 8: Europe Stimulation Materials Market Volume (K Tons), by Country 2024 & 2032
- Figure 9: Europe Stimulation Materials Market Revenue Share (%), by Country 2024 & 2032
- Figure 10: Europe Stimulation Materials Market Volume Share (%), by Country 2024 & 2032
- Figure 11: Asia Pacific Stimulation Materials Market Revenue (Billion), by Country 2024 & 2032
- Figure 12: Asia Pacific Stimulation Materials Market Volume (K Tons), by Country 2024 & 2032
- Figure 13: Asia Pacific Stimulation Materials Market Revenue Share (%), by Country 2024 & 2032
- Figure 14: Asia Pacific Stimulation Materials Market Volume Share (%), by Country 2024 & 2032
- Figure 15: South America Stimulation Materials Market Revenue (Billion), by Country 2024 & 2032
- Figure 16: South America Stimulation Materials Market Volume (K Tons), by Country 2024 & 2032
- Figure 17: South America Stimulation Materials Market Revenue Share (%), by Country 2024 & 2032
- Figure 18: South America Stimulation Materials Market Volume Share (%), by Country 2024 & 2032
- Figure 19: MEA Stimulation Materials Market Revenue (Billion), by Country 2024 & 2032
- Figure 20: MEA Stimulation Materials Market Volume (K Tons), by Country 2024 & 2032
- Figure 21: MEA Stimulation Materials Market Revenue Share (%), by Country 2024 & 2032
- Figure 22: MEA Stimulation Materials Market Volume Share (%), by Country 2024 & 2032
- Figure 23: Asia Pacific Stimulation Materials Market Revenue (Billion), by Material Type 2024 & 2032
- Figure 24: Asia Pacific Stimulation Materials Market Volume (K Tons), by Material Type 2024 & 2032
- Figure 25: Asia Pacific Stimulation Materials Market Revenue Share (%), by Material Type 2024 & 2032
- Figure 26: Asia Pacific Stimulation Materials Market Volume Share (%), by Material Type 2024 & 2032
- Figure 27: Asia Pacific Stimulation Materials Market Revenue (Billion), by Country 2024 & 2032
- Figure 28: Asia Pacific Stimulation Materials Market Volume (K Tons), by Country 2024 & 2032
- Figure 29: Asia Pacific Stimulation Materials Market Revenue Share (%), by Country 2024 & 2032
- Figure 30: Asia Pacific Stimulation Materials Market Volume Share (%), by Country 2024 & 2032
- Figure 31: North America Stimulation Materials Market Revenue (Billion), by Material Type 2024 & 2032
- Figure 32: North America Stimulation Materials Market Volume (K Tons), by Material Type 2024 & 2032
- Figure 33: North America Stimulation Materials Market Revenue Share (%), by Material Type 2024 & 2032
- Figure 34: North America Stimulation Materials Market Volume Share (%), by Material Type 2024 & 2032
- Figure 35: North America Stimulation Materials Market Revenue (Billion), by Country 2024 & 2032
- Figure 36: North America Stimulation Materials Market Volume (K Tons), by Country 2024 & 2032
- Figure 37: North America Stimulation Materials Market Revenue Share (%), by Country 2024 & 2032
- Figure 38: North America Stimulation Materials Market Volume Share (%), by Country 2024 & 2032
- Figure 39: Europe Stimulation Materials Market Revenue (Billion), by Material Type 2024 & 2032
- Figure 40: Europe Stimulation Materials Market Volume (K Tons), by Material Type 2024 & 2032
- Figure 41: Europe Stimulation Materials Market Revenue Share (%), by Material Type 2024 & 2032
- Figure 42: Europe Stimulation Materials Market Volume Share (%), by Material Type 2024 & 2032
- Figure 43: Europe Stimulation Materials Market Revenue (Billion), by Country 2024 & 2032
- Figure 44: Europe Stimulation Materials Market Volume (K Tons), by Country 2024 & 2032
- Figure 45: Europe Stimulation Materials Market Revenue Share (%), by Country 2024 & 2032
- Figure 46: Europe Stimulation Materials Market Volume Share (%), by Country 2024 & 2032
- Figure 47: South America Stimulation Materials Market Revenue (Billion), by Material Type 2024 & 2032
- Figure 48: South America Stimulation Materials Market Volume (K Tons), by Material Type 2024 & 2032
- Figure 49: South America Stimulation Materials Market Revenue Share (%), by Material Type 2024 & 2032
- Figure 50: South America Stimulation Materials Market Volume Share (%), by Material Type 2024 & 2032
- Figure 51: South America Stimulation Materials Market Revenue (Billion), by Country 2024 & 2032
- Figure 52: South America Stimulation Materials Market Volume (K Tons), by Country 2024 & 2032
- Figure 53: South America Stimulation Materials Market Revenue Share (%), by Country 2024 & 2032
- Figure 54: South America Stimulation Materials Market Volume Share (%), by Country 2024 & 2032
- Figure 55: Middle East Stimulation Materials Market Revenue (Billion), by Material Type 2024 & 2032
- Figure 56: Middle East Stimulation Materials Market Volume (K Tons), by Material Type 2024 & 2032
- Figure 57: Middle East Stimulation Materials Market Revenue Share (%), by Material Type 2024 & 2032
- Figure 58: Middle East Stimulation Materials Market Volume Share (%), by Material Type 2024 & 2032
- Figure 59: Middle East Stimulation Materials Market Revenue (Billion), by Country 2024 & 2032
- Figure 60: Middle East Stimulation Materials Market Volume (K Tons), by Country 2024 & 2032
- Figure 61: Middle East Stimulation Materials Market Revenue Share (%), by Country 2024 & 2032
- Figure 62: Middle East Stimulation Materials Market Volume Share (%), by Country 2024 & 2032
- Figure 63: Saudi Arabia Stimulation Materials Market Revenue (Billion), by Material Type 2024 & 2032
- Figure 64: Saudi Arabia Stimulation Materials Market Volume (K Tons), by Material Type 2024 & 2032
- Figure 65: Saudi Arabia Stimulation Materials Market Revenue Share (%), by Material Type 2024 & 2032
- Figure 66: Saudi Arabia Stimulation Materials Market Volume Share (%), by Material Type 2024 & 2032
- Figure 67: Saudi Arabia Stimulation Materials Market Revenue (Billion), by Country 2024 & 2032
- Figure 68: Saudi Arabia Stimulation Materials Market Volume (K Tons), by Country 2024 & 2032
- Figure 69: Saudi Arabia Stimulation Materials Market Revenue Share (%), by Country 2024 & 2032
- Figure 70: Saudi Arabia Stimulation Materials Market Volume Share (%), by Country 2024 & 2032
List of Tables
- Table 1: Global Stimulation Materials Market Revenue Billion Forecast, by Region 2019 & 2032
- Table 2: Global Stimulation Materials Market Volume K Tons Forecast, by Region 2019 & 2032
- Table 3: Global Stimulation Materials Market Revenue Billion Forecast, by Material Type 2019 & 2032
- Table 4: Global Stimulation Materials Market Volume K Tons Forecast, by Material Type 2019 & 2032
- Table 5: Global Stimulation Materials Market Revenue Billion Forecast, by Region 2019 & 2032
- Table 6: Global Stimulation Materials Market Volume K Tons Forecast, by Region 2019 & 2032
- Table 7: Global Stimulation Materials Market Revenue Billion Forecast, by Country 2019 & 2032
- Table 8: Global Stimulation Materials Market Volume K Tons Forecast, by Country 2019 & 2032
- Table 9: United States Stimulation Materials Market Revenue (Billion) Forecast, by Application 2019 & 2032
- Table 10: United States Stimulation Materials Market Volume (K Tons) Forecast, by Application 2019 & 2032
- Table 11: Canada Stimulation Materials Market Revenue (Billion) Forecast, by Application 2019 & 2032
- Table 12: Canada Stimulation Materials Market Volume (K Tons) Forecast, by Application 2019 & 2032
- Table 13: Mexico Stimulation Materials Market Revenue (Billion) Forecast, by Application 2019 & 2032
- Table 14: Mexico Stimulation Materials Market Volume (K Tons) Forecast, by Application 2019 & 2032
- Table 15: Global Stimulation Materials Market Revenue Billion Forecast, by Country 2019 & 2032
- Table 16: Global Stimulation Materials Market Volume K Tons Forecast, by Country 2019 & 2032
- Table 17: Germany Stimulation Materials Market Revenue (Billion) Forecast, by Application 2019 & 2032
- Table 18: Germany Stimulation Materials Market Volume (K Tons) Forecast, by Application 2019 & 2032
- Table 19: France Stimulation Materials Market Revenue (Billion) Forecast, by Application 2019 & 2032
- Table 20: France Stimulation Materials Market Volume (K Tons) Forecast, by Application 2019 & 2032
- Table 21: Italy Stimulation Materials Market Revenue (Billion) Forecast, by Application 2019 & 2032
- Table 22: Italy Stimulation Materials Market Volume (K Tons) Forecast, by Application 2019 & 2032
- Table 23: United Kingdom Stimulation Materials Market Revenue (Billion) Forecast, by Application 2019 & 2032
- Table 24: United Kingdom Stimulation Materials Market Volume (K Tons) Forecast, by Application 2019 & 2032
- Table 25: Netherlands Stimulation Materials Market Revenue (Billion) Forecast, by Application 2019 & 2032
- Table 26: Netherlands Stimulation Materials Market Volume (K Tons) Forecast, by Application 2019 & 2032
- Table 27: Rest of Europe Stimulation Materials Market Revenue (Billion) Forecast, by Application 2019 & 2032
- Table 28: Rest of Europe Stimulation Materials Market Volume (K Tons) Forecast, by Application 2019 & 2032
- Table 29: Global Stimulation Materials Market Revenue Billion Forecast, by Country 2019 & 2032
- Table 30: Global Stimulation Materials Market Volume K Tons Forecast, by Country 2019 & 2032
- Table 31: China Stimulation Materials Market Revenue (Billion) Forecast, by Application 2019 & 2032
- Table 32: China Stimulation Materials Market Volume (K Tons) Forecast, by Application 2019 & 2032
- Table 33: Japan Stimulation Materials Market Revenue (Billion) Forecast, by Application 2019 & 2032
- Table 34: Japan Stimulation Materials Market Volume (K Tons) Forecast, by Application 2019 & 2032
- Table 35: India Stimulation Materials Market Revenue (Billion) Forecast, by Application 2019 & 2032
- Table 36: India Stimulation Materials Market Volume (K Tons) Forecast, by Application 2019 & 2032
- Table 37: South Korea Stimulation Materials Market Revenue (Billion) Forecast, by Application 2019 & 2032
- Table 38: South Korea Stimulation Materials Market Volume (K Tons) Forecast, by Application 2019 & 2032
- Table 39: Taiwan Stimulation Materials Market Revenue (Billion) Forecast, by Application 2019 & 2032
- Table 40: Taiwan Stimulation Materials Market Volume (K Tons) Forecast, by Application 2019 & 2032
- Table 41: Australia Stimulation Materials Market Revenue (Billion) Forecast, by Application 2019 & 2032
- Table 42: Australia Stimulation Materials Market Volume (K Tons) Forecast, by Application 2019 & 2032
- Table 43: Rest of Asia-Pacific Stimulation Materials Market Revenue (Billion) Forecast, by Application 2019 & 2032
- Table 44: Rest of Asia-Pacific Stimulation Materials Market Volume (K Tons) Forecast, by Application 2019 & 2032
- Table 45: Global Stimulation Materials Market Revenue Billion Forecast, by Country 2019 & 2032
- Table 46: Global Stimulation Materials Market Volume K Tons Forecast, by Country 2019 & 2032
- Table 47: Brazil Stimulation Materials Market Revenue (Billion) Forecast, by Application 2019 & 2032
- Table 48: Brazil Stimulation Materials Market Volume (K Tons) Forecast, by Application 2019 & 2032
- Table 49: Argentina Stimulation Materials Market Revenue (Billion) Forecast, by Application 2019 & 2032
- Table 50: Argentina Stimulation Materials Market Volume (K Tons) Forecast, by Application 2019 & 2032
- Table 51: Rest of South America Stimulation Materials Market Revenue (Billion) Forecast, by Application 2019 & 2032
- Table 52: Rest of South America Stimulation Materials Market Volume (K Tons) Forecast, by Application 2019 & 2032
- Table 53: Global Stimulation Materials Market Revenue Billion Forecast, by Country 2019 & 2032
- Table 54: Global Stimulation Materials Market Volume K Tons Forecast, by Country 2019 & 2032
- Table 55: Middle East Stimulation Materials Market Revenue (Billion) Forecast, by Application 2019 & 2032
- Table 56: Middle East Stimulation Materials Market Volume (K Tons) Forecast, by Application 2019 & 2032
- Table 57: Africa Stimulation Materials Market Revenue (Billion) Forecast, by Application 2019 & 2032
- Table 58: Africa Stimulation Materials Market Volume (K Tons) Forecast, by Application 2019 & 2032
- Table 59: Global Stimulation Materials Market Revenue Billion Forecast, by Material Type 2019 & 2032
- Table 60: Global Stimulation Materials Market Volume K Tons Forecast, by Material Type 2019 & 2032
- Table 61: Global Stimulation Materials Market Revenue Billion Forecast, by Country 2019 & 2032
- Table 62: Global Stimulation Materials Market Volume K Tons Forecast, by Country 2019 & 2032
- Table 63: China Stimulation Materials Market Revenue (Billion) Forecast, by Application 2019 & 2032
- Table 64: China Stimulation Materials Market Volume (K Tons) Forecast, by Application 2019 & 2032
- Table 65: India Stimulation Materials Market Revenue (Billion) Forecast, by Application 2019 & 2032
- Table 66: India Stimulation Materials Market Volume (K Tons) Forecast, by Application 2019 & 2032
- Table 67: Japan Stimulation Materials Market Revenue (Billion) Forecast, by Application 2019 & 2032
- Table 68: Japan Stimulation Materials Market Volume (K Tons) Forecast, by Application 2019 & 2032
- Table 69: South Korea Stimulation Materials Market Revenue (Billion) Forecast, by Application 2019 & 2032
- Table 70: South Korea Stimulation Materials Market Volume (K Tons) Forecast, by Application 2019 & 2032
- Table 71: Rest of Asia Pacific Stimulation Materials Market Revenue (Billion) Forecast, by Application 2019 & 2032
- Table 72: Rest of Asia Pacific Stimulation Materials Market Volume (K Tons) Forecast, by Application 2019 & 2032
- Table 73: Global Stimulation Materials Market Revenue Billion Forecast, by Material Type 2019 & 2032
- Table 74: Global Stimulation Materials Market Volume K Tons Forecast, by Material Type 2019 & 2032
- Table 75: Global Stimulation Materials Market Revenue Billion Forecast, by Country 2019 & 2032
- Table 76: Global Stimulation Materials Market Volume K Tons Forecast, by Country 2019 & 2032
- Table 77: United States Stimulation Materials Market Revenue (Billion) Forecast, by Application 2019 & 2032
- Table 78: United States Stimulation Materials Market Volume (K Tons) Forecast, by Application 2019 & 2032
- Table 79: Canada Stimulation Materials Market Revenue (Billion) Forecast, by Application 2019 & 2032
- Table 80: Canada Stimulation Materials Market Volume (K Tons) Forecast, by Application 2019 & 2032
- Table 81: Mexico Stimulation Materials Market Revenue (Billion) Forecast, by Application 2019 & 2032
- Table 82: Mexico Stimulation Materials Market Volume (K Tons) Forecast, by Application 2019 & 2032
- Table 83: Global Stimulation Materials Market Revenue Billion Forecast, by Material Type 2019 & 2032
- Table 84: Global Stimulation Materials Market Volume K Tons Forecast, by Material Type 2019 & 2032
- Table 85: Global Stimulation Materials Market Revenue Billion Forecast, by Country 2019 & 2032
- Table 86: Global Stimulation Materials Market Volume K Tons Forecast, by Country 2019 & 2032
- Table 87: Germany Stimulation Materials Market Revenue (Billion) Forecast, by Application 2019 & 2032
- Table 88: Germany Stimulation Materials Market Volume (K Tons) Forecast, by Application 2019 & 2032
- Table 89: United Kingdom Stimulation Materials Market Revenue (Billion) Forecast, by Application 2019 & 2032
- Table 90: United Kingdom Stimulation Materials Market Volume (K Tons) Forecast, by Application 2019 & 2032
- Table 91: France Stimulation Materials Market Revenue (Billion) Forecast, by Application 2019 & 2032
- Table 92: France Stimulation Materials Market Volume (K Tons) Forecast, by Application 2019 & 2032
- Table 93: Italy Stimulation Materials Market Revenue (Billion) Forecast, by Application 2019 & 2032
- Table 94: Italy Stimulation Materials Market Volume (K Tons) Forecast, by Application 2019 & 2032
- Table 95: Rest of Europe Stimulation Materials Market Revenue (Billion) Forecast, by Application 2019 & 2032
- Table 96: Rest of Europe Stimulation Materials Market Volume (K Tons) Forecast, by Application 2019 & 2032
- Table 97: Global Stimulation Materials Market Revenue Billion Forecast, by Material Type 2019 & 2032
- Table 98: Global Stimulation Materials Market Volume K Tons Forecast, by Material Type 2019 & 2032
- Table 99: Global Stimulation Materials Market Revenue Billion Forecast, by Country 2019 & 2032
- Table 100: Global Stimulation Materials Market Volume K Tons Forecast, by Country 2019 & 2032
- Table 101: Brazil Stimulation Materials Market Revenue (Billion) Forecast, by Application 2019 & 2032
- Table 102: Brazil Stimulation Materials Market Volume (K Tons) Forecast, by Application 2019 & 2032
- Table 103: Argentina Stimulation Materials Market Revenue (Billion) Forecast, by Application 2019 & 2032
- Table 104: Argentina Stimulation Materials Market Volume (K Tons) Forecast, by Application 2019 & 2032
- Table 105: Rest of South America Stimulation Materials Market Revenue (Billion) Forecast, by Application 2019 & 2032
- Table 106: Rest of South America Stimulation Materials Market Volume (K Tons) Forecast, by Application 2019 & 2032
- Table 107: Global Stimulation Materials Market Revenue Billion Forecast, by Material Type 2019 & 2032
- Table 108: Global Stimulation Materials Market Volume K Tons Forecast, by Material Type 2019 & 2032
- Table 109: Global Stimulation Materials Market Revenue Billion Forecast, by Country 2019 & 2032
- Table 110: Global Stimulation Materials Market Volume K Tons Forecast, by Country 2019 & 2032
- Table 111: Global Stimulation Materials Market Revenue Billion Forecast, by Material Type 2019 & 2032
- Table 112: Global Stimulation Materials Market Volume K Tons Forecast, by Material Type 2019 & 2032
- Table 113: Global Stimulation Materials Market Revenue Billion Forecast, by Country 2019 & 2032
- Table 114: Global Stimulation Materials Market Volume K Tons Forecast, by Country 2019 & 2032
- Table 115: South Africa Stimulation Materials Market Revenue (Billion) Forecast, by Application 2019 & 2032
- Table 116: South Africa Stimulation Materials Market Volume (K Tons) Forecast, by Application 2019 & 2032
- Table 117: Rest of Middle East Stimulation Materials Market Revenue (Billion) Forecast, by Application 2019 & 2032
- Table 118: Rest of Middle East Stimulation Materials Market Volume (K Tons) Forecast, by Application 2019 & 2032
Frequently Asked Questions
1. What is the projected Compound Annual Growth Rate (CAGR) of the Stimulation Materials Market?
The projected CAGR is approximately 9.8%.
2. Which companies are prominent players in the Stimulation Materials Market?
Key companies in the market include Mineracao Curimbaba Ltda, Ecolab, Chevron Phillips Chemicals Company, Solvay, All Energy Sand, Baker Hughes, Imerys, CoorsTek Inc, Baltic Ceramics Investments S A, Weatherford International plc , Saint-Gobain (Saint-Gobain Proppants), Halliburton, Royal Dutch Shell PLC, Carbo Ceramics Inc, Hi-Crush Inc, Badger Mining Corporation, Schlumberger Limited, Unimin Corporation, Hexion Inc.
3. What are the main segments of the Stimulation Materials Market?
The market segments include Material Type.
4. Can you provide details about the market size?
The market size is estimated to be USD 59.6 Billion as of 2022.
5. What are some drivers contributing to market growth?
; Development of Unconventional Gas Resources; Increase in Mature Oilfields.
6. What are the notable trends driving market growth?
Proppants Segment to Dominate the Market Demand.
7. Are there any restraints impacting market growth?
; Environmental and Regulation Challenges.
8. Can you provide examples of recent developments in the market?
N/A
9. What pricing options are available for accessing the report?
Pricing options include single-user, multi-user, and enterprise licenses priced at USD 4750, USD 5250, and USD 8750 respectively.
10. Is the market size provided in terms of value or volume?
The market size is provided in terms of value, measured in Billion and volume, measured in K Tons.
11. Are there any specific market keywords associated with the report?
Yes, the market keyword associated with the report is "Stimulation Materials Market," which aids in identifying and referencing the specific market segment covered.
12. How do I determine which pricing option suits my needs best?
The pricing options vary based on user requirements and access needs. Individual users may opt for single-user licenses, while businesses requiring broader access may choose multi-user or enterprise licenses for cost-effective access to the report.
13. Are there any additional resources or data provided in the Stimulation Materials Market report?
While the report offers comprehensive insights, it's advisable to review the specific contents or supplementary materials provided to ascertain if additional resources or data are available.
14. How can I stay updated on further developments or reports in the Stimulation Materials Market?
To stay informed about further developments, trends, and reports in the Stimulation Materials Market, consider subscribing to industry newsletters, following relevant companies and organizations, or regularly checking reputable industry news sources and publications.
Methodology
Step 1 - Identification of Relevant Samples Size from Population Database


Step 2 - Approaches for Defining Global Market Size (Value, Volume* & Price*)

Note*: In applicable scenarios
Step 3 - Data Sources
Primary Research
- Web Analytics
- Survey Reports
- Research Institute
- Latest Research Reports
- Opinion Leaders
Secondary Research
- Annual Reports
- White Paper
- Latest Press Release
- Industry Association
- Paid Database
- Investor Presentations

Step 4 - Data Triangulation
Involves using different sources of information in order to increase the validity of a study
These sources are likely to be stakeholders in a program - participants, other researchers, program staff, other community members, and so on.
Then we put all data in single framework & apply various statistical tools to find out the dynamic on the market.
During the analysis stage, feedback from the stakeholder groups would be compared to determine areas of agreement as well as areas of divergence


