
Key Insights
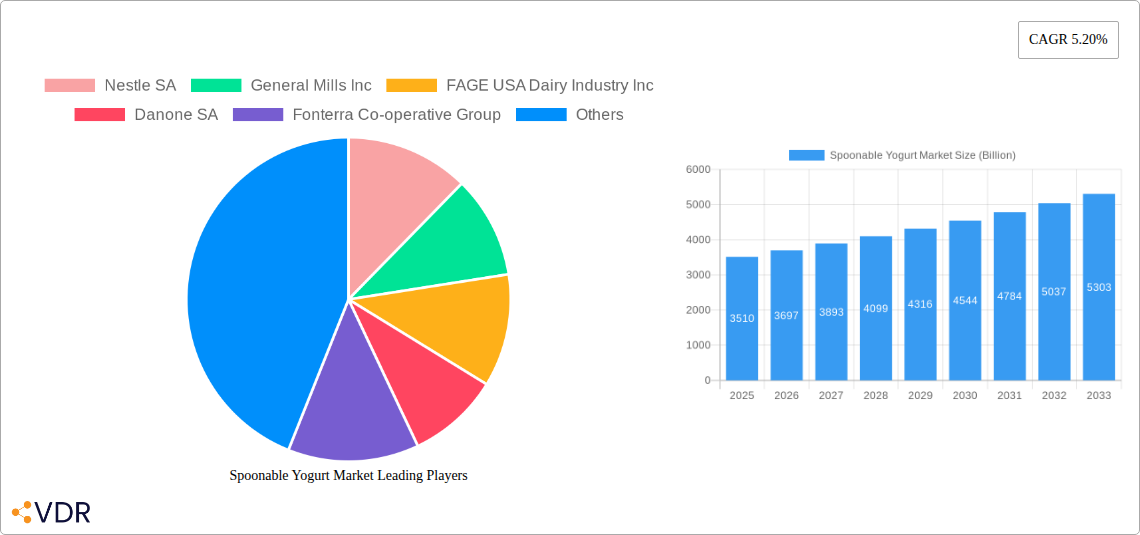
The global spoonable yogurt market, valued at $3.51 billion in 2025, is projected to experience robust growth, exhibiting a Compound Annual Growth Rate (CAGR) of 5.20% from 2025 to 2033. This growth is fueled by several key drivers. The increasing consumer preference for convenient, healthy, and on-the-go snack options significantly boosts demand. The rising awareness of the health benefits associated with yogurt, including its high protein content and probiotic properties, further contributes to market expansion. Moreover, the continuous innovation in flavors, textures, and product formats, such as Greek yogurt and organic varieties, caters to evolving consumer tastes and preferences, stimulating market growth. The market segmentation reveals a strong preference for dairy-based yogurt, although non-dairy alternatives are witnessing significant growth driven by increasing veganism and lactose intolerance. Hypermarkets and supermarkets remain the dominant distribution channels, but online retail channels are experiencing rapid expansion, indicating a shift towards e-commerce for grocery purchases. Key players like Nestle SA, General Mills Inc., and Danone SA are driving innovation and competition, further shaping market dynamics.
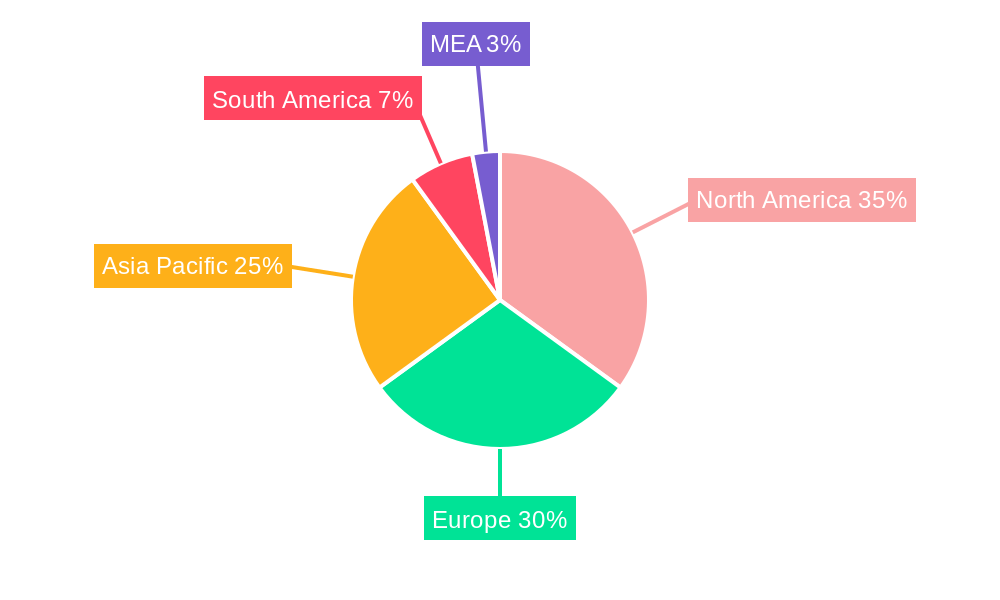
Regional analysis indicates North America and Europe as currently dominant markets, driven by high per capita consumption and established distribution networks. However, the Asia-Pacific region is anticipated to witness substantial growth in the forecast period due to increasing disposable incomes, changing lifestyles, and rising health consciousness within rapidly developing economies like China and India. While challenges like fluctuating dairy prices and intense competition among established players exist, the overall market outlook remains positive. The continued focus on product diversification, strategic partnerships, and expansion into emerging markets is expected to propel the spoonable yogurt market toward sustained and considerable growth in the coming years. The market's strong fundamentals and positive growth trajectory suggest considerable investment opportunities for stakeholders.
Spoonable Yogurt Market: A Comprehensive Market Report (2019-2033)
This comprehensive report provides an in-depth analysis of the global spoonable yogurt market, encompassing its current state, future trajectory, and key players. With a study period spanning 2019-2033, a base year of 2025, and a forecast period from 2025-2033, this report is an invaluable resource for industry professionals, investors, and anyone seeking a nuanced understanding of this dynamic market projected to be worth xx Billion by 2033. The report delves into various segments including dairy and non-dairy sources, organic and conventional categories, and distribution channels like hypermarkets/supermarkets, convenience stores, and online retail.
Spoonable Yogurt Market Dynamics & Structure
The spoonable yogurt market is characterized by a moderately concentrated structure, with key players like Nestle SA, General Mills Inc., and Danone SA holding significant market share. Technological innovations, such as the development of new flavors, textures, and functional ingredients, are driving market growth. However, regulatory frameworks concerning labeling, ingredients, and health claims influence product development and marketing strategies. The market also faces competition from alternative healthy snacks and beverages. Consumer demographics, particularly health-conscious individuals and those seeking convenient, on-the-go options, are key drivers. M&A activity in the sector has been moderate in recent years, with a total of xx deals recorded between 2019 and 2024, representing a market value of xx Billion.
- Market Concentration: Moderately concentrated, with top players holding xx% market share (2024).
- Technological Innovation: Focus on novel flavors, probiotics, and functional benefits.
- Regulatory Landscape: Stringent regulations regarding labeling and ingredients impact market dynamics.
- Competitive Substitutes: Growing competition from alternative healthy snacks and beverages.
- End-User Demographics: Health-conscious consumers and busy lifestyles fuel market growth.
- M&A Activity: xx billion in M&A deal value (2019-2024), with xx deals recorded.
Spoonable Yogurt Market Growth Trends & Insights
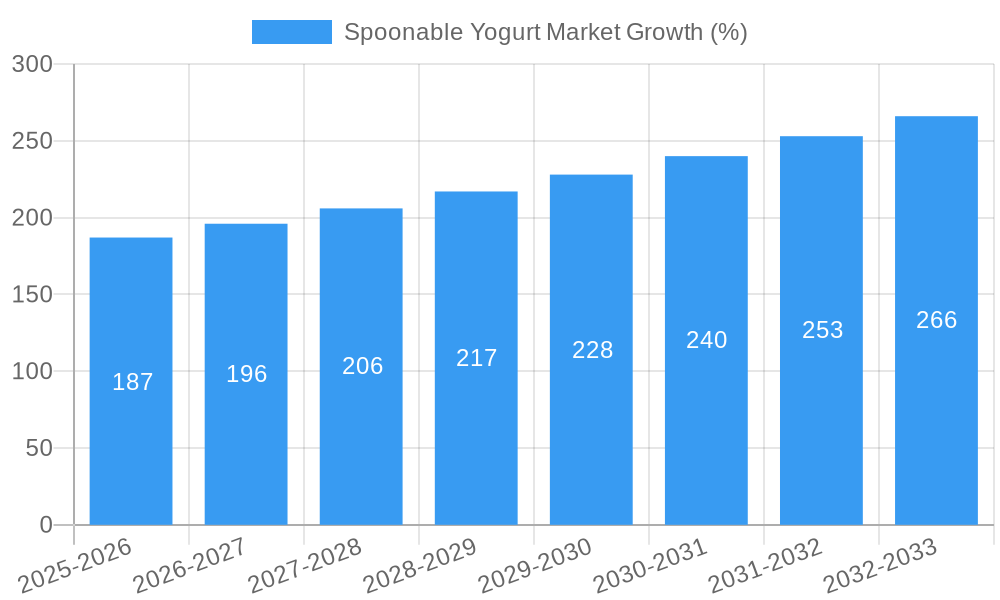
The global spoonable yogurt market experienced robust growth during the historical period (2019-2024), with a CAGR of xx%. This growth is primarily attributed to increasing consumer awareness of health and wellness, rising disposable incomes, and the growing popularity of convenient food options. Technological disruptions, including the introduction of innovative packaging and improved production processes, have enhanced efficiency and expanded market reach. Changing consumer preferences, such as a greater demand for organic and plant-based yogurt alternatives, are reshaping the market landscape. Market penetration in developed regions is nearing saturation, while emerging markets present substantial growth opportunities. The forecast period (2025-2033) anticipates continued expansion, driven by factors such as increasing demand for premium and specialized yogurts and the rise of e-commerce platforms for grocery purchases. The projected CAGR for the forecast period is xx%, with the market anticipated to reach xx Billion by 2033.
Dominant Regions, Countries, or Segments in Spoonable Yogurt Market
North America currently dominates the spoonable yogurt market, accounting for xx% of global revenue in 2024, followed by Europe at xx%. Within these regions, the dairy segment holds the largest market share, owing to established consumer preference and wide product availability. However, the non-dairy segment is experiencing rapid growth due to rising demand for vegan and plant-based options. Hypermarkets/supermarkets represent the most dominant distribution channel, but online retail channels are exhibiting the fastest growth, driven by convenience and expanding e-commerce penetration. Organic yogurts are gaining traction, although conventional yogurts maintain a significant market share.
- Key Growth Drivers: Rising disposable incomes, increasing health consciousness, and the growth of online retail.
- North America Dominance: Driven by high consumption rates and established market infrastructure.
- Fastest-Growing Segment: Non-dairy yogurt segment, due to veganism and dietary restrictions.
- Dominant Distribution Channel: Hypermarkets/supermarkets, with online retail exhibiting rapid growth.
Spoonable Yogurt Market Product Landscape
The spoonable yogurt market showcases a diverse range of products, encompassing various flavors, textures, and functional benefits. Innovations focus on enhancing nutritional value, such as incorporating probiotics and adding functional ingredients like prebiotics. The use of sustainable and eco-friendly packaging is also gaining traction. Products are differentiated by their source (dairy or non-dairy), category (organic or conventional), and flavor profiles, appealing to a broad consumer base with unique selling propositions focused on taste, health benefits, and convenience. Technological advancements are continuously improving production efficiency and product quality.
Key Drivers, Barriers & Challenges in Spoonable Yogurt Market
Key Drivers:
- Increasing health and wellness awareness among consumers.
- Growing demand for convenient and portable food options.
- Rising disposable incomes in developing countries.
- Technological advancements in product development and packaging.
Challenges & Restraints:
- Intense competition from established brands and emerging players.
- Fluctuations in raw material prices, particularly dairy products.
- Stringent regulations and safety standards imposed by governmental bodies.
- Supply chain disruptions impacting availability and cost. These have led to a xx% increase in production costs in the last two years, affecting profitability.
Emerging Opportunities in Spoonable Yogurt Market
Emerging opportunities lie in the expansion into untapped markets, particularly in developing economies with a growing middle class. The development of innovative products, such as high-protein yogurts, functional yogurts with added health benefits, and unique flavor combinations, will create new market segments. E-commerce platforms also present a major opportunity for growth, with personalized recommendations and targeted marketing campaigns. Catering to niche dietary requirements, such as gluten-free, keto-friendly, and halal products will also open up considerable growth avenues.
Growth Accelerators in the Spoonable Yogurt Market Industry
Technological advancements in areas like fermentation and packaging, alongside strategic partnerships to enhance supply chains, will propel long-term growth. Expanding into new geographical markets, particularly in developing economies, and adopting aggressive marketing strategies to reach new consumers will further accelerate market expansion. The introduction of innovative product lines and formats, such as single-serve cups and squeezable pouches, will expand consumer accessibility. Investment in research and development to create more sustainable and innovative products will also contribute to market growth.
Key Players Shaping the Spoonable Yogurt Market Market
- Nestle SA
- General Mills Inc.
- FAGE USA Dairy Industry Inc.
- Danone SA
- Fonterra Co-operative Group
- Grupo LALA
- Chobani LLC
- Arla Foods
- COFCO Group
- Hain Celestial Group
Notable Milestones in Spoonable Yogurt Market Sector
- December 2021: Farm Fresh unveils new spoonable yogurt packaging with included spoon.
- August 2021: Brownes Dairy launches "The Greek" adult spoonable yogurt in various flavors.
- June 2020: General Mills unveils three new Yoplait yogurt flavors.
In-Depth Spoonable Yogurt Market Market Outlook
The future of the spoonable yogurt market is bright, with continued growth driven by factors such as increasing health awareness, expanding consumer base, and innovation in product development. Strategic partnerships and investments in research and development will play a crucial role in shaping the market landscape. The focus on sustainability and ethical sourcing will become increasingly important, as will the expansion into new markets and the adoption of innovative distribution channels. The projected CAGR for the next decade indicates strong growth potential and attractive opportunities for stakeholders.
Spoonable Yogurt Market Segmentation
-
1. Source
- 1.1. Dairy
- 1.2. Non-Dairy
-
2. Category
- 2.1. Organic
- 2.2. Conventional
-
3. Distribution
- 3.1. Hypermarkets/Supermarkets
- 3.2. Convenience Store
- 3.3. Online Retail Channels
- 3.4. Other Distribution Channel
Spoonable Yogurt Market Segmentation By Geography
-
1. North America
- 1.1. United States
- 1.2. Canada
- 1.3. Mexico
- 1.4. Rest of North America
-
2. Europe
- 2.1. United Kingdom
- 2.2. Germany
- 2.3. France
- 2.4. Italy
- 2.5. Spain
- 2.6. Rest of the Europe
-
3. Asia Pacific
- 3.1. India
- 3.2. China
- 3.3. Japan
- 3.4. Australia
- 3.5. Rest of Asia Pacific
-
4. South America
- 4.1. Brazil
- 4.2. Argentina
- 4.3. Rest of south America
-
5. Middle East and Africa
- 5.1. South Africa
- 5.2. Saudi Arabia
- 5.3. Rest of Middle East and Africa
Spoonable Yogurt Market REPORT HIGHLIGHTS
| Aspects | Details |
|---|---|
| Study Period | 2019-2033 |
| Base Year | 2024 |
| Estimated Year | 2025 |
| Forecast Period | 2025-2033 |
| Historical Period | 2019-2024 |
| Growth Rate | CAGR of 5.20% from 2019-2033 |
| Segmentation |
|
Table of Contents
- 1. Introduction
- 1.1. Research Scope
- 1.2. Market Segmentation
- 1.3. Research Methodology
- 1.4. Definitions and Assumptions
- 2. Executive Summary
- 2.1. Introduction
- 3. Market Dynamics
- 3.1. Introduction
- 3.2. Market Drivers
- 3.2.1. Demand for Low-fat and Non-Dairy Ice Cream Products; Growing Acceptance of Experimental Flavors
- 3.3. Market Restrains
- 3.3.1. Rising Concern over Health Issues Associated with Ice Cream
- 3.4. Market Trends
- 3.4.1. Innovative Flavors driving the market
- 4. Market Factor Analysis
- 4.1. Porters Five Forces
- 4.2. Supply/Value Chain
- 4.3. PESTEL analysis
- 4.4. Market Entropy
- 4.5. Patent/Trademark Analysis
- 5. Global Spoonable Yogurt Market Analysis, Insights and Forecast, 2019-2031
- 5.1. Market Analysis, Insights and Forecast - by Source
- 5.1.1. Dairy
- 5.1.2. Non-Dairy
- 5.2. Market Analysis, Insights and Forecast - by Category
- 5.2.1. Organic
- 5.2.2. Conventional
- 5.3. Market Analysis, Insights and Forecast - by Distribution
- 5.3.1. Hypermarkets/Supermarkets
- 5.3.2. Convenience Store
- 5.3.3. Online Retail Channels
- 5.3.4. Other Distribution Channel
- 5.4. Market Analysis, Insights and Forecast - by Region
- 5.4.1. North America
- 5.4.2. Europe
- 5.4.3. Asia Pacific
- 5.4.4. South America
- 5.4.5. Middle East and Africa
- 5.1. Market Analysis, Insights and Forecast - by Source
- 6. North America Spoonable Yogurt Market Analysis, Insights and Forecast, 2019-2031
- 6.1. Market Analysis, Insights and Forecast - by Source
- 6.1.1. Dairy
- 6.1.2. Non-Dairy
- 6.2. Market Analysis, Insights and Forecast - by Category
- 6.2.1. Organic
- 6.2.2. Conventional
- 6.3. Market Analysis, Insights and Forecast - by Distribution
- 6.3.1. Hypermarkets/Supermarkets
- 6.3.2. Convenience Store
- 6.3.3. Online Retail Channels
- 6.3.4. Other Distribution Channel
- 6.1. Market Analysis, Insights and Forecast - by Source
- 7. Europe Spoonable Yogurt Market Analysis, Insights and Forecast, 2019-2031
- 7.1. Market Analysis, Insights and Forecast - by Source
- 7.1.1. Dairy
- 7.1.2. Non-Dairy
- 7.2. Market Analysis, Insights and Forecast - by Category
- 7.2.1. Organic
- 7.2.2. Conventional
- 7.3. Market Analysis, Insights and Forecast - by Distribution
- 7.3.1. Hypermarkets/Supermarkets
- 7.3.2. Convenience Store
- 7.3.3. Online Retail Channels
- 7.3.4. Other Distribution Channel
- 7.1. Market Analysis, Insights and Forecast - by Source
- 8. Asia Pacific Spoonable Yogurt Market Analysis, Insights and Forecast, 2019-2031
- 8.1. Market Analysis, Insights and Forecast - by Source
- 8.1.1. Dairy
- 8.1.2. Non-Dairy
- 8.2. Market Analysis, Insights and Forecast - by Category
- 8.2.1. Organic
- 8.2.2. Conventional
- 8.3. Market Analysis, Insights and Forecast - by Distribution
- 8.3.1. Hypermarkets/Supermarkets
- 8.3.2. Convenience Store
- 8.3.3. Online Retail Channels
- 8.3.4. Other Distribution Channel
- 8.1. Market Analysis, Insights and Forecast - by Source
- 9. South America Spoonable Yogurt Market Analysis, Insights and Forecast, 2019-2031
- 9.1. Market Analysis, Insights and Forecast - by Source
- 9.1.1. Dairy
- 9.1.2. Non-Dairy
- 9.2. Market Analysis, Insights and Forecast - by Category
- 9.2.1. Organic
- 9.2.2. Conventional
- 9.3. Market Analysis, Insights and Forecast - by Distribution
- 9.3.1. Hypermarkets/Supermarkets
- 9.3.2. Convenience Store
- 9.3.3. Online Retail Channels
- 9.3.4. Other Distribution Channel
- 9.1. Market Analysis, Insights and Forecast - by Source
- 10. Middle East and Africa Spoonable Yogurt Market Analysis, Insights and Forecast, 2019-2031
- 10.1. Market Analysis, Insights and Forecast - by Source
- 10.1.1. Dairy
- 10.1.2. Non-Dairy
- 10.2. Market Analysis, Insights and Forecast - by Category
- 10.2.1. Organic
- 10.2.2. Conventional
- 10.3. Market Analysis, Insights and Forecast - by Distribution
- 10.3.1. Hypermarkets/Supermarkets
- 10.3.2. Convenience Store
- 10.3.3. Online Retail Channels
- 10.3.4. Other Distribution Channel
- 10.1. Market Analysis, Insights and Forecast - by Source
- 11. North America Spoonable Yogurt Market Analysis, Insights and Forecast, 2019-2031
- 11.1. Market Analysis, Insights and Forecast - By Country/Sub-region
- 11.1.1 United States
- 11.1.2 Canada
- 11.1.3 Mexico
- 12. Europe Spoonable Yogurt Market Analysis, Insights and Forecast, 2019-2031
- 12.1. Market Analysis, Insights and Forecast - By Country/Sub-region
- 12.1.1 Germany
- 12.1.2 United Kingdom
- 12.1.3 France
- 12.1.4 Spain
- 12.1.5 Italy
- 12.1.6 Spain
- 12.1.7 Belgium
- 12.1.8 Netherland
- 12.1.9 Nordics
- 12.1.10 Rest of Europe
- 13. Asia Pacific Spoonable Yogurt Market Analysis, Insights and Forecast, 2019-2031
- 13.1. Market Analysis, Insights and Forecast - By Country/Sub-region
- 13.1.1 China
- 13.1.2 Japan
- 13.1.3 India
- 13.1.4 South Korea
- 13.1.5 Southeast Asia
- 13.1.6 Australia
- 13.1.7 Indonesia
- 13.1.8 Phillipes
- 13.1.9 Singapore
- 13.1.10 Thailandc
- 13.1.11 Rest of Asia Pacific
- 14. South America Spoonable Yogurt Market Analysis, Insights and Forecast, 2019-2031
- 14.1. Market Analysis, Insights and Forecast - By Country/Sub-region
- 14.1.1 Brazil
- 14.1.2 Argentina
- 14.1.3 Peru
- 14.1.4 Chile
- 14.1.5 Colombia
- 14.1.6 Ecuador
- 14.1.7 Venezuela
- 14.1.8 Rest of South America
- 15. North America Spoonable Yogurt Market Analysis, Insights and Forecast, 2019-2031
- 15.1. Market Analysis, Insights and Forecast - By Country/Sub-region
- 15.1.1 United States
- 15.1.2 Canada
- 15.1.3 Mexico
- 16. MEA Spoonable Yogurt Market Analysis, Insights and Forecast, 2019-2031
- 16.1. Market Analysis, Insights and Forecast - By Country/Sub-region
- 16.1.1 United Arab Emirates
- 16.1.2 Saudi Arabia
- 16.1.3 South Africa
- 16.1.4 Rest of Middle East and Africa
- 17. Competitive Analysis
- 17.1. Global Market Share Analysis 2024
- 17.2. Company Profiles
- 17.2.1 Nestle SA
- 17.2.1.1. Overview
- 17.2.1.2. Products
- 17.2.1.3. SWOT Analysis
- 17.2.1.4. Recent Developments
- 17.2.1.5. Financials (Based on Availability)
- 17.2.2 General Mills Inc
- 17.2.2.1. Overview
- 17.2.2.2. Products
- 17.2.2.3. SWOT Analysis
- 17.2.2.4. Recent Developments
- 17.2.2.5. Financials (Based on Availability)
- 17.2.3 FAGE USA Dairy Industry Inc
- 17.2.3.1. Overview
- 17.2.3.2. Products
- 17.2.3.3. SWOT Analysis
- 17.2.3.4. Recent Developments
- 17.2.3.5. Financials (Based on Availability)
- 17.2.4 Danone SA
- 17.2.4.1. Overview
- 17.2.4.2. Products
- 17.2.4.3. SWOT Analysis
- 17.2.4.4. Recent Developments
- 17.2.4.5. Financials (Based on Availability)
- 17.2.5 Fonterra Co-operative Group
- 17.2.5.1. Overview
- 17.2.5.2. Products
- 17.2.5.3. SWOT Analysis
- 17.2.5.4. Recent Developments
- 17.2.5.5. Financials (Based on Availability)
- 17.2.6 Grupo LALA
- 17.2.6.1. Overview
- 17.2.6.2. Products
- 17.2.6.3. SWOT Analysis
- 17.2.6.4. Recent Developments
- 17.2.6.5. Financials (Based on Availability)
- 17.2.7 Chobani LLC
- 17.2.7.1. Overview
- 17.2.7.2. Products
- 17.2.7.3. SWOT Analysis
- 17.2.7.4. Recent Developments
- 17.2.7.5. Financials (Based on Availability)
- 17.2.8 Arla Foods*List Not Exhaustive
- 17.2.8.1. Overview
- 17.2.8.2. Products
- 17.2.8.3. SWOT Analysis
- 17.2.8.4. Recent Developments
- 17.2.8.5. Financials (Based on Availability)
- 17.2.9 COFCO Group
- 17.2.9.1. Overview
- 17.2.9.2. Products
- 17.2.9.3. SWOT Analysis
- 17.2.9.4. Recent Developments
- 17.2.9.5. Financials (Based on Availability)
- 17.2.10 Hain Celestial Group
- 17.2.10.1. Overview
- 17.2.10.2. Products
- 17.2.10.3. SWOT Analysis
- 17.2.10.4. Recent Developments
- 17.2.10.5. Financials (Based on Availability)
- 17.2.1 Nestle SA
List of Figures
- Figure 1: Global Spoonable Yogurt Market Revenue Breakdown (Billion, %) by Region 2024 & 2032
- Figure 2: North America Spoonable Yogurt Market Revenue (Billion), by Country 2024 & 2032
- Figure 3: North America Spoonable Yogurt Market Revenue Share (%), by Country 2024 & 2032
- Figure 4: Europe Spoonable Yogurt Market Revenue (Billion), by Country 2024 & 2032
- Figure 5: Europe Spoonable Yogurt Market Revenue Share (%), by Country 2024 & 2032
- Figure 6: Asia Pacific Spoonable Yogurt Market Revenue (Billion), by Country 2024 & 2032
- Figure 7: Asia Pacific Spoonable Yogurt Market Revenue Share (%), by Country 2024 & 2032
- Figure 8: South America Spoonable Yogurt Market Revenue (Billion), by Country 2024 & 2032
- Figure 9: South America Spoonable Yogurt Market Revenue Share (%), by Country 2024 & 2032
- Figure 10: North America Spoonable Yogurt Market Revenue (Billion), by Country 2024 & 2032
- Figure 11: North America Spoonable Yogurt Market Revenue Share (%), by Country 2024 & 2032
- Figure 12: MEA Spoonable Yogurt Market Revenue (Billion), by Country 2024 & 2032
- Figure 13: MEA Spoonable Yogurt Market Revenue Share (%), by Country 2024 & 2032
- Figure 14: North America Spoonable Yogurt Market Revenue (Billion), by Source 2024 & 2032
- Figure 15: North America Spoonable Yogurt Market Revenue Share (%), by Source 2024 & 2032
- Figure 16: North America Spoonable Yogurt Market Revenue (Billion), by Category 2024 & 2032
- Figure 17: North America Spoonable Yogurt Market Revenue Share (%), by Category 2024 & 2032
- Figure 18: North America Spoonable Yogurt Market Revenue (Billion), by Distribution 2024 & 2032
- Figure 19: North America Spoonable Yogurt Market Revenue Share (%), by Distribution 2024 & 2032
- Figure 20: North America Spoonable Yogurt Market Revenue (Billion), by Country 2024 & 2032
- Figure 21: North America Spoonable Yogurt Market Revenue Share (%), by Country 2024 & 2032
- Figure 22: Europe Spoonable Yogurt Market Revenue (Billion), by Source 2024 & 2032
- Figure 23: Europe Spoonable Yogurt Market Revenue Share (%), by Source 2024 & 2032
- Figure 24: Europe Spoonable Yogurt Market Revenue (Billion), by Category 2024 & 2032
- Figure 25: Europe Spoonable Yogurt Market Revenue Share (%), by Category 2024 & 2032
- Figure 26: Europe Spoonable Yogurt Market Revenue (Billion), by Distribution 2024 & 2032
- Figure 27: Europe Spoonable Yogurt Market Revenue Share (%), by Distribution 2024 & 2032
- Figure 28: Europe Spoonable Yogurt Market Revenue (Billion), by Country 2024 & 2032
- Figure 29: Europe Spoonable Yogurt Market Revenue Share (%), by Country 2024 & 2032
- Figure 30: Asia Pacific Spoonable Yogurt Market Revenue (Billion), by Source 2024 & 2032
- Figure 31: Asia Pacific Spoonable Yogurt Market Revenue Share (%), by Source 2024 & 2032
- Figure 32: Asia Pacific Spoonable Yogurt Market Revenue (Billion), by Category 2024 & 2032
- Figure 33: Asia Pacific Spoonable Yogurt Market Revenue Share (%), by Category 2024 & 2032
- Figure 34: Asia Pacific Spoonable Yogurt Market Revenue (Billion), by Distribution 2024 & 2032
- Figure 35: Asia Pacific Spoonable Yogurt Market Revenue Share (%), by Distribution 2024 & 2032
- Figure 36: Asia Pacific Spoonable Yogurt Market Revenue (Billion), by Country 2024 & 2032
- Figure 37: Asia Pacific Spoonable Yogurt Market Revenue Share (%), by Country 2024 & 2032
- Figure 38: South America Spoonable Yogurt Market Revenue (Billion), by Source 2024 & 2032
- Figure 39: South America Spoonable Yogurt Market Revenue Share (%), by Source 2024 & 2032
- Figure 40: South America Spoonable Yogurt Market Revenue (Billion), by Category 2024 & 2032
- Figure 41: South America Spoonable Yogurt Market Revenue Share (%), by Category 2024 & 2032
- Figure 42: South America Spoonable Yogurt Market Revenue (Billion), by Distribution 2024 & 2032
- Figure 43: South America Spoonable Yogurt Market Revenue Share (%), by Distribution 2024 & 2032
- Figure 44: South America Spoonable Yogurt Market Revenue (Billion), by Country 2024 & 2032
- Figure 45: South America Spoonable Yogurt Market Revenue Share (%), by Country 2024 & 2032
- Figure 46: Middle East and Africa Spoonable Yogurt Market Revenue (Billion), by Source 2024 & 2032
- Figure 47: Middle East and Africa Spoonable Yogurt Market Revenue Share (%), by Source 2024 & 2032
- Figure 48: Middle East and Africa Spoonable Yogurt Market Revenue (Billion), by Category 2024 & 2032
- Figure 49: Middle East and Africa Spoonable Yogurt Market Revenue Share (%), by Category 2024 & 2032
- Figure 50: Middle East and Africa Spoonable Yogurt Market Revenue (Billion), by Distribution 2024 & 2032
- Figure 51: Middle East and Africa Spoonable Yogurt Market Revenue Share (%), by Distribution 2024 & 2032
- Figure 52: Middle East and Africa Spoonable Yogurt Market Revenue (Billion), by Country 2024 & 2032
- Figure 53: Middle East and Africa Spoonable Yogurt Market Revenue Share (%), by Country 2024 & 2032
List of Tables
- Table 1: Global Spoonable Yogurt Market Revenue Billion Forecast, by Region 2019 & 2032
- Table 2: Global Spoonable Yogurt Market Revenue Billion Forecast, by Source 2019 & 2032
- Table 3: Global Spoonable Yogurt Market Revenue Billion Forecast, by Category 2019 & 2032
- Table 4: Global Spoonable Yogurt Market Revenue Billion Forecast, by Distribution 2019 & 2032
- Table 5: Global Spoonable Yogurt Market Revenue Billion Forecast, by Region 2019 & 2032
- Table 6: Global Spoonable Yogurt Market Revenue Billion Forecast, by Country 2019 & 2032
- Table 7: United States Spoonable Yogurt Market Revenue (Billion) Forecast, by Application 2019 & 2032
- Table 8: Canada Spoonable Yogurt Market Revenue (Billion) Forecast, by Application 2019 & 2032
- Table 9: Mexico Spoonable Yogurt Market Revenue (Billion) Forecast, by Application 2019 & 2032
- Table 10: Global Spoonable Yogurt Market Revenue Billion Forecast, by Country 2019 & 2032
- Table 11: Germany Spoonable Yogurt Market Revenue (Billion) Forecast, by Application 2019 & 2032
- Table 12: United Kingdom Spoonable Yogurt Market Revenue (Billion) Forecast, by Application 2019 & 2032
- Table 13: France Spoonable Yogurt Market Revenue (Billion) Forecast, by Application 2019 & 2032
- Table 14: Spain Spoonable Yogurt Market Revenue (Billion) Forecast, by Application 2019 & 2032
- Table 15: Italy Spoonable Yogurt Market Revenue (Billion) Forecast, by Application 2019 & 2032
- Table 16: Spain Spoonable Yogurt Market Revenue (Billion) Forecast, by Application 2019 & 2032
- Table 17: Belgium Spoonable Yogurt Market Revenue (Billion) Forecast, by Application 2019 & 2032
- Table 18: Netherland Spoonable Yogurt Market Revenue (Billion) Forecast, by Application 2019 & 2032
- Table 19: Nordics Spoonable Yogurt Market Revenue (Billion) Forecast, by Application 2019 & 2032
- Table 20: Rest of Europe Spoonable Yogurt Market Revenue (Billion) Forecast, by Application 2019 & 2032
- Table 21: Global Spoonable Yogurt Market Revenue Billion Forecast, by Country 2019 & 2032
- Table 22: China Spoonable Yogurt Market Revenue (Billion) Forecast, by Application 2019 & 2032
- Table 23: Japan Spoonable Yogurt Market Revenue (Billion) Forecast, by Application 2019 & 2032
- Table 24: India Spoonable Yogurt Market Revenue (Billion) Forecast, by Application 2019 & 2032
- Table 25: South Korea Spoonable Yogurt Market Revenue (Billion) Forecast, by Application 2019 & 2032
- Table 26: Southeast Asia Spoonable Yogurt Market Revenue (Billion) Forecast, by Application 2019 & 2032
- Table 27: Australia Spoonable Yogurt Market Revenue (Billion) Forecast, by Application 2019 & 2032
- Table 28: Indonesia Spoonable Yogurt Market Revenue (Billion) Forecast, by Application 2019 & 2032
- Table 29: Phillipes Spoonable Yogurt Market Revenue (Billion) Forecast, by Application 2019 & 2032
- Table 30: Singapore Spoonable Yogurt Market Revenue (Billion) Forecast, by Application 2019 & 2032
- Table 31: Thailandc Spoonable Yogurt Market Revenue (Billion) Forecast, by Application 2019 & 2032
- Table 32: Rest of Asia Pacific Spoonable Yogurt Market Revenue (Billion) Forecast, by Application 2019 & 2032
- Table 33: Global Spoonable Yogurt Market Revenue Billion Forecast, by Country 2019 & 2032
- Table 34: Brazil Spoonable Yogurt Market Revenue (Billion) Forecast, by Application 2019 & 2032
- Table 35: Argentina Spoonable Yogurt Market Revenue (Billion) Forecast, by Application 2019 & 2032
- Table 36: Peru Spoonable Yogurt Market Revenue (Billion) Forecast, by Application 2019 & 2032
- Table 37: Chile Spoonable Yogurt Market Revenue (Billion) Forecast, by Application 2019 & 2032
- Table 38: Colombia Spoonable Yogurt Market Revenue (Billion) Forecast, by Application 2019 & 2032
- Table 39: Ecuador Spoonable Yogurt Market Revenue (Billion) Forecast, by Application 2019 & 2032
- Table 40: Venezuela Spoonable Yogurt Market Revenue (Billion) Forecast, by Application 2019 & 2032
- Table 41: Rest of South America Spoonable Yogurt Market Revenue (Billion) Forecast, by Application 2019 & 2032
- Table 42: Global Spoonable Yogurt Market Revenue Billion Forecast, by Country 2019 & 2032
- Table 43: United States Spoonable Yogurt Market Revenue (Billion) Forecast, by Application 2019 & 2032
- Table 44: Canada Spoonable Yogurt Market Revenue (Billion) Forecast, by Application 2019 & 2032
- Table 45: Mexico Spoonable Yogurt Market Revenue (Billion) Forecast, by Application 2019 & 2032
- Table 46: Global Spoonable Yogurt Market Revenue Billion Forecast, by Country 2019 & 2032
- Table 47: United Arab Emirates Spoonable Yogurt Market Revenue (Billion) Forecast, by Application 2019 & 2032
- Table 48: Saudi Arabia Spoonable Yogurt Market Revenue (Billion) Forecast, by Application 2019 & 2032
- Table 49: South Africa Spoonable Yogurt Market Revenue (Billion) Forecast, by Application 2019 & 2032
- Table 50: Rest of Middle East and Africa Spoonable Yogurt Market Revenue (Billion) Forecast, by Application 2019 & 2032
- Table 51: Global Spoonable Yogurt Market Revenue Billion Forecast, by Source 2019 & 2032
- Table 52: Global Spoonable Yogurt Market Revenue Billion Forecast, by Category 2019 & 2032
- Table 53: Global Spoonable Yogurt Market Revenue Billion Forecast, by Distribution 2019 & 2032
- Table 54: Global Spoonable Yogurt Market Revenue Billion Forecast, by Country 2019 & 2032
- Table 55: United States Spoonable Yogurt Market Revenue (Billion) Forecast, by Application 2019 & 2032
- Table 56: Canada Spoonable Yogurt Market Revenue (Billion) Forecast, by Application 2019 & 2032
- Table 57: Mexico Spoonable Yogurt Market Revenue (Billion) Forecast, by Application 2019 & 2032
- Table 58: Rest of North America Spoonable Yogurt Market Revenue (Billion) Forecast, by Application 2019 & 2032
- Table 59: Global Spoonable Yogurt Market Revenue Billion Forecast, by Source 2019 & 2032
- Table 60: Global Spoonable Yogurt Market Revenue Billion Forecast, by Category 2019 & 2032
- Table 61: Global Spoonable Yogurt Market Revenue Billion Forecast, by Distribution 2019 & 2032
- Table 62: Global Spoonable Yogurt Market Revenue Billion Forecast, by Country 2019 & 2032
- Table 63: United Kingdom Spoonable Yogurt Market Revenue (Billion) Forecast, by Application 2019 & 2032
- Table 64: Germany Spoonable Yogurt Market Revenue (Billion) Forecast, by Application 2019 & 2032
- Table 65: France Spoonable Yogurt Market Revenue (Billion) Forecast, by Application 2019 & 2032
- Table 66: Italy Spoonable Yogurt Market Revenue (Billion) Forecast, by Application 2019 & 2032
- Table 67: Spain Spoonable Yogurt Market Revenue (Billion) Forecast, by Application 2019 & 2032
- Table 68: Rest of the Europe Spoonable Yogurt Market Revenue (Billion) Forecast, by Application 2019 & 2032
- Table 69: Global Spoonable Yogurt Market Revenue Billion Forecast, by Source 2019 & 2032
- Table 70: Global Spoonable Yogurt Market Revenue Billion Forecast, by Category 2019 & 2032
- Table 71: Global Spoonable Yogurt Market Revenue Billion Forecast, by Distribution 2019 & 2032
- Table 72: Global Spoonable Yogurt Market Revenue Billion Forecast, by Country 2019 & 2032
- Table 73: India Spoonable Yogurt Market Revenue (Billion) Forecast, by Application 2019 & 2032
- Table 74: China Spoonable Yogurt Market Revenue (Billion) Forecast, by Application 2019 & 2032
- Table 75: Japan Spoonable Yogurt Market Revenue (Billion) Forecast, by Application 2019 & 2032
- Table 76: Australia Spoonable Yogurt Market Revenue (Billion) Forecast, by Application 2019 & 2032
- Table 77: Rest of Asia Pacific Spoonable Yogurt Market Revenue (Billion) Forecast, by Application 2019 & 2032
- Table 78: Global Spoonable Yogurt Market Revenue Billion Forecast, by Source 2019 & 2032
- Table 79: Global Spoonable Yogurt Market Revenue Billion Forecast, by Category 2019 & 2032
- Table 80: Global Spoonable Yogurt Market Revenue Billion Forecast, by Distribution 2019 & 2032
- Table 81: Global Spoonable Yogurt Market Revenue Billion Forecast, by Country 2019 & 2032
- Table 82: Brazil Spoonable Yogurt Market Revenue (Billion) Forecast, by Application 2019 & 2032
- Table 83: Argentina Spoonable Yogurt Market Revenue (Billion) Forecast, by Application 2019 & 2032
- Table 84: Rest of south America Spoonable Yogurt Market Revenue (Billion) Forecast, by Application 2019 & 2032
- Table 85: Global Spoonable Yogurt Market Revenue Billion Forecast, by Source 2019 & 2032
- Table 86: Global Spoonable Yogurt Market Revenue Billion Forecast, by Category 2019 & 2032
- Table 87: Global Spoonable Yogurt Market Revenue Billion Forecast, by Distribution 2019 & 2032
- Table 88: Global Spoonable Yogurt Market Revenue Billion Forecast, by Country 2019 & 2032
- Table 89: South Africa Spoonable Yogurt Market Revenue (Billion) Forecast, by Application 2019 & 2032
- Table 90: Saudi Arabia Spoonable Yogurt Market Revenue (Billion) Forecast, by Application 2019 & 2032
- Table 91: Rest of Middle East and Africa Spoonable Yogurt Market Revenue (Billion) Forecast, by Application 2019 & 2032
Frequently Asked Questions
1. What is the projected Compound Annual Growth Rate (CAGR) of the Spoonable Yogurt Market?
The projected CAGR is approximately 5.20%.
2. Which companies are prominent players in the Spoonable Yogurt Market?
Key companies in the market include Nestle SA, General Mills Inc, FAGE USA Dairy Industry Inc, Danone SA, Fonterra Co-operative Group, Grupo LALA, Chobani LLC, Arla Foods*List Not Exhaustive, COFCO Group, Hain Celestial Group.
3. What are the main segments of the Spoonable Yogurt Market?
The market segments include Source, Category, Distribution.
4. Can you provide details about the market size?
The market size is estimated to be USD 3.51 Billion as of 2022.
5. What are some drivers contributing to market growth?
Demand for Low-fat and Non-Dairy Ice Cream Products; Growing Acceptance of Experimental Flavors.
6. What are the notable trends driving market growth?
Innovative Flavors driving the market.
7. Are there any restraints impacting market growth?
Rising Concern over Health Issues Associated with Ice Cream.
8. Can you provide examples of recent developments in the market?
In December 2021, Farm Fresh has unveiled new packaging for its line of spoonable yogurt by including a spoon with each serving.
9. What pricing options are available for accessing the report?
Pricing options include single-user, multi-user, and enterprise licenses priced at USD 4750, USD 5250, and USD 8750 respectively.
10. Is the market size provided in terms of value or volume?
The market size is provided in terms of value, measured in Billion.
11. Are there any specific market keywords associated with the report?
Yes, the market keyword associated with the report is "Spoonable Yogurt Market," which aids in identifying and referencing the specific market segment covered.
12. How do I determine which pricing option suits my needs best?
The pricing options vary based on user requirements and access needs. Individual users may opt for single-user licenses, while businesses requiring broader access may choose multi-user or enterprise licenses for cost-effective access to the report.
13. Are there any additional resources or data provided in the Spoonable Yogurt Market report?
While the report offers comprehensive insights, it's advisable to review the specific contents or supplementary materials provided to ascertain if additional resources or data are available.
14. How can I stay updated on further developments or reports in the Spoonable Yogurt Market?
To stay informed about further developments, trends, and reports in the Spoonable Yogurt Market, consider subscribing to industry newsletters, following relevant companies and organizations, or regularly checking reputable industry news sources and publications.
Methodology
Step 1 - Identification of Relevant Samples Size from Population Database


Step 2 - Approaches for Defining Global Market Size (Value, Volume* & Price*)

Note*: In applicable scenarios
Step 3 - Data Sources
Primary Research
- Web Analytics
- Survey Reports
- Research Institute
- Latest Research Reports
- Opinion Leaders
Secondary Research
- Annual Reports
- White Paper
- Latest Press Release
- Industry Association
- Paid Database
- Investor Presentations

Step 4 - Data Triangulation
Involves using different sources of information in order to increase the validity of a study
These sources are likely to be stakeholders in a program - participants, other researchers, program staff, other community members, and so on.
Then we put all data in single framework & apply various statistical tools to find out the dynamic on the market.
During the analysis stage, feedback from the stakeholder groups would be compared to determine areas of agreement as well as areas of divergence


