
Key Insights
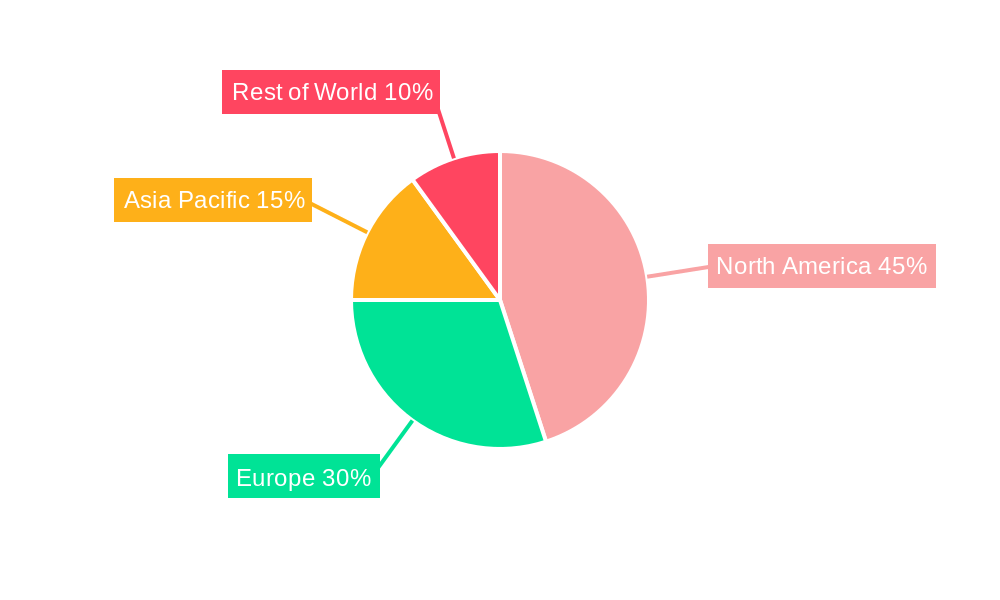
The Spinal Muscular Atrophy (SMA) medicine market is experiencing robust growth, driven by increasing prevalence of SMA, advances in gene therapy and novel drug therapies, and a growing awareness among healthcare professionals and patients. The market's compound annual growth rate (CAGR) of 14.50% from 2019 to 2024 suggests significant market expansion. This growth is fueled by the increasing success of gene therapies like Spinraza and Zolgensma, which offer the potential for life-altering improvements for SMA patients. Furthermore, the ongoing research and development efforts in the field are expected to introduce new and improved therapies in the coming years, furthering market expansion. The different routes of administration, including oral and intrathecal, as well as various treatment types, such as gene replacement and drug therapies, contribute to market segmentation and growth opportunities. The market's geographic distribution is largely concentrated in regions with advanced healthcare infrastructure and higher disposable incomes, such as North America and Europe, but emerging markets in Asia Pacific are also exhibiting increasing demand, presenting significant future potential. Competition among pharmaceutical giants like Novartis, Biogen, and Roche, further drives innovation and accessibility of SMA treatments.
The forecast period (2025-2033) anticipates continued market expansion, driven by factors such as expanding patient populations, the launch of newer therapies, and broader access to existing treatments. The increasing reimbursement coverage for SMA therapies is crucial for the market’s growth, making treatments more accessible to patients. However, the high cost of these therapies remains a significant challenge, potentially limiting market penetration in certain regions. The continued focus on clinical trials and research efforts to further refine existing therapies and develop even more effective treatments will be key factors shaping the future landscape of the SMA medicine market. The market segmentation based on administration route, treatment type, and procedure will evolve with technological advancements and new therapeutic approaches.
Spinal Muscular Atrophy (SMA) Medicine Industry Market Report: 2019-2033
This comprehensive report provides a detailed analysis of the Spinal Muscular Atrophy (SMA) medicine market, encompassing market dynamics, growth trends, regional insights, product landscape, key players, and future outlook. The study period covers 2019-2033, with 2025 as the base and estimated year, and a forecast period of 2025-2033. The report segments the market by route of administration (oral, intrathecal), type (Type 1, Type 2, Type 3, Type 4), and procedure (gene replacement therapy, drug therapy, other procedures). This report is invaluable for pharmaceutical companies, investors, and healthcare professionals seeking a deep understanding of this rapidly evolving market. The total market size in 2025 is estimated at xx Million.
Spinal Muscular Atrophy Medicine Industry Market Dynamics & Structure
The SMA medicine market is characterized by a moderately concentrated landscape, with several key players holding significant market share. Technological innovation, particularly in gene therapy, is a major driver, alongside evolving regulatory frameworks and the increasing prevalence of SMA. Competitive pressures stem from the development of novel therapies and the emergence of biosimilars. The market is experiencing significant M&A activity, driven by companies seeking to expand their product portfolios and enhance their competitive position. The end-user demographic primarily includes children and adults with SMA and their families.
- Market Concentration: Moderately concentrated, with top 5 players holding approximately xx% of the market share in 2025.
- Technological Innovation: Gene therapy advancements and the development of novel drug therapies are key innovation drivers.
- Regulatory Landscape: Stringent regulatory approvals present a barrier to market entry but ensure patient safety.
- Competitive Landscape: Intense competition among established players and emerging biotech firms.
- M&A Activity: xx M&A deals were recorded between 2019 and 2024, indicating significant consolidation.
- Innovation Barriers: High R&D costs, lengthy clinical trials, and regulatory hurdles.
Spinal Muscular Atrophy Medicine Industry Growth Trends & Insights
The SMA medicine market exhibits robust growth, driven by increasing awareness, improved diagnostics, and the availability of effective therapies. The market is witnessing a shift towards gene therapies due to their potential for long-term efficacy. Consumer behavior is influenced by factors such as treatment accessibility, cost, and long-term outcomes. The market is projected to experience a Compound Annual Growth Rate (CAGR) of xx% during the forecast period (2025-2033), reaching an estimated xx Million by 2033. Market penetration of gene therapies is expected to increase significantly, reaching xx% by 2033 from xx% in 2025.
Dominant Regions, Countries, or Segments in Spinal Muscular Atrophy Medicine Industry
North America currently holds the largest market share, driven by high healthcare expenditure, advanced healthcare infrastructure, and early adoption of novel therapies. Within this region, the United States dominates due to its larger patient population and robust clinical trial infrastructure. The intrathecal route of administration currently holds the largest segment share, owing to its established efficacy in treating SMA. Gene replacement therapy is the fastest-growing segment, owing to its potential for a one-time cure.
- North America: High healthcare expenditure, advanced healthcare infrastructure, and early adoption of novel therapies contribute to its dominance.
- Europe: Growing awareness of SMA and supportive government initiatives are driving market growth.
- Asia Pacific: Rising prevalence of SMA, increasing healthcare expenditure, and growing awareness are expected to fuel significant market expansion.
- Intrathecal Route of Administration: Established efficacy and widespread adoption.
- Gene Replacement Therapy: Fastest-growing segment due to its potential for long-term efficacy.
Spinal Muscular Atrophy Medicine Industry Product Landscape
The SMA medicine market offers a range of therapies, including gene replacement therapies, such as Zolgensma, and oral medications like Evrysdi. These products vary in their route of administration, efficacy, and cost. Technological advancements focus on improving treatment efficacy, reducing side effects, and expanding treatment accessibility. Unique selling propositions revolve around improved efficacy, convenience, and affordability compared to existing treatments.
Key Drivers, Barriers & Challenges in Spinal Muscular Atrophy Medicine Industry
Key Drivers:
- Increasing prevalence of SMA globally.
- Technological advancements leading to novel therapies (e.g., gene therapy).
- Rising healthcare expenditure and increased insurance coverage.
Challenges & Restraints:
- High cost of treatment limiting accessibility, especially in developing countries.
- Stringent regulatory approvals resulting in lengthy timelines for drug launches.
- Potential for competition from biosimilars and other emerging treatments.
Emerging Opportunities in Spinal Muscular Atrophy Medicine Industry
- Expansion into untapped markets in developing countries.
- Development of personalized therapies tailored to specific SMA subtypes.
- Exploration of combination therapies to enhance treatment efficacy.
Growth Accelerators in the Spinal Muscular Atrophy Medicine Industry
Technological breakthroughs in gene editing and drug delivery systems are key growth accelerators. Strategic collaborations between pharmaceutical companies and research institutions are also accelerating innovation. Market expansion into emerging economies and the development of affordable therapies will further drive long-term growth.
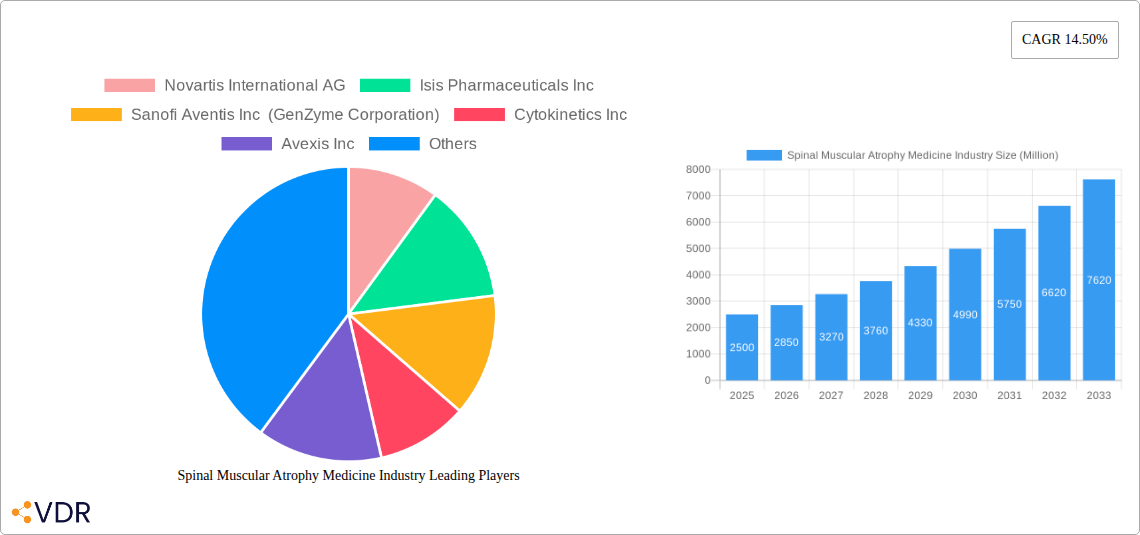
Key Players Shaping the Spinal Muscular Atrophy Medicine Industry Market
- Novartis International AG
- Isis Pharmaceuticals Inc
- Sanofi Aventis Inc (GenZyme Corporation)
- Cytokinetics Inc
- Avexis Inc
- Biogen Inc
- Catalyst Pharmaceutical
- F Hoffmann - La Roche Ltd
- Chugai Pharmaceutical
- Pfizer Inc
Notable Milestones in Spinal Muscular Atrophy Medicine Industry Sector
- August 2021: Novartis announced the lift of a partial clinical trial hold and planned to initiate a new, pivotal Phase 3 study of intrathecal OAV-101 in older patients with spinal muscular atrophy.
- July 2021: Roche launched prescription medicine Evrysdi in India, which is used for spinal muscular atrophy in adults and children aged two months and older.
In-Depth Spinal Muscular Atrophy Medicine Industry Market Outlook
The SMA medicine market is poised for significant growth, driven by ongoing innovation in gene therapy and drug development, as well as increasing global awareness of the disease. Strategic partnerships, market expansion initiatives, and the development of more accessible and affordable therapies will create substantial future opportunities for market players. The continued development of novel treatments, coupled with the growing prevalence of SMA, ensures a robust and expanding market in the coming years.
Spinal Muscular Atrophy Medicine Industry Segmentation
-
1. Type
- 1.1. Type 1
- 1.2. Type 2
- 1.3. Type 3
- 1.4. Type 4
-
2. Procedure
- 2.1. Gene Replacement Therapy
- 2.2. Drug Therapy
- 2.3. Other Procedures
-
3. Route of Administration
- 3.1. Oral
- 3.2. Intrathecal
Spinal Muscular Atrophy Medicine Industry Segmentation By Geography
-
1. North America
- 1.1. United States
- 1.2. Canada
- 1.3. Mexico
-
2. Europe
- 2.1. Germany
- 2.2. United Kingdom
- 2.3. France
- 2.4. Italy
- 2.5. Spain
- 2.6. Rest of Europe
-
3. Asia Pacific
- 3.1. China
- 3.2. Japan
- 3.3. India
- 3.4. Australia
- 3.5. South Korea
- 3.6. Rest of Asia Pacific
-
4. Middle East and Africa
- 4.1. GCC
- 4.2. South Africa
- 4.3. Rest of Middle East and Africa
-
5. South America
- 5.1. Brazil
- 5.2. Argentina
- 5.3. Rest of South America
Spinal Muscular Atrophy Medicine Industry REPORT HIGHLIGHTS
| Aspects | Details |
|---|---|
| Study Period | 2019-2033 |
| Base Year | 2024 |
| Estimated Year | 2025 |
| Forecast Period | 2025-2033 |
| Historical Period | 2019-2024 |
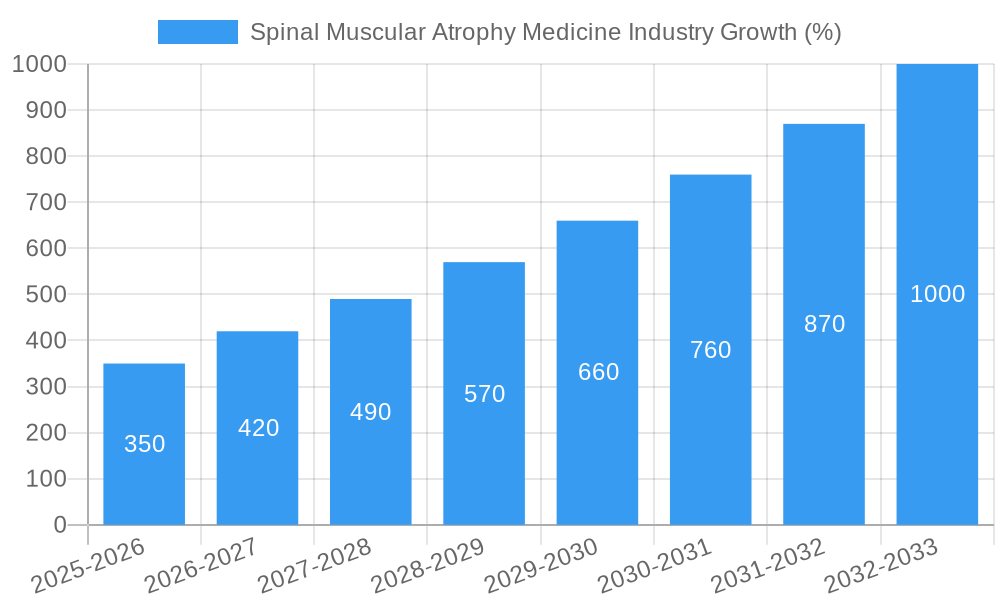
| Growth Rate | CAGR of 14.50% from 2019-2033 |
| Segmentation |
|
Table of Contents
- 1. Introduction
- 1.1. Research Scope
- 1.2. Market Segmentation
- 1.3. Research Methodology
- 1.4. Definitions and Assumptions
- 2. Executive Summary
- 2.1. Introduction
- 3. Market Dynamics
- 3.1. Introduction
- 3.2. Market Drivers
- 3.2.1 Growing Awareness Regarding Spinal Muscular Atrophy
- 3.2.2 Its Diagnostics
- 3.2.3 and Its Treatment; Rise in the Government Initiatives to Improve Healthcare Infrastructure; Increasing R&D Activities to Develop Novel Treatment Regimens for Rare Diseases
- 3.3. Market Restrains
- 3.3.1. High Cost of Treatment; Lack of Skilled Professionals for Surgical Procedures and Physiotherapy Regimens
- 3.4. Market Trends
- 3.4.1 The Gene Replacement Therapy Segment Dominates the Market
- 3.4.2 and the Same is Expected Over the Forecast Period
- 4. Market Factor Analysis
- 4.1. Porters Five Forces
- 4.2. Supply/Value Chain
- 4.3. PESTEL analysis
- 4.4. Market Entropy
- 4.5. Patent/Trademark Analysis
- 5. Global Spinal Muscular Atrophy Medicine Industry Analysis, Insights and Forecast, 2019-2031
- 5.1. Market Analysis, Insights and Forecast - by Type
- 5.1.1. Type 1
- 5.1.2. Type 2
- 5.1.3. Type 3
- 5.1.4. Type 4
- 5.2. Market Analysis, Insights and Forecast - by Procedure
- 5.2.1. Gene Replacement Therapy
- 5.2.2. Drug Therapy
- 5.2.3. Other Procedures
- 5.3. Market Analysis, Insights and Forecast - by Route of Administration
- 5.3.1. Oral
- 5.3.2. Intrathecal
- 5.4. Market Analysis, Insights and Forecast - by Region
- 5.4.1. North America
- 5.4.2. Europe
- 5.4.3. Asia Pacific
- 5.4.4. Middle East and Africa
- 5.4.5. South America
- 5.1. Market Analysis, Insights and Forecast - by Type
- 6. North America Spinal Muscular Atrophy Medicine Industry Analysis, Insights and Forecast, 2019-2031
- 6.1. Market Analysis, Insights and Forecast - by Type
- 6.1.1. Type 1
- 6.1.2. Type 2
- 6.1.3. Type 3
- 6.1.4. Type 4
- 6.2. Market Analysis, Insights and Forecast - by Procedure
- 6.2.1. Gene Replacement Therapy
- 6.2.2. Drug Therapy
- 6.2.3. Other Procedures
- 6.3. Market Analysis, Insights and Forecast - by Route of Administration
- 6.3.1. Oral
- 6.3.2. Intrathecal
- 6.1. Market Analysis, Insights and Forecast - by Type
- 7. Europe Spinal Muscular Atrophy Medicine Industry Analysis, Insights and Forecast, 2019-2031
- 7.1. Market Analysis, Insights and Forecast - by Type
- 7.1.1. Type 1
- 7.1.2. Type 2
- 7.1.3. Type 3
- 7.1.4. Type 4
- 7.2. Market Analysis, Insights and Forecast - by Procedure
- 7.2.1. Gene Replacement Therapy
- 7.2.2. Drug Therapy
- 7.2.3. Other Procedures
- 7.3. Market Analysis, Insights and Forecast - by Route of Administration
- 7.3.1. Oral
- 7.3.2. Intrathecal
- 7.1. Market Analysis, Insights and Forecast - by Type
- 8. Asia Pacific Spinal Muscular Atrophy Medicine Industry Analysis, Insights and Forecast, 2019-2031
- 8.1. Market Analysis, Insights and Forecast - by Type
- 8.1.1. Type 1
- 8.1.2. Type 2
- 8.1.3. Type 3
- 8.1.4. Type 4
- 8.2. Market Analysis, Insights and Forecast - by Procedure
- 8.2.1. Gene Replacement Therapy
- 8.2.2. Drug Therapy
- 8.2.3. Other Procedures
- 8.3. Market Analysis, Insights and Forecast - by Route of Administration
- 8.3.1. Oral
- 8.3.2. Intrathecal
- 8.1. Market Analysis, Insights and Forecast - by Type
- 9. Middle East and Africa Spinal Muscular Atrophy Medicine Industry Analysis, Insights and Forecast, 2019-2031
- 9.1. Market Analysis, Insights and Forecast - by Type
- 9.1.1. Type 1
- 9.1.2. Type 2
- 9.1.3. Type 3
- 9.1.4. Type 4
- 9.2. Market Analysis, Insights and Forecast - by Procedure
- 9.2.1. Gene Replacement Therapy
- 9.2.2. Drug Therapy
- 9.2.3. Other Procedures
- 9.3. Market Analysis, Insights and Forecast - by Route of Administration
- 9.3.1. Oral
- 9.3.2. Intrathecal
- 9.1. Market Analysis, Insights and Forecast - by Type
- 10. South America Spinal Muscular Atrophy Medicine Industry Analysis, Insights and Forecast, 2019-2031
- 10.1. Market Analysis, Insights and Forecast - by Type
- 10.1.1. Type 1
- 10.1.2. Type 2
- 10.1.3. Type 3
- 10.1.4. Type 4
- 10.2. Market Analysis, Insights and Forecast - by Procedure
- 10.2.1. Gene Replacement Therapy
- 10.2.2. Drug Therapy
- 10.2.3. Other Procedures
- 10.3. Market Analysis, Insights and Forecast - by Route of Administration
- 10.3.1. Oral
- 10.3.2. Intrathecal
- 10.1. Market Analysis, Insights and Forecast - by Type
- 11. North America Spinal Muscular Atrophy Medicine Industry Analysis, Insights and Forecast, 2019-2031
- 11.1. Market Analysis, Insights and Forecast - By Country/Sub-region
- 11.1.1 United States
- 11.1.2 Canada
- 11.1.3 Mexico
- 12. Europe Spinal Muscular Atrophy Medicine Industry Analysis, Insights and Forecast, 2019-2031
- 12.1. Market Analysis, Insights and Forecast - By Country/Sub-region
- 12.1.1 Germany
- 12.1.2 United Kingdom
- 12.1.3 France
- 12.1.4 Italy
- 12.1.5 Spain
- 12.1.6 Rest of Europe
- 13. Asia Pacific Spinal Muscular Atrophy Medicine Industry Analysis, Insights and Forecast, 2019-2031
- 13.1. Market Analysis, Insights and Forecast - By Country/Sub-region
- 13.1.1 China
- 13.1.2 Japan
- 13.1.3 India
- 13.1.4 Australia
- 13.1.5 South Korea
- 13.1.6 Rest of Asia Pacific
- 14. Middle East and Africa Spinal Muscular Atrophy Medicine Industry Analysis, Insights and Forecast, 2019-2031
- 14.1. Market Analysis, Insights and Forecast - By Country/Sub-region
- 14.1.1 GCC
- 14.1.2 South Africa
- 14.1.3 Rest of Middle East and Africa
- 15. South America Spinal Muscular Atrophy Medicine Industry Analysis, Insights and Forecast, 2019-2031
- 15.1. Market Analysis, Insights and Forecast - By Country/Sub-region
- 15.1.1 Brazil
- 15.1.2 Argentina
- 15.1.3 Rest of South America
- 16. Competitive Analysis
- 16.1. Global Market Share Analysis 2024
- 16.2. Company Profiles
- 16.2.1 Novartis International AG
- 16.2.1.1. Overview
- 16.2.1.2. Products
- 16.2.1.3. SWOT Analysis
- 16.2.1.4. Recent Developments
- 16.2.1.5. Financials (Based on Availability)
- 16.2.2 Isis Pharmaceuticals Inc
- 16.2.2.1. Overview
- 16.2.2.2. Products
- 16.2.2.3. SWOT Analysis
- 16.2.2.4. Recent Developments
- 16.2.2.5. Financials (Based on Availability)
- 16.2.3 Sanofi Aventis Inc (GenZyme Corporation)
- 16.2.3.1. Overview
- 16.2.3.2. Products
- 16.2.3.3. SWOT Analysis
- 16.2.3.4. Recent Developments
- 16.2.3.5. Financials (Based on Availability)
- 16.2.4 Cytokinetics Inc
- 16.2.4.1. Overview
- 16.2.4.2. Products
- 16.2.4.3. SWOT Analysis
- 16.2.4.4. Recent Developments
- 16.2.4.5. Financials (Based on Availability)
- 16.2.5 Avexis Inc
- 16.2.5.1. Overview
- 16.2.5.2. Products
- 16.2.5.3. SWOT Analysis
- 16.2.5.4. Recent Developments
- 16.2.5.5. Financials (Based on Availability)
- 16.2.6 Biogen Inc
- 16.2.6.1. Overview
- 16.2.6.2. Products
- 16.2.6.3. SWOT Analysis
- 16.2.6.4. Recent Developments
- 16.2.6.5. Financials (Based on Availability)
- 16.2.7 Catalyst Pharmaceutical
- 16.2.7.1. Overview
- 16.2.7.2. Products
- 16.2.7.3. SWOT Analysis
- 16.2.7.4. Recent Developments
- 16.2.7.5. Financials (Based on Availability)
- 16.2.8 F Hoffmann - La Roche Ltd
- 16.2.8.1. Overview
- 16.2.8.2. Products
- 16.2.8.3. SWOT Analysis
- 16.2.8.4. Recent Developments
- 16.2.8.5. Financials (Based on Availability)
- 16.2.9 Chugai Pharmaceutical
- 16.2.9.1. Overview
- 16.2.9.2. Products
- 16.2.9.3. SWOT Analysis
- 16.2.9.4. Recent Developments
- 16.2.9.5. Financials (Based on Availability)
- 16.2.10 Pfizer Inc
- 16.2.10.1. Overview
- 16.2.10.2. Products
- 16.2.10.3. SWOT Analysis
- 16.2.10.4. Recent Developments
- 16.2.10.5. Financials (Based on Availability)
- 16.2.1 Novartis International AG
List of Figures
- Figure 1: Global Spinal Muscular Atrophy Medicine Industry Revenue Breakdown (Million, %) by Region 2024 & 2032
- Figure 2: Global Spinal Muscular Atrophy Medicine Industry Volume Breakdown (K Unit, %) by Region 2024 & 2032
- Figure 3: North America Spinal Muscular Atrophy Medicine Industry Revenue (Million), by Country 2024 & 2032
- Figure 4: North America Spinal Muscular Atrophy Medicine Industry Volume (K Unit), by Country 2024 & 2032
- Figure 5: North America Spinal Muscular Atrophy Medicine Industry Revenue Share (%), by Country 2024 & 2032
- Figure 6: North America Spinal Muscular Atrophy Medicine Industry Volume Share (%), by Country 2024 & 2032
- Figure 7: Europe Spinal Muscular Atrophy Medicine Industry Revenue (Million), by Country 2024 & 2032
- Figure 8: Europe Spinal Muscular Atrophy Medicine Industry Volume (K Unit), by Country 2024 & 2032
- Figure 9: Europe Spinal Muscular Atrophy Medicine Industry Revenue Share (%), by Country 2024 & 2032
- Figure 10: Europe Spinal Muscular Atrophy Medicine Industry Volume Share (%), by Country 2024 & 2032
- Figure 11: Asia Pacific Spinal Muscular Atrophy Medicine Industry Revenue (Million), by Country 2024 & 2032
- Figure 12: Asia Pacific Spinal Muscular Atrophy Medicine Industry Volume (K Unit), by Country 2024 & 2032
- Figure 13: Asia Pacific Spinal Muscular Atrophy Medicine Industry Revenue Share (%), by Country 2024 & 2032
- Figure 14: Asia Pacific Spinal Muscular Atrophy Medicine Industry Volume Share (%), by Country 2024 & 2032
- Figure 15: Middle East and Africa Spinal Muscular Atrophy Medicine Industry Revenue (Million), by Country 2024 & 2032
- Figure 16: Middle East and Africa Spinal Muscular Atrophy Medicine Industry Volume (K Unit), by Country 2024 & 2032
- Figure 17: Middle East and Africa Spinal Muscular Atrophy Medicine Industry Revenue Share (%), by Country 2024 & 2032
- Figure 18: Middle East and Africa Spinal Muscular Atrophy Medicine Industry Volume Share (%), by Country 2024 & 2032
- Figure 19: South America Spinal Muscular Atrophy Medicine Industry Revenue (Million), by Country 2024 & 2032
- Figure 20: South America Spinal Muscular Atrophy Medicine Industry Volume (K Unit), by Country 2024 & 2032
- Figure 21: South America Spinal Muscular Atrophy Medicine Industry Revenue Share (%), by Country 2024 & 2032
- Figure 22: South America Spinal Muscular Atrophy Medicine Industry Volume Share (%), by Country 2024 & 2032
- Figure 23: North America Spinal Muscular Atrophy Medicine Industry Revenue (Million), by Type 2024 & 2032
- Figure 24: North America Spinal Muscular Atrophy Medicine Industry Volume (K Unit), by Type 2024 & 2032
- Figure 25: North America Spinal Muscular Atrophy Medicine Industry Revenue Share (%), by Type 2024 & 2032
- Figure 26: North America Spinal Muscular Atrophy Medicine Industry Volume Share (%), by Type 2024 & 2032
- Figure 27: North America Spinal Muscular Atrophy Medicine Industry Revenue (Million), by Procedure 2024 & 2032
- Figure 28: North America Spinal Muscular Atrophy Medicine Industry Volume (K Unit), by Procedure 2024 & 2032
- Figure 29: North America Spinal Muscular Atrophy Medicine Industry Revenue Share (%), by Procedure 2024 & 2032
- Figure 30: North America Spinal Muscular Atrophy Medicine Industry Volume Share (%), by Procedure 2024 & 2032
- Figure 31: North America Spinal Muscular Atrophy Medicine Industry Revenue (Million), by Route of Administration 2024 & 2032
- Figure 32: North America Spinal Muscular Atrophy Medicine Industry Volume (K Unit), by Route of Administration 2024 & 2032
- Figure 33: North America Spinal Muscular Atrophy Medicine Industry Revenue Share (%), by Route of Administration 2024 & 2032
- Figure 34: North America Spinal Muscular Atrophy Medicine Industry Volume Share (%), by Route of Administration 2024 & 2032
- Figure 35: North America Spinal Muscular Atrophy Medicine Industry Revenue (Million), by Country 2024 & 2032
- Figure 36: North America Spinal Muscular Atrophy Medicine Industry Volume (K Unit), by Country 2024 & 2032
- Figure 37: North America Spinal Muscular Atrophy Medicine Industry Revenue Share (%), by Country 2024 & 2032
- Figure 38: North America Spinal Muscular Atrophy Medicine Industry Volume Share (%), by Country 2024 & 2032
- Figure 39: Europe Spinal Muscular Atrophy Medicine Industry Revenue (Million), by Type 2024 & 2032
- Figure 40: Europe Spinal Muscular Atrophy Medicine Industry Volume (K Unit), by Type 2024 & 2032
- Figure 41: Europe Spinal Muscular Atrophy Medicine Industry Revenue Share (%), by Type 2024 & 2032
- Figure 42: Europe Spinal Muscular Atrophy Medicine Industry Volume Share (%), by Type 2024 & 2032
- Figure 43: Europe Spinal Muscular Atrophy Medicine Industry Revenue (Million), by Procedure 2024 & 2032
- Figure 44: Europe Spinal Muscular Atrophy Medicine Industry Volume (K Unit), by Procedure 2024 & 2032
- Figure 45: Europe Spinal Muscular Atrophy Medicine Industry Revenue Share (%), by Procedure 2024 & 2032
- Figure 46: Europe Spinal Muscular Atrophy Medicine Industry Volume Share (%), by Procedure 2024 & 2032
- Figure 47: Europe Spinal Muscular Atrophy Medicine Industry Revenue (Million), by Route of Administration 2024 & 2032
- Figure 48: Europe Spinal Muscular Atrophy Medicine Industry Volume (K Unit), by Route of Administration 2024 & 2032
- Figure 49: Europe Spinal Muscular Atrophy Medicine Industry Revenue Share (%), by Route of Administration 2024 & 2032
- Figure 50: Europe Spinal Muscular Atrophy Medicine Industry Volume Share (%), by Route of Administration 2024 & 2032
- Figure 51: Europe Spinal Muscular Atrophy Medicine Industry Revenue (Million), by Country 2024 & 2032
- Figure 52: Europe Spinal Muscular Atrophy Medicine Industry Volume (K Unit), by Country 2024 & 2032
- Figure 53: Europe Spinal Muscular Atrophy Medicine Industry Revenue Share (%), by Country 2024 & 2032
- Figure 54: Europe Spinal Muscular Atrophy Medicine Industry Volume Share (%), by Country 2024 & 2032
- Figure 55: Asia Pacific Spinal Muscular Atrophy Medicine Industry Revenue (Million), by Type 2024 & 2032
- Figure 56: Asia Pacific Spinal Muscular Atrophy Medicine Industry Volume (K Unit), by Type 2024 & 2032
- Figure 57: Asia Pacific Spinal Muscular Atrophy Medicine Industry Revenue Share (%), by Type 2024 & 2032
- Figure 58: Asia Pacific Spinal Muscular Atrophy Medicine Industry Volume Share (%), by Type 2024 & 2032
- Figure 59: Asia Pacific Spinal Muscular Atrophy Medicine Industry Revenue (Million), by Procedure 2024 & 2032
- Figure 60: Asia Pacific Spinal Muscular Atrophy Medicine Industry Volume (K Unit), by Procedure 2024 & 2032
- Figure 61: Asia Pacific Spinal Muscular Atrophy Medicine Industry Revenue Share (%), by Procedure 2024 & 2032
- Figure 62: Asia Pacific Spinal Muscular Atrophy Medicine Industry Volume Share (%), by Procedure 2024 & 2032
- Figure 63: Asia Pacific Spinal Muscular Atrophy Medicine Industry Revenue (Million), by Route of Administration 2024 & 2032
- Figure 64: Asia Pacific Spinal Muscular Atrophy Medicine Industry Volume (K Unit), by Route of Administration 2024 & 2032
- Figure 65: Asia Pacific Spinal Muscular Atrophy Medicine Industry Revenue Share (%), by Route of Administration 2024 & 2032
- Figure 66: Asia Pacific Spinal Muscular Atrophy Medicine Industry Volume Share (%), by Route of Administration 2024 & 2032
- Figure 67: Asia Pacific Spinal Muscular Atrophy Medicine Industry Revenue (Million), by Country 2024 & 2032
- Figure 68: Asia Pacific Spinal Muscular Atrophy Medicine Industry Volume (K Unit), by Country 2024 & 2032
- Figure 69: Asia Pacific Spinal Muscular Atrophy Medicine Industry Revenue Share (%), by Country 2024 & 2032
- Figure 70: Asia Pacific Spinal Muscular Atrophy Medicine Industry Volume Share (%), by Country 2024 & 2032
- Figure 71: Middle East and Africa Spinal Muscular Atrophy Medicine Industry Revenue (Million), by Type 2024 & 2032
- Figure 72: Middle East and Africa Spinal Muscular Atrophy Medicine Industry Volume (K Unit), by Type 2024 & 2032
- Figure 73: Middle East and Africa Spinal Muscular Atrophy Medicine Industry Revenue Share (%), by Type 2024 & 2032
- Figure 74: Middle East and Africa Spinal Muscular Atrophy Medicine Industry Volume Share (%), by Type 2024 & 2032
- Figure 75: Middle East and Africa Spinal Muscular Atrophy Medicine Industry Revenue (Million), by Procedure 2024 & 2032
- Figure 76: Middle East and Africa Spinal Muscular Atrophy Medicine Industry Volume (K Unit), by Procedure 2024 & 2032
- Figure 77: Middle East and Africa Spinal Muscular Atrophy Medicine Industry Revenue Share (%), by Procedure 2024 & 2032
- Figure 78: Middle East and Africa Spinal Muscular Atrophy Medicine Industry Volume Share (%), by Procedure 2024 & 2032
- Figure 79: Middle East and Africa Spinal Muscular Atrophy Medicine Industry Revenue (Million), by Route of Administration 2024 & 2032
- Figure 80: Middle East and Africa Spinal Muscular Atrophy Medicine Industry Volume (K Unit), by Route of Administration 2024 & 2032
- Figure 81: Middle East and Africa Spinal Muscular Atrophy Medicine Industry Revenue Share (%), by Route of Administration 2024 & 2032
- Figure 82: Middle East and Africa Spinal Muscular Atrophy Medicine Industry Volume Share (%), by Route of Administration 2024 & 2032
- Figure 83: Middle East and Africa Spinal Muscular Atrophy Medicine Industry Revenue (Million), by Country 2024 & 2032
- Figure 84: Middle East and Africa Spinal Muscular Atrophy Medicine Industry Volume (K Unit), by Country 2024 & 2032
- Figure 85: Middle East and Africa Spinal Muscular Atrophy Medicine Industry Revenue Share (%), by Country 2024 & 2032
- Figure 86: Middle East and Africa Spinal Muscular Atrophy Medicine Industry Volume Share (%), by Country 2024 & 2032
- Figure 87: South America Spinal Muscular Atrophy Medicine Industry Revenue (Million), by Type 2024 & 2032
- Figure 88: South America Spinal Muscular Atrophy Medicine Industry Volume (K Unit), by Type 2024 & 2032
- Figure 89: South America Spinal Muscular Atrophy Medicine Industry Revenue Share (%), by Type 2024 & 2032
- Figure 90: South America Spinal Muscular Atrophy Medicine Industry Volume Share (%), by Type 2024 & 2032
- Figure 91: South America Spinal Muscular Atrophy Medicine Industry Revenue (Million), by Procedure 2024 & 2032
- Figure 92: South America Spinal Muscular Atrophy Medicine Industry Volume (K Unit), by Procedure 2024 & 2032
- Figure 93: South America Spinal Muscular Atrophy Medicine Industry Revenue Share (%), by Procedure 2024 & 2032
- Figure 94: South America Spinal Muscular Atrophy Medicine Industry Volume Share (%), by Procedure 2024 & 2032
- Figure 95: South America Spinal Muscular Atrophy Medicine Industry Revenue (Million), by Route of Administration 2024 & 2032
- Figure 96: South America Spinal Muscular Atrophy Medicine Industry Volume (K Unit), by Route of Administration 2024 & 2032
- Figure 97: South America Spinal Muscular Atrophy Medicine Industry Revenue Share (%), by Route of Administration 2024 & 2032
- Figure 98: South America Spinal Muscular Atrophy Medicine Industry Volume Share (%), by Route of Administration 2024 & 2032
- Figure 99: South America Spinal Muscular Atrophy Medicine Industry Revenue (Million), by Country 2024 & 2032
- Figure 100: South America Spinal Muscular Atrophy Medicine Industry Volume (K Unit), by Country 2024 & 2032
- Figure 101: South America Spinal Muscular Atrophy Medicine Industry Revenue Share (%), by Country 2024 & 2032
- Figure 102: South America Spinal Muscular Atrophy Medicine Industry Volume Share (%), by Country 2024 & 2032
List of Tables
- Table 1: Global Spinal Muscular Atrophy Medicine Industry Revenue Million Forecast, by Region 2019 & 2032
- Table 2: Global Spinal Muscular Atrophy Medicine Industry Volume K Unit Forecast, by Region 2019 & 2032
- Table 3: Global Spinal Muscular Atrophy Medicine Industry Revenue Million Forecast, by Type 2019 & 2032
- Table 4: Global Spinal Muscular Atrophy Medicine Industry Volume K Unit Forecast, by Type 2019 & 2032
- Table 5: Global Spinal Muscular Atrophy Medicine Industry Revenue Million Forecast, by Procedure 2019 & 2032
- Table 6: Global Spinal Muscular Atrophy Medicine Industry Volume K Unit Forecast, by Procedure 2019 & 2032
- Table 7: Global Spinal Muscular Atrophy Medicine Industry Revenue Million Forecast, by Route of Administration 2019 & 2032
- Table 8: Global Spinal Muscular Atrophy Medicine Industry Volume K Unit Forecast, by Route of Administration 2019 & 2032
- Table 9: Global Spinal Muscular Atrophy Medicine Industry Revenue Million Forecast, by Region 2019 & 2032
- Table 10: Global Spinal Muscular Atrophy Medicine Industry Volume K Unit Forecast, by Region 2019 & 2032
- Table 11: Global Spinal Muscular Atrophy Medicine Industry Revenue Million Forecast, by Country 2019 & 2032
- Table 12: Global Spinal Muscular Atrophy Medicine Industry Volume K Unit Forecast, by Country 2019 & 2032
- Table 13: United States Spinal Muscular Atrophy Medicine Industry Revenue (Million) Forecast, by Application 2019 & 2032
- Table 14: United States Spinal Muscular Atrophy Medicine Industry Volume (K Unit) Forecast, by Application 2019 & 2032
- Table 15: Canada Spinal Muscular Atrophy Medicine Industry Revenue (Million) Forecast, by Application 2019 & 2032
- Table 16: Canada Spinal Muscular Atrophy Medicine Industry Volume (K Unit) Forecast, by Application 2019 & 2032
- Table 17: Mexico Spinal Muscular Atrophy Medicine Industry Revenue (Million) Forecast, by Application 2019 & 2032
- Table 18: Mexico Spinal Muscular Atrophy Medicine Industry Volume (K Unit) Forecast, by Application 2019 & 2032
- Table 19: Global Spinal Muscular Atrophy Medicine Industry Revenue Million Forecast, by Country 2019 & 2032
- Table 20: Global Spinal Muscular Atrophy Medicine Industry Volume K Unit Forecast, by Country 2019 & 2032
- Table 21: Germany Spinal Muscular Atrophy Medicine Industry Revenue (Million) Forecast, by Application 2019 & 2032
- Table 22: Germany Spinal Muscular Atrophy Medicine Industry Volume (K Unit) Forecast, by Application 2019 & 2032
- Table 23: United Kingdom Spinal Muscular Atrophy Medicine Industry Revenue (Million) Forecast, by Application 2019 & 2032
- Table 24: United Kingdom Spinal Muscular Atrophy Medicine Industry Volume (K Unit) Forecast, by Application 2019 & 2032
- Table 25: France Spinal Muscular Atrophy Medicine Industry Revenue (Million) Forecast, by Application 2019 & 2032
- Table 26: France Spinal Muscular Atrophy Medicine Industry Volume (K Unit) Forecast, by Application 2019 & 2032
- Table 27: Italy Spinal Muscular Atrophy Medicine Industry Revenue (Million) Forecast, by Application 2019 & 2032
- Table 28: Italy Spinal Muscular Atrophy Medicine Industry Volume (K Unit) Forecast, by Application 2019 & 2032
- Table 29: Spain Spinal Muscular Atrophy Medicine Industry Revenue (Million) Forecast, by Application 2019 & 2032
- Table 30: Spain Spinal Muscular Atrophy Medicine Industry Volume (K Unit) Forecast, by Application 2019 & 2032
- Table 31: Rest of Europe Spinal Muscular Atrophy Medicine Industry Revenue (Million) Forecast, by Application 2019 & 2032
- Table 32: Rest of Europe Spinal Muscular Atrophy Medicine Industry Volume (K Unit) Forecast, by Application 2019 & 2032
- Table 33: Global Spinal Muscular Atrophy Medicine Industry Revenue Million Forecast, by Country 2019 & 2032
- Table 34: Global Spinal Muscular Atrophy Medicine Industry Volume K Unit Forecast, by Country 2019 & 2032
- Table 35: China Spinal Muscular Atrophy Medicine Industry Revenue (Million) Forecast, by Application 2019 & 2032
- Table 36: China Spinal Muscular Atrophy Medicine Industry Volume (K Unit) Forecast, by Application 2019 & 2032
- Table 37: Japan Spinal Muscular Atrophy Medicine Industry Revenue (Million) Forecast, by Application 2019 & 2032
- Table 38: Japan Spinal Muscular Atrophy Medicine Industry Volume (K Unit) Forecast, by Application 2019 & 2032
- Table 39: India Spinal Muscular Atrophy Medicine Industry Revenue (Million) Forecast, by Application 2019 & 2032
- Table 40: India Spinal Muscular Atrophy Medicine Industry Volume (K Unit) Forecast, by Application 2019 & 2032
- Table 41: Australia Spinal Muscular Atrophy Medicine Industry Revenue (Million) Forecast, by Application 2019 & 2032
- Table 42: Australia Spinal Muscular Atrophy Medicine Industry Volume (K Unit) Forecast, by Application 2019 & 2032
- Table 43: South Korea Spinal Muscular Atrophy Medicine Industry Revenue (Million) Forecast, by Application 2019 & 2032
- Table 44: South Korea Spinal Muscular Atrophy Medicine Industry Volume (K Unit) Forecast, by Application 2019 & 2032
- Table 45: Rest of Asia Pacific Spinal Muscular Atrophy Medicine Industry Revenue (Million) Forecast, by Application 2019 & 2032
- Table 46: Rest of Asia Pacific Spinal Muscular Atrophy Medicine Industry Volume (K Unit) Forecast, by Application 2019 & 2032
- Table 47: Global Spinal Muscular Atrophy Medicine Industry Revenue Million Forecast, by Country 2019 & 2032
- Table 48: Global Spinal Muscular Atrophy Medicine Industry Volume K Unit Forecast, by Country 2019 & 2032
- Table 49: GCC Spinal Muscular Atrophy Medicine Industry Revenue (Million) Forecast, by Application 2019 & 2032
- Table 50: GCC Spinal Muscular Atrophy Medicine Industry Volume (K Unit) Forecast, by Application 2019 & 2032
- Table 51: South Africa Spinal Muscular Atrophy Medicine Industry Revenue (Million) Forecast, by Application 2019 & 2032
- Table 52: South Africa Spinal Muscular Atrophy Medicine Industry Volume (K Unit) Forecast, by Application 2019 & 2032
- Table 53: Rest of Middle East and Africa Spinal Muscular Atrophy Medicine Industry Revenue (Million) Forecast, by Application 2019 & 2032
- Table 54: Rest of Middle East and Africa Spinal Muscular Atrophy Medicine Industry Volume (K Unit) Forecast, by Application 2019 & 2032
- Table 55: Global Spinal Muscular Atrophy Medicine Industry Revenue Million Forecast, by Country 2019 & 2032
- Table 56: Global Spinal Muscular Atrophy Medicine Industry Volume K Unit Forecast, by Country 2019 & 2032
- Table 57: Brazil Spinal Muscular Atrophy Medicine Industry Revenue (Million) Forecast, by Application 2019 & 2032
- Table 58: Brazil Spinal Muscular Atrophy Medicine Industry Volume (K Unit) Forecast, by Application 2019 & 2032
- Table 59: Argentina Spinal Muscular Atrophy Medicine Industry Revenue (Million) Forecast, by Application 2019 & 2032
- Table 60: Argentina Spinal Muscular Atrophy Medicine Industry Volume (K Unit) Forecast, by Application 2019 & 2032
- Table 61: Rest of South America Spinal Muscular Atrophy Medicine Industry Revenue (Million) Forecast, by Application 2019 & 2032
- Table 62: Rest of South America Spinal Muscular Atrophy Medicine Industry Volume (K Unit) Forecast, by Application 2019 & 2032
- Table 63: Global Spinal Muscular Atrophy Medicine Industry Revenue Million Forecast, by Type 2019 & 2032
- Table 64: Global Spinal Muscular Atrophy Medicine Industry Volume K Unit Forecast, by Type 2019 & 2032
- Table 65: Global Spinal Muscular Atrophy Medicine Industry Revenue Million Forecast, by Procedure 2019 & 2032
- Table 66: Global Spinal Muscular Atrophy Medicine Industry Volume K Unit Forecast, by Procedure 2019 & 2032
- Table 67: Global Spinal Muscular Atrophy Medicine Industry Revenue Million Forecast, by Route of Administration 2019 & 2032
- Table 68: Global Spinal Muscular Atrophy Medicine Industry Volume K Unit Forecast, by Route of Administration 2019 & 2032
- Table 69: Global Spinal Muscular Atrophy Medicine Industry Revenue Million Forecast, by Country 2019 & 2032
- Table 70: Global Spinal Muscular Atrophy Medicine Industry Volume K Unit Forecast, by Country 2019 & 2032
- Table 71: United States Spinal Muscular Atrophy Medicine Industry Revenue (Million) Forecast, by Application 2019 & 2032
- Table 72: United States Spinal Muscular Atrophy Medicine Industry Volume (K Unit) Forecast, by Application 2019 & 2032
- Table 73: Canada Spinal Muscular Atrophy Medicine Industry Revenue (Million) Forecast, by Application 2019 & 2032
- Table 74: Canada Spinal Muscular Atrophy Medicine Industry Volume (K Unit) Forecast, by Application 2019 & 2032
- Table 75: Mexico Spinal Muscular Atrophy Medicine Industry Revenue (Million) Forecast, by Application 2019 & 2032
- Table 76: Mexico Spinal Muscular Atrophy Medicine Industry Volume (K Unit) Forecast, by Application 2019 & 2032
- Table 77: Global Spinal Muscular Atrophy Medicine Industry Revenue Million Forecast, by Type 2019 & 2032
- Table 78: Global Spinal Muscular Atrophy Medicine Industry Volume K Unit Forecast, by Type 2019 & 2032
- Table 79: Global Spinal Muscular Atrophy Medicine Industry Revenue Million Forecast, by Procedure 2019 & 2032
- Table 80: Global Spinal Muscular Atrophy Medicine Industry Volume K Unit Forecast, by Procedure 2019 & 2032
- Table 81: Global Spinal Muscular Atrophy Medicine Industry Revenue Million Forecast, by Route of Administration 2019 & 2032
- Table 82: Global Spinal Muscular Atrophy Medicine Industry Volume K Unit Forecast, by Route of Administration 2019 & 2032
- Table 83: Global Spinal Muscular Atrophy Medicine Industry Revenue Million Forecast, by Country 2019 & 2032
- Table 84: Global Spinal Muscular Atrophy Medicine Industry Volume K Unit Forecast, by Country 2019 & 2032
- Table 85: Germany Spinal Muscular Atrophy Medicine Industry Revenue (Million) Forecast, by Application 2019 & 2032
- Table 86: Germany Spinal Muscular Atrophy Medicine Industry Volume (K Unit) Forecast, by Application 2019 & 2032
- Table 87: United Kingdom Spinal Muscular Atrophy Medicine Industry Revenue (Million) Forecast, by Application 2019 & 2032
- Table 88: United Kingdom Spinal Muscular Atrophy Medicine Industry Volume (K Unit) Forecast, by Application 2019 & 2032
- Table 89: France Spinal Muscular Atrophy Medicine Industry Revenue (Million) Forecast, by Application 2019 & 2032
- Table 90: France Spinal Muscular Atrophy Medicine Industry Volume (K Unit) Forecast, by Application 2019 & 2032
- Table 91: Italy Spinal Muscular Atrophy Medicine Industry Revenue (Million) Forecast, by Application 2019 & 2032
- Table 92: Italy Spinal Muscular Atrophy Medicine Industry Volume (K Unit) Forecast, by Application 2019 & 2032
- Table 93: Spain Spinal Muscular Atrophy Medicine Industry Revenue (Million) Forecast, by Application 2019 & 2032
- Table 94: Spain Spinal Muscular Atrophy Medicine Industry Volume (K Unit) Forecast, by Application 2019 & 2032
- Table 95: Rest of Europe Spinal Muscular Atrophy Medicine Industry Revenue (Million) Forecast, by Application 2019 & 2032
- Table 96: Rest of Europe Spinal Muscular Atrophy Medicine Industry Volume (K Unit) Forecast, by Application 2019 & 2032
- Table 97: Global Spinal Muscular Atrophy Medicine Industry Revenue Million Forecast, by Type 2019 & 2032
- Table 98: Global Spinal Muscular Atrophy Medicine Industry Volume K Unit Forecast, by Type 2019 & 2032
- Table 99: Global Spinal Muscular Atrophy Medicine Industry Revenue Million Forecast, by Procedure 2019 & 2032
- Table 100: Global Spinal Muscular Atrophy Medicine Industry Volume K Unit Forecast, by Procedure 2019 & 2032
- Table 101: Global Spinal Muscular Atrophy Medicine Industry Revenue Million Forecast, by Route of Administration 2019 & 2032
- Table 102: Global Spinal Muscular Atrophy Medicine Industry Volume K Unit Forecast, by Route of Administration 2019 & 2032
- Table 103: Global Spinal Muscular Atrophy Medicine Industry Revenue Million Forecast, by Country 2019 & 2032
- Table 104: Global Spinal Muscular Atrophy Medicine Industry Volume K Unit Forecast, by Country 2019 & 2032
- Table 105: China Spinal Muscular Atrophy Medicine Industry Revenue (Million) Forecast, by Application 2019 & 2032
- Table 106: China Spinal Muscular Atrophy Medicine Industry Volume (K Unit) Forecast, by Application 2019 & 2032
- Table 107: Japan Spinal Muscular Atrophy Medicine Industry Revenue (Million) Forecast, by Application 2019 & 2032
- Table 108: Japan Spinal Muscular Atrophy Medicine Industry Volume (K Unit) Forecast, by Application 2019 & 2032
- Table 109: India Spinal Muscular Atrophy Medicine Industry Revenue (Million) Forecast, by Application 2019 & 2032
- Table 110: India Spinal Muscular Atrophy Medicine Industry Volume (K Unit) Forecast, by Application 2019 & 2032
- Table 111: Australia Spinal Muscular Atrophy Medicine Industry Revenue (Million) Forecast, by Application 2019 & 2032
- Table 112: Australia Spinal Muscular Atrophy Medicine Industry Volume (K Unit) Forecast, by Application 2019 & 2032
- Table 113: South Korea Spinal Muscular Atrophy Medicine Industry Revenue (Million) Forecast, by Application 2019 & 2032
- Table 114: South Korea Spinal Muscular Atrophy Medicine Industry Volume (K Unit) Forecast, by Application 2019 & 2032
- Table 115: Rest of Asia Pacific Spinal Muscular Atrophy Medicine Industry Revenue (Million) Forecast, by Application 2019 & 2032
- Table 116: Rest of Asia Pacific Spinal Muscular Atrophy Medicine Industry Volume (K Unit) Forecast, by Application 2019 & 2032
- Table 117: Global Spinal Muscular Atrophy Medicine Industry Revenue Million Forecast, by Type 2019 & 2032
- Table 118: Global Spinal Muscular Atrophy Medicine Industry Volume K Unit Forecast, by Type 2019 & 2032
- Table 119: Global Spinal Muscular Atrophy Medicine Industry Revenue Million Forecast, by Procedure 2019 & 2032
- Table 120: Global Spinal Muscular Atrophy Medicine Industry Volume K Unit Forecast, by Procedure 2019 & 2032
- Table 121: Global Spinal Muscular Atrophy Medicine Industry Revenue Million Forecast, by Route of Administration 2019 & 2032
- Table 122: Global Spinal Muscular Atrophy Medicine Industry Volume K Unit Forecast, by Route of Administration 2019 & 2032
- Table 123: Global Spinal Muscular Atrophy Medicine Industry Revenue Million Forecast, by Country 2019 & 2032
- Table 124: Global Spinal Muscular Atrophy Medicine Industry Volume K Unit Forecast, by Country 2019 & 2032
- Table 125: GCC Spinal Muscular Atrophy Medicine Industry Revenue (Million) Forecast, by Application 2019 & 2032
- Table 126: GCC Spinal Muscular Atrophy Medicine Industry Volume (K Unit) Forecast, by Application 2019 & 2032
- Table 127: South Africa Spinal Muscular Atrophy Medicine Industry Revenue (Million) Forecast, by Application 2019 & 2032
- Table 128: South Africa Spinal Muscular Atrophy Medicine Industry Volume (K Unit) Forecast, by Application 2019 & 2032
- Table 129: Rest of Middle East and Africa Spinal Muscular Atrophy Medicine Industry Revenue (Million) Forecast, by Application 2019 & 2032
- Table 130: Rest of Middle East and Africa Spinal Muscular Atrophy Medicine Industry Volume (K Unit) Forecast, by Application 2019 & 2032
- Table 131: Global Spinal Muscular Atrophy Medicine Industry Revenue Million Forecast, by Type 2019 & 2032
- Table 132: Global Spinal Muscular Atrophy Medicine Industry Volume K Unit Forecast, by Type 2019 & 2032
- Table 133: Global Spinal Muscular Atrophy Medicine Industry Revenue Million Forecast, by Procedure 2019 & 2032
- Table 134: Global Spinal Muscular Atrophy Medicine Industry Volume K Unit Forecast, by Procedure 2019 & 2032
- Table 135: Global Spinal Muscular Atrophy Medicine Industry Revenue Million Forecast, by Route of Administration 2019 & 2032
- Table 136: Global Spinal Muscular Atrophy Medicine Industry Volume K Unit Forecast, by Route of Administration 2019 & 2032
- Table 137: Global Spinal Muscular Atrophy Medicine Industry Revenue Million Forecast, by Country 2019 & 2032
- Table 138: Global Spinal Muscular Atrophy Medicine Industry Volume K Unit Forecast, by Country 2019 & 2032
- Table 139: Brazil Spinal Muscular Atrophy Medicine Industry Revenue (Million) Forecast, by Application 2019 & 2032
- Table 140: Brazil Spinal Muscular Atrophy Medicine Industry Volume (K Unit) Forecast, by Application 2019 & 2032
- Table 141: Argentina Spinal Muscular Atrophy Medicine Industry Revenue (Million) Forecast, by Application 2019 & 2032
- Table 142: Argentina Spinal Muscular Atrophy Medicine Industry Volume (K Unit) Forecast, by Application 2019 & 2032
- Table 143: Rest of South America Spinal Muscular Atrophy Medicine Industry Revenue (Million) Forecast, by Application 2019 & 2032
- Table 144: Rest of South America Spinal Muscular Atrophy Medicine Industry Volume (K Unit) Forecast, by Application 2019 & 2032
Frequently Asked Questions
1. What is the projected Compound Annual Growth Rate (CAGR) of the Spinal Muscular Atrophy Medicine Industry?
The projected CAGR is approximately 14.50%.
2. Which companies are prominent players in the Spinal Muscular Atrophy Medicine Industry?
Key companies in the market include Novartis International AG, Isis Pharmaceuticals Inc, Sanofi Aventis Inc (GenZyme Corporation), Cytokinetics Inc, Avexis Inc, Biogen Inc, Catalyst Pharmaceutical, F Hoffmann - La Roche Ltd, Chugai Pharmaceutical, Pfizer Inc.
3. What are the main segments of the Spinal Muscular Atrophy Medicine Industry?
The market segments include Type, Procedure, Route of Administration.
4. Can you provide details about the market size?
The market size is estimated to be USD XX Million as of 2022.
5. What are some drivers contributing to market growth?
Growing Awareness Regarding Spinal Muscular Atrophy. Its Diagnostics. and Its Treatment; Rise in the Government Initiatives to Improve Healthcare Infrastructure; Increasing R&D Activities to Develop Novel Treatment Regimens for Rare Diseases.
6. What are the notable trends driving market growth?
The Gene Replacement Therapy Segment Dominates the Market. and the Same is Expected Over the Forecast Period.
7. Are there any restraints impacting market growth?
High Cost of Treatment; Lack of Skilled Professionals for Surgical Procedures and Physiotherapy Regimens.
8. Can you provide examples of recent developments in the market?
In August 2021, Novartis announced the lift of a partial clinical trial hold and planned to initiate a new, pivotal Phase 3 study of intrathecal OAV-101 in older patients with spinal muscular atrophy.
9. What pricing options are available for accessing the report?
Pricing options include single-user, multi-user, and enterprise licenses priced at USD 4750, USD 5250, and USD 8750 respectively.
10. Is the market size provided in terms of value or volume?
The market size is provided in terms of value, measured in Million and volume, measured in K Unit.
11. Are there any specific market keywords associated with the report?
Yes, the market keyword associated with the report is "Spinal Muscular Atrophy Medicine Industry," which aids in identifying and referencing the specific market segment covered.
12. How do I determine which pricing option suits my needs best?
The pricing options vary based on user requirements and access needs. Individual users may opt for single-user licenses, while businesses requiring broader access may choose multi-user or enterprise licenses for cost-effective access to the report.
13. Are there any additional resources or data provided in the Spinal Muscular Atrophy Medicine Industry report?
While the report offers comprehensive insights, it's advisable to review the specific contents or supplementary materials provided to ascertain if additional resources or data are available.
14. How can I stay updated on further developments or reports in the Spinal Muscular Atrophy Medicine Industry?
To stay informed about further developments, trends, and reports in the Spinal Muscular Atrophy Medicine Industry, consider subscribing to industry newsletters, following relevant companies and organizations, or regularly checking reputable industry news sources and publications.
Methodology
Step 1 - Identification of Relevant Samples Size from Population Database


Step 2 - Approaches for Defining Global Market Size (Value, Volume* & Price*)

Note*: In applicable scenarios
Step 3 - Data Sources
Primary Research
- Web Analytics
- Survey Reports
- Research Institute
- Latest Research Reports
- Opinion Leaders
Secondary Research
- Annual Reports
- White Paper
- Latest Press Release
- Industry Association
- Paid Database
- Investor Presentations

Step 4 - Data Triangulation
Involves using different sources of information in order to increase the validity of a study
These sources are likely to be stakeholders in a program - participants, other researchers, program staff, other community members, and so on.
Then we put all data in single framework & apply various statistical tools to find out the dynamic on the market.
During the analysis stage, feedback from the stakeholder groups would be compared to determine areas of agreement as well as areas of divergence


