


Key Insights for Specialty Insurance Market
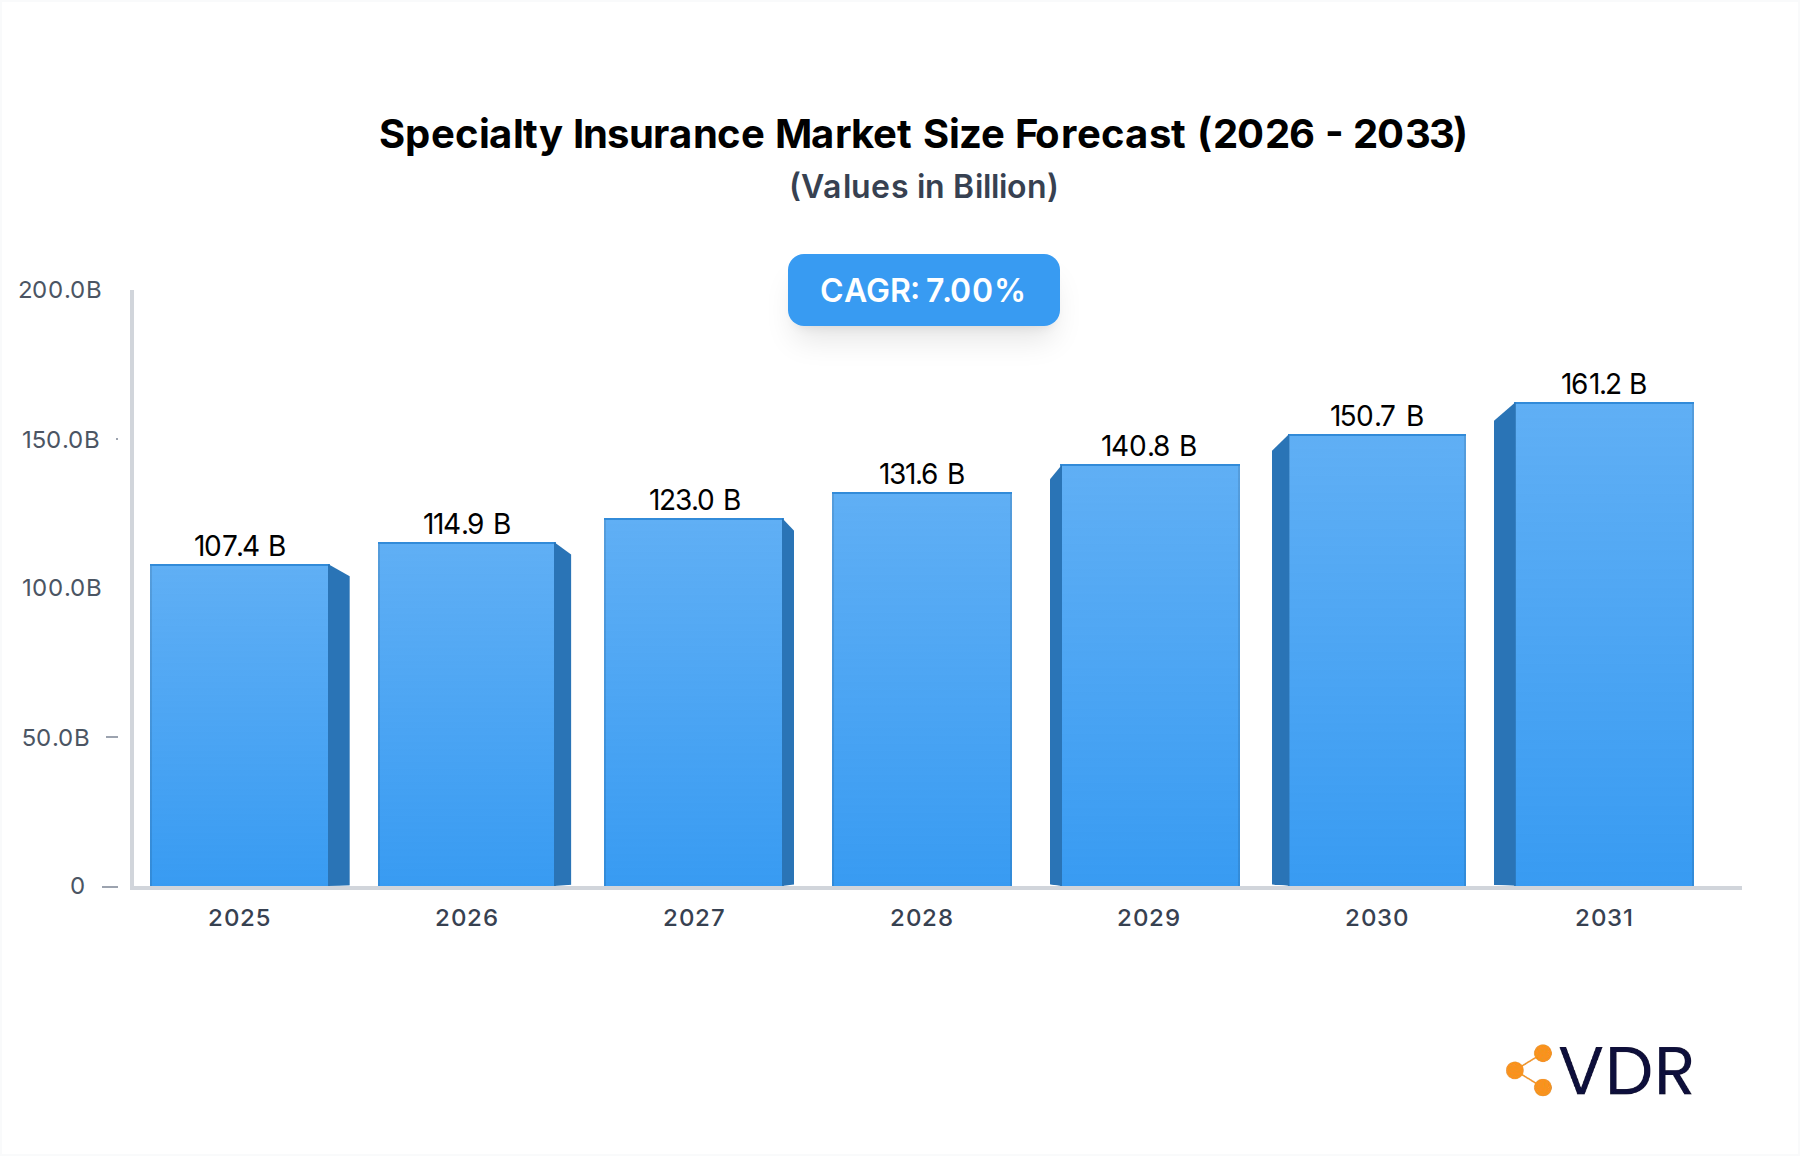
The Global Specialty Insurance Market is a critical and dynamically evolving segment within the broader financial services industry, focused on underwriting unique, complex, and often high-risk exposures that fall outside the scope of standard insurance products. Valued at an estimated $100.4 billion in 2024, this market is projected to expand significantly, achieving a robust Compound Annual Growth Rate (CAGR) of 7% over the forecast period to reach approximately $161.3 billion by 2031. This substantial growth trajectory is underpinned by a confluence of demand drivers and macro tailwinds, reflecting an increasing global need for bespoke risk transfer solutions.
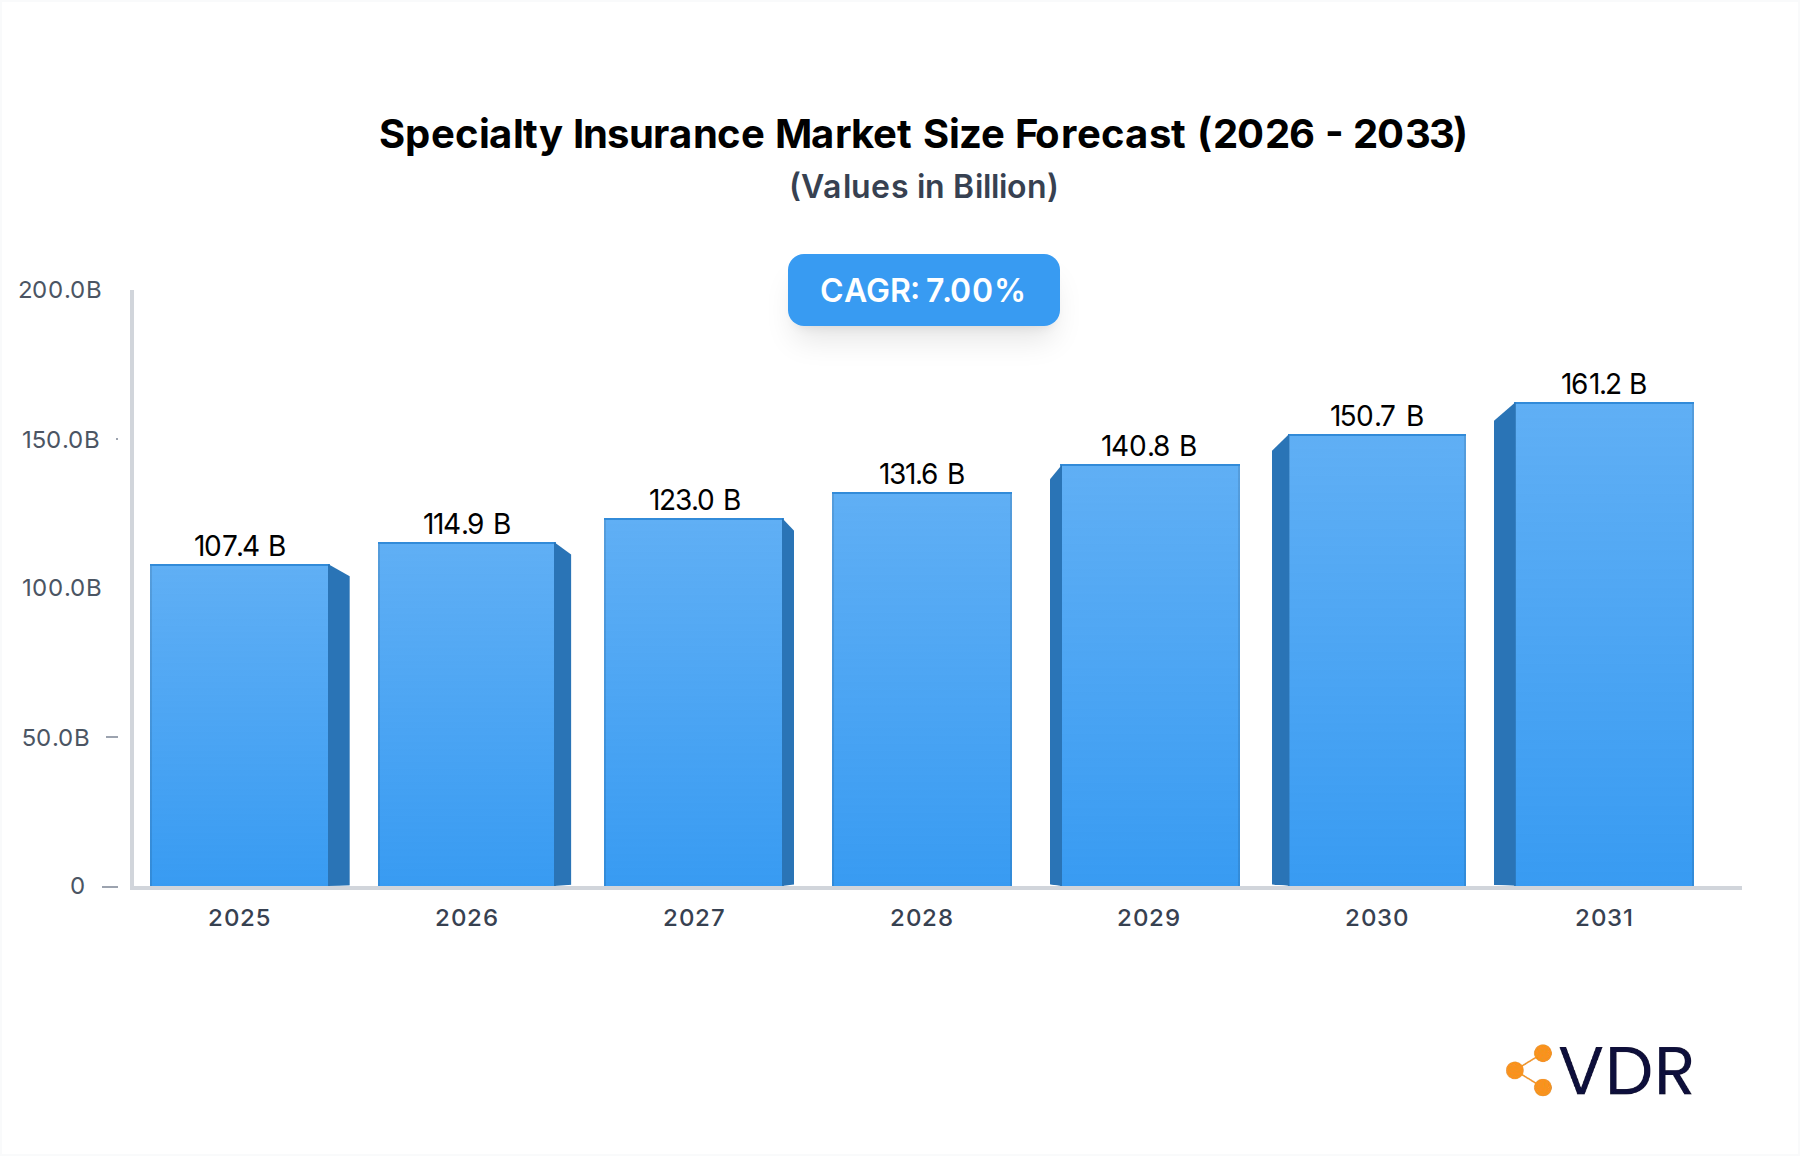
Specialty Insurance Market Size (In Billion)

Key demand drivers include the escalating complexity of global risks, ranging from sophisticated cyber threats and supply chain vulnerabilities to geopolitical instability and climate-related perils. The rapid pace of technological innovation, particularly in areas like artificial intelligence, drone technology, and space exploration, continuously generates novel risk categories that necessitate highly specialized underwriting expertise. Furthermore, increasingly stringent regulatory environments across various sectors, such as data privacy (e.g., GDPR, CCPA), environmental protection, and industry-specific safety standards, compel enterprises to secure tailored coverage to ensure compliance and mitigate potential liabilities. The expansion of specialized industries, including aerospace and defense, marine and shipping, energy and utilities, and advanced manufacturing, inherently fuels the demand for niche insurance products designed to address their unique operational and liability profiles.
Specialty Insurance Company Market Share
Macroeconomic tailwinds such as ongoing globalization, the digitalization of business operations, and a heightened corporate awareness of enterprise risk management further contribute to market expansion. As businesses navigate an interconnected yet volatile global landscape, the strategic importance of comprehensive, specialized insurance protection becomes paramount. The market's forward-looking outlook points towards continued innovation in product development, a deepening of underwriting expertise, and strategic consolidation among leading carriers. The integration of advanced analytics, artificial intelligence, and blockchain technologies is expected to enhance risk assessment capabilities, streamline claims processing, and improve overall operational efficiency, thereby sustaining the vibrant growth of the Specialty Insurance Market.
Cyber Liability Insurance Dominance in Specialty Insurance Market
Within the diverse landscape of the Specialty Insurance Market, Cyber Liability Insurance has emerged as a particularly dominant segment, commanding a significant and rapidly expanding share of the revenue. While granular, segment-specific revenue data is proprietary, industry analysis consistently positions cyber insurance at the forefront of growth and demand dueriven by the escalating frequency and sophistication of cyber-attacks globally. This segment's dominance is directly attributable to the pervasive digital transformation across all industries and the corresponding increase in exposure to data breaches, ransomware attacks, business interruption from cyber events, and regulatory penalties related to data security. Businesses of all sizes, from large enterprises to small and medium-sized enterprises (SMEs), are recognizing the critical need for robust cyber protection, transcending traditional Property and Casualty Insurance Market offerings.
The imperative to secure Cyber Liability Insurance Market coverage stems from several critical factors. Firstly, the financial ramifications of a cyber incident can be catastrophic, encompassing direct costs such as incident response, forensic investigations, data recovery, and legal fees, alongside indirect costs like reputational damage and loss of customer trust. Secondly, the patchwork of global data protection regulations mandates that organizations safeguard sensitive information, with non-compliance often leading to substantial fines and legal liabilities. Coverage often extends to regulatory defense costs, fines, and civil damages, making it an indispensable tool for compliance. Thirdly, the complexity of managing cyber risk in-house, coupled with the evolving nature of threats, positions insurers as expert partners capable of providing both financial protection and pre-emptive risk management services.
Key players in this space include market leaders such as AIG, Chubb, Allianz, and AXA XL, who have heavily invested in developing sophisticated underwriting models and specialized cyber incident response teams. These insurers often offer comprehensive packages that include not only financial indemnification but also access to cybersecurity experts, legal counsel, and public relations support in the event of an attack. The segment is characterized by rapid product innovation, with policies continually adapting to cover emerging risks like supply chain cyber exposures, deepfake liabilities, and advanced persistent threats. While large enterprises represent a substantial portion of the premium volume, the growing awareness and affordability of tailored solutions for SMEs are broadening the market base. The competitive landscape for Cyber Liability Insurance Market is intense, with established carriers vying with new entrants and Insurtech Market players offering specialized platforms and services. This intense competition, combined with rising demand, drives both innovation and, at times, pricing volatility, as underwriters grapple with accurately assessing and pricing this relatively new and constantly evolving risk category. The segment’s growth is expected to continue outstripping many other specialty lines, further solidifying its dominant position within the Specialty Insurance Market.
Driving Factors and Constraints in Specialty Insurance Market
The Specialty Insurance Market's trajectory is shaped by a nuanced interplay of powerful growth drivers and inherent constraints, each influencing its expansion and operational dynamics. A primary driver is the accelerating complexity of global risks, necessitating bespoke solutions. For instance, the escalating volume and sophistication of cyber threats, evident in the rising global cost of data breaches (projected to reach trillions of dollars annually), directly fuel the demand for Cyber Liability Insurance Market. Similarly, the increasing frequency and intensity of natural catastrophe events due to climate change create a higher demand for specialized property and business interruption coverage beyond standard policies, particularly in exposed regions mentioned within the North America and Asia Pacific market segments.
Technological advancements represent another significant catalyst. The proliferation of drones, autonomous vehicles, and advanced robotics, as well as the nascent but rapidly evolving space economy, generates entirely new risk categories that traditional insurers are ill-equipped to underwrite. This creates fertile ground for specialized carriers focusing on Aerospace & Defense and Transportation & Logistics segments. Moreover, stricter regulatory environments across diverse sectors, such as enhanced environmental protection laws impacting the Energy & Utilities Market and stringent medical liability rules within the Healthcare & Life Sciences Market, compel businesses to procure highly specific and often mandatory insurance products to avoid significant penalties and legal challenges.
Conversely, several constraints temper the market's growth. One significant hurdle is the high capital requirement for underwriting specialized and often volatile risks. Insurers must maintain substantial capital reserves to cover potentially large and infrequent losses, which can act as a barrier to entry for new players and limit the risk appetite of existing ones. The scarcity of historical loss data for emerging risks, such as those related to artificial intelligence or advanced biotechnology, poses a significant challenge for actuaries in accurately pricing premiums and assessing exposure. This data gap can lead to conservative underwriting or, conversely, underpriced risks that erode profitability. Furthermore, the specialized nature often translates to a smaller pool of potential clients for any given niche, making market penetration and scale more challenging than in the mass-market Property and Casualty Insurance Market. Intense competition among a growing number of specialized carriers can also lead to pricing pressures, particularly in more mature segments like certain aspects of the Ocean Marine Insurance Market, impacting profitability despite demand. Economic downturns can also constrain growth as businesses may reduce discretionary insurance spending, impacting premium volumes for specialized lines.
Competitive Ecosystem of Specialty Insurance Market
The Specialty Insurance Market is characterized by a diverse and highly competitive ecosystem, comprising both global giants with specialized divisions and nimble, niche underwriters focused on specific risk categories. The landscape demands deep underwriting expertise, robust capital reserves, and innovative product development to address complex and evolving risks. Below are key players shaping this market:
- AIG: A global insurance leader, AIG offers extensive specialty insurance solutions across various lines including aerospace, environmental, and cyber, leveraging its broad network and deep underwriting capabilities to serve complex client needs.
- Chubb: Recognized for its superior underwriting and diverse product portfolio, Chubb is a significant player in specialty lines such as cyber, marine, and errors & omissions, catering to high-net-worth clients and specialized industries.
- Zurich Insurance Group: This global insurer provides a comprehensive range of specialty coverages, particularly strong in areas like political risk, engineering, and energy insurance, supported by a vast international presence.
- Allianz: As one of the world's largest insurers, Allianz operates robust specialty divisions focusing on segments like marine, aviation, and entertainment insurance, emphasizing tailored risk solutions for complex global operations.
- AXA XL: A dedicated division of AXA, AXA XL specializes in property, casualty, and specialty risks, with particular strengths in marine, aviation, energy, and complex casualty lines for large corporate clients.
- Munich Re: A leading global reinsurer, Munich Re plays a crucial role in the specialty market by providing essential reinsurance capacity and expertise for primary insurers underwriting highly specialized and catastrophic risks.
- Swiss Re: Another major global reinsurer, Swiss Re offers significant capital and risk transfer solutions to direct insurers in the specialty sector, including innovative products for climate risk and emerging exposures.
- The Hartford: A prominent provider of commercial insurance in the U.S., The Hartford offers specialty coverages for industries such as technology, healthcare, and financial services, combining industry-specific expertise with comprehensive protection.
- Travelers: Known for its broad commercial lines offerings, Travelers also has a strong presence in various specialty segments, including professional liability, marine, and construction, serving businesses with unique risk profiles.
- Liberty Mutual: This global insurer provides a wide array of specialty products through its various brands, covering complex risks in areas like commercial marine, energy, and surety, with a focus on client-centric solutions.
- Tokio Marine Holdings: A leading Japanese insurance group with a strong international footprint, Tokio Marine offers a range of specialty insurance, particularly in marine, energy, and cyber lines, reflecting its global reach and diverse portfolio.
- Lloyd's of London: A unique insurance market, Lloyd's is the epicenter for many specialty risks, providing unparalleled capacity and expertise for complex, unusual, and emerging perils through its syndicate structure.
- Sompo Holdings: A major Japanese insurance company, Sompo Holdings is expanding its specialty presence globally, offering solutions in areas like cyber and professional lines, leveraging its financial strength and international network.
- Others: This category includes a multitude of regional specialists, Insurtech Market startups, and boutique underwriters focusing on ultra-niche segments, contributing to the market's dynamic and fragmented nature.
Recent Developments & Milestones in Specialty Insurance Market
The Specialty Insurance Market is in a constant state of evolution, driven by new risk landscapes, technological advancements, and shifting client needs. Recent milestones highlight the industry's agility and innovation:
- February 2024: Several major insurers announced the launch of enhanced cyber insurance products, incorporating advanced pre-breach services, broader business interruption coverage, and specific modules for supply chain cyber risks, reflecting the escalating threat landscape and the growing demand for Cyber Liability Insurance Market solutions.
- November 2023: A consortium of leading underwriters and technology firms unveiled a new blockchain-based platform for Ocean Marine Insurance Market, aiming to streamline policy administration, claims processing, and data exchange, thereby reducing operational costs and enhancing transparency within the traditionally complex marine insurance sector.
- August 2023: Major carriers in the Commercial Auto Insurance Market introduced usage-based insurance (UBI) programs for commercial fleets, leveraging telematics data to offer customized premiums and promote safer driving practices, marking a significant shift towards data-driven underwriting in this segment.
- May 2023: Insurers with significant exposure to the Energy & Utilities sector partnered with climate risk modeling firms to develop more precise underwriting tools for renewable energy projects, including coverage for unique operational risks associated with wind farms and solar installations, reflecting a proactive approach to supporting the green transition.
- March 2023: Regulatory bodies across Europe and North America initiated discussions and pilot programs for new frameworks governing Artificial Intelligence (AI) liability insurance, signaling an anticipated need for specialized coverage as AI adoption grows across various industries, including the Healthcare & Life Sciences Market and Manufacturing Market.
- January 2023: A series of strategic partnerships between traditional insurers and Insurtech Market startups were announced, focusing on leveraging AI and machine learning for enhanced risk assessment, personalized policy generation, and expedited claims handling in niche specialty lines, accelerating digital transformation across the market.
- October 2022: Leading reinsurers reported significant capital deployment towards developing parametric insurance solutions for agricultural and climate-related risks, offering rapid payouts based on predefined triggers (e.g., rainfall levels, wind speeds) rather than actual loss assessments, enhancing resilience in vulnerable sectors.
Regional Market Breakdown for Specialty Insurance Market
The global Specialty Insurance Market exhibits distinct regional dynamics, influenced by varying economic development, regulatory frameworks, risk exposure profiles, and industry concentration. While precise regional CAGR and market share data for every sub-segment can vary, a general overview reveals key trends across major geographical blocs.
North America holds the largest revenue share in the Specialty Insurance Market, primarily driven by the United States. This dominance is attributable to a highly developed financial sector, a complex regulatory environment, and a high concentration of technologically advanced industries that generate unique and sophisticated risks. The demand for Cyber Liability Insurance Market, professional liability, and environmental insurance is particularly strong in this region. Canada and Mexico also contribute, with Canada showing steady growth in professional lines and energy-related coverages. North America is a mature market, characterized by intense competition among established players and continuous innovation in product offerings, particularly in tailored solutions for the Healthcare & Life Sciences Market and the technology sector.
Europe represents another significant market, closely following North America in terms of market share. Countries like the United Kingdom (especially with Lloyd's of London), Germany, and France are key contributors. The region's diverse economies, stringent regulatory landscape (e.g., GDPR impacting cyber liability), and exposure to global trade (driving Ocean Marine Insurance Market) fuel demand. Europe shows strong growth in professional indemnity, D&O, and specialized environmental liability insurance. The presence of major global insurers and reinsurers in the region also ensures robust underwriting capacity and expertise.
Asia Pacific is recognized as the fastest-growing region in the Specialty Insurance Market. Countries such as China, India, Japan, and South Korea are experiencing rapid industrialization, urbanization, and technological adoption, leading to an increased demand for specialized coverage. The expansion of manufacturing bases, infrastructure projects, and a growing middle class contribute to the growth of various specialty lines, including project cargo, construction all-risk, and increasingly, cyber and professional liability insurance. The Manufacturing Market is a particular driver for specialty solutions across this region. While starting from a smaller base, its substantial economic growth and increasing risk awareness position it for continued high CAGR.
Middle East & Africa is an emerging market for specialty insurance. The Middle East, particularly the GCC countries, sees demand driven by large-scale infrastructure development, significant oil & gas operations, and a burgeoning construction sector, requiring specialized energy, marine, and construction-related insurance. South Africa is a key market in Africa, with growing demand for niche coverages. However, political instability and economic volatility in some parts of the region can present challenges. The demand here is often tied to large-scale, capital-intensive projects.
South America also presents growth opportunities, albeit with varying degrees of maturity across countries. Brazil and Argentina are notable markets, with demand influenced by agricultural risks, infrastructure development, and growing international trade. The region experiences a demand for specialized political risk, crop insurance, and Commercial Auto Insurance Market solutions for large fleets. Overall, the regional landscape underscores the global nature of complex risks and the localized need for specialized insurance expertise.
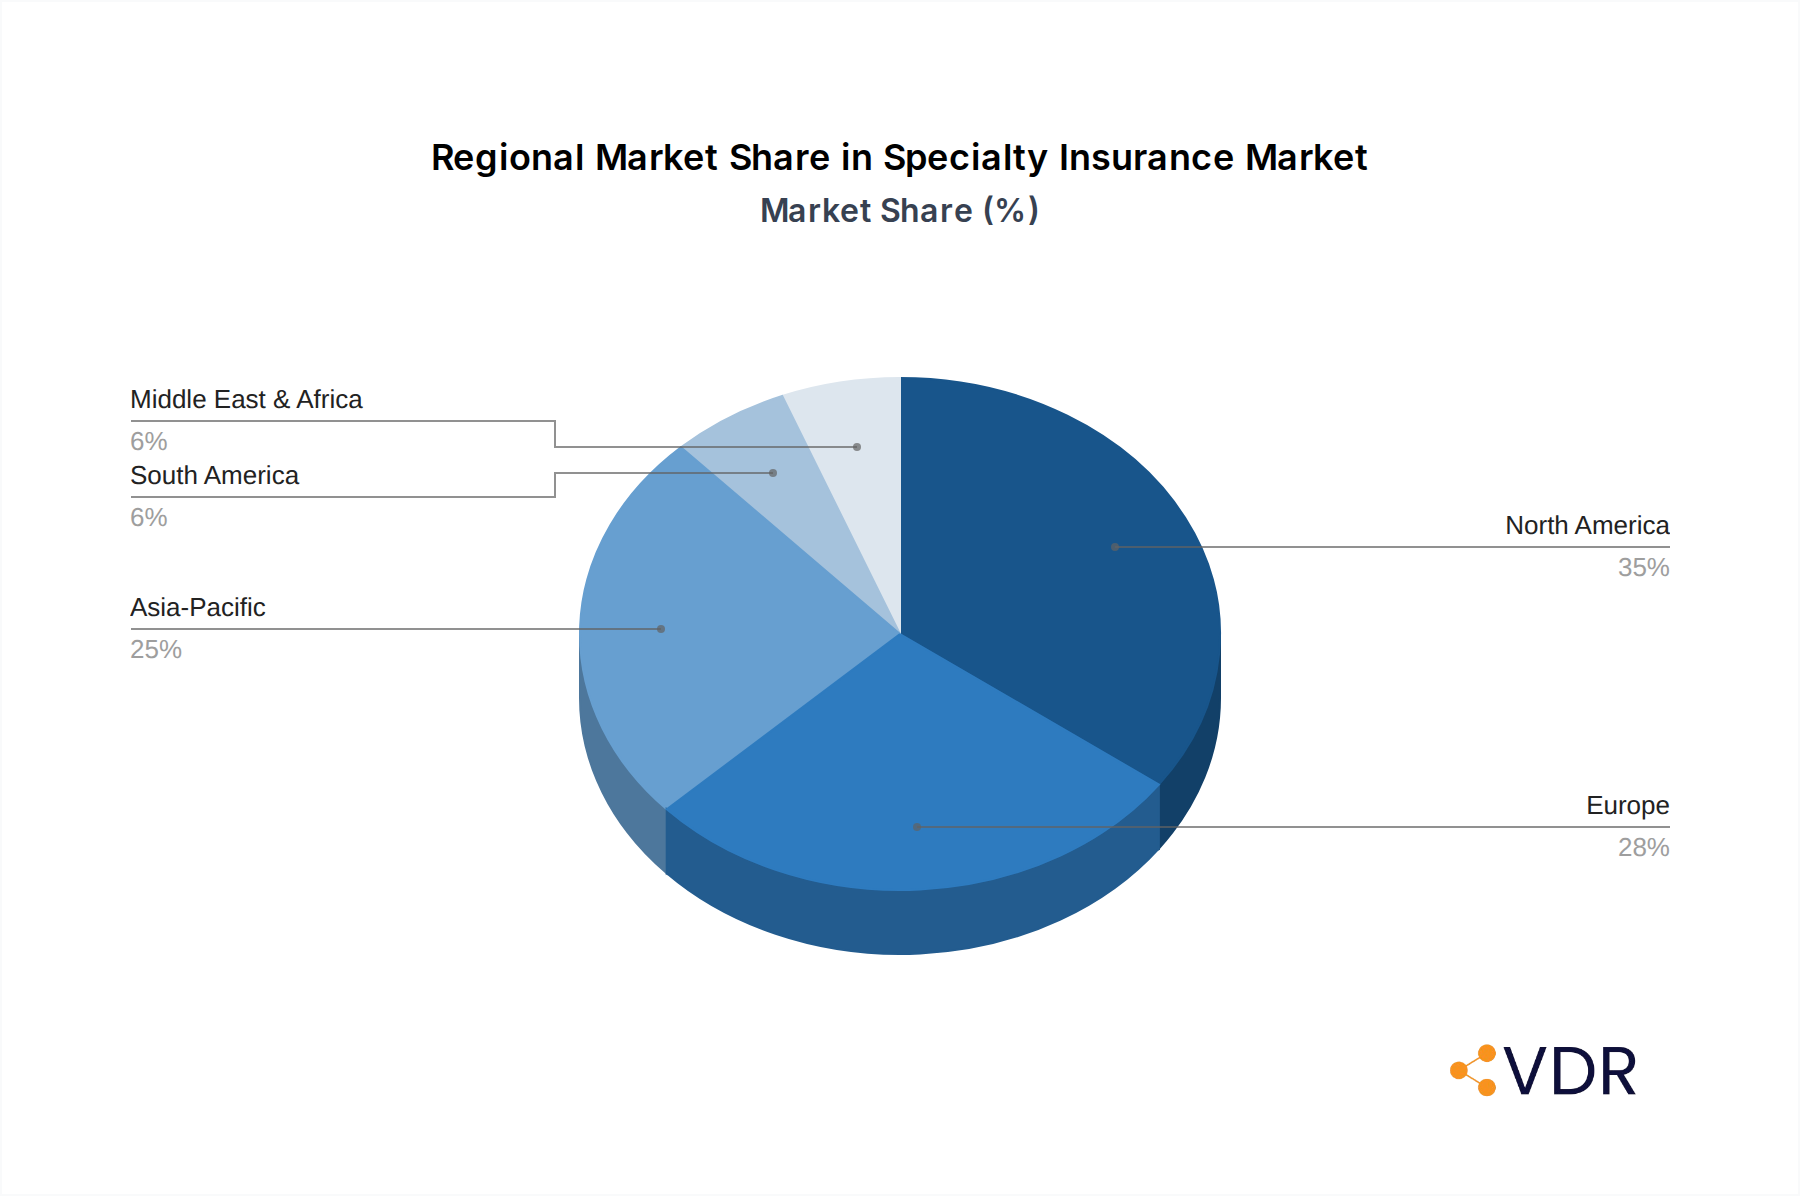
Specialty Insurance Regional Market Share
Supply Chain & Raw Material Dynamics for Specialty Insurance Market
The "supply chain" for the Specialty Insurance Market is conceptual, focusing on the flow of critical information, expertise, and capital rather than physical goods. Upstream dependencies are crucial. Key inputs include high-fidelity underwriting data, advanced actuarial models, and specialized Risk Management Software Market solutions. Data providers, including cybersecurity firms, catastrophe modelers, and industry-specific risk consultants, form a vital upstream component. The sourcing risks revolve around the accuracy, timeliness, and proprietary nature of this data. For instance, obtaining granular data on emerging risks like those related to autonomous vehicles or space exploration is challenging, creating an information asymmetry that can affect pricing and risk assessment. Price volatility of these key inputs is less about raw material costs and more about the cost of specialized talent, data subscription fees, and intellectual property licenses for proprietary models. Significant investment in R&D for advanced analytics and artificial intelligence platforms by technology vendors directly impacts the cost base for insurers.
Another critical upstream dependency is reinsurance capacity. Specialty insurers often offload a portion of their highly concentrated or catastrophic risks to reinsurers like Munich Re and Swiss Re. The price and availability of reinsurance capacity can be volatile, especially after periods of high insured losses (e.g., major natural catastrophes or widespread cyber-attacks), directly impacting the primary specialty insurer's ability to underwrite new business or retain existing lines profitably. Reinsurance market hardening, characterized by higher rates and more restrictive terms, directly translates to increased costs for direct specialty insurers, which are then passed on to policyholders.
Supply chain disruptions, in the traditional sense, can manifest as disruptions in the flow of essential services or data. For example, a widespread cyberattack impacting a critical data vendor or a major Insurtech Market platform could impede underwriting operations or claims processing across multiple insurers. Historically, major events like the 9/11 attacks or large-scale natural disasters (e.g., Hurricane Katrina) led to significant hardening of the Property and Casualty Insurance Market and specialty lines, driving up reinsurance costs and tightening underwriting standards. These events underscored the interconnectedness of risk and the importance of diversified capital sources and robust risk transfer mechanisms within the specialty insurance ecosystem. The "raw materials" for specialty insurance, while intangible, are thus critically sensitive to market intelligence, technological innovation, and global risk events.
Customer Segmentation & Buying Behavior in Specialty Insurance Market
The customer base for the Specialty Insurance Market is highly segmented, driven by distinct risk profiles, enterprise sizes, and industry-specific requirements. End-user industries, as outlined in the report data, such as BFSI, Healthcare & Life Sciences Market, Manufacturing Market, Energy & Utilities, Construction & Infrastructure, Transportation & Logistics, and Aerospace & Defense, each present unique purchasing criteria.
For Large Enterprises, the primary purchasing criteria revolve around comprehensive, highly customized coverage that addresses complex, global risks. These entities often have dedicated risk management departments that prioritize deep underwriting expertise, global claims handling capabilities, and value-added services such as loss prevention consulting. Price sensitivity, while present, is often secondary to the breadth of coverage, the financial strength of the insurer, and the insurer's reputation for claims efficiency and specialized knowledge. Procurement for large enterprises predominantly occurs through experienced Brokers & Agents, who act as crucial intermediaries, negotiating complex terms and structuring bespoke programs.
Small & Medium Enterprises (SMEs), on the other hand, exhibit a different buying behavior. While they also seek specialized protection, their purchasing decisions are often more price-sensitive and focused on essential coverages that protect against common, yet potentially crippling, risks (e.g., basic Cyber Liability Insurance Market for data protection, professional liability for service firms). Ease of access, clarity of policy terms, and competitive pricing are significant drivers. SMEs are increasingly utilizing Digital Platforms for procurement, seeking streamlined applications and transparent pricing. Direct Sales channels are also gaining traction, particularly for more standardized specialty products tailored to common SME needs.
Across all segments, a notable shift in buyer preference is towards integrated risk management solutions rather than standalone insurance policies. Customers are increasingly looking for insurers who can offer not just risk transfer but also proactive risk mitigation advice, data analytics for risk exposure, and responsive incident management services. The demand for insurers with deep industry vertical expertise is rising, as businesses prefer partners who understand the nuances of their operations and regulatory landscape. The perceived value of an insurer's Risk Management Software Market capabilities and its ability to provide tailored, preventative solutions is becoming a key differentiator, influencing procurement channel selection and overall buying decisions. This trend is accelerating the adoption of Insurtech Market solutions and pushing traditional carriers to enhance their digital offerings and advisory services.
Specialty Insurance Segmentation
-
1. Type
- 1.1. Ocean Marine Insurance
- 1.2. Commercial Auto Insurance
- 1.3. Flood Insurance
- 1.4. Pet Insurance
- 1.5. Wedding Insurance
- 1.6. Jewelry Insurance
- 1.7. Cyber Liability Insurance
- 1.8. Commercial Umbrella Insurance
- 1.9. Others
-
2. Enterprise Size
- 2.1. Large Enterprises
- 2.2. Small & Medium Enterprises (SMEs)
-
3. Distribution Channel
- 3.1. Direct Sales
- 3.2. Brokers & Agents
- 3.3. Bancassurance
- 3.4. Digital Platforms
-
4. End User Industry
- 4.1. BFSI
- 4.2. Healthcare & Life Sciences
- 4.3. Manufacturing
- 4.4. Energy & Utilities
- 4.5. Construction & Infrastructure
- 4.6. Transportation & Logistics
- 4.7. Aerospace & Defense
- 4.8. Marine & Shipping
- 4.9. Others
Specialty Insurance Segmentation By Geography
-
1. North America
- 1.1. United States
- 1.2. Canada
- 1.3. Mexico
-
2. South America
- 2.1. Brazil
- 2.2. Argentina
- 2.3. Rest of South America
-
3. Europe
- 3.1. United Kingdom
- 3.2. Germany
- 3.3. France
- 3.4. Italy
- 3.5. Spain
- 3.6. Russia
- 3.7. Benelux
- 3.8. Nordics
- 3.9. Rest of Europe
-
4. Middle East & Africa
- 4.1. Turkey
- 4.2. Israel
- 4.3. GCC
- 4.4. North Africa
- 4.5. South Africa
- 4.6. Rest of Middle East & Africa
-
5. Asia Pacific
- 5.1. China
- 5.2. India
- 5.3. Japan
- 5.4. South Korea
- 5.5. ASEAN
- 5.6. Oceania
- 5.7. Rest of Asia Pacific
Specialty Insurance Regional Market Share
Geographic Coverage of Specialty Insurance
Specialty Insurance REPORT HIGHLIGHTS
| Aspects | Details |
|---|---|
| Study Period | 2020-2034 |
| Base Year | 2025 |
| Estimated Year | 2026 |
| Forecast Period | 2026-2034 |
| Historical Period | 2020-2025 |
| Growth Rate | CAGR of 7% from 2020-2034 |
| Segmentation |
|
Table of Contents
- 1. Introduction
- 1.1. Research Scope
- 1.2. Market Segmentation
- 1.3. Research Objective
- 1.4. Definitions and Assumptions
- 2. Executive Summary
- 2.1. Market Snapshot
- 3. Market Dynamics
- 3.1. Market Drivers
- 3.2. Market Restrains
- 3.3. Market Trends
- 3.4. Market Opportunities
- 4. Market Factor Analysis
- 4.1. Porters Five Forces
- 4.1.1. Bargaining Power of Suppliers
- 4.1.2. Bargaining Power of Buyers
- 4.1.3. Threat of New Entrants
- 4.1.4. Threat of Substitutes
- 4.1.5. Competitive Rivalry
- 4.2. PESTEL analysis
- 4.3. BCG Analysis
- 4.3.1. Stars (High Growth, High Market Share)
- 4.3.2. Cash Cows (Low Growth, High Market Share)
- 4.3.3. Question Mark (High Growth, Low Market Share)
- 4.3.4. Dogs (Low Growth, Low Market Share)
- 4.4. Ansoff Matrix Analysis
- 4.5. Supply Chain Analysis
- 4.6. Regulatory Landscape
- 4.7. Current Market Potential and Opportunity Assessment (TAM–SAM–SOM Framework)
- 4.8. VDR Analyst Note
- 4.1. Porters Five Forces
- 5. Market Analysis, Insights and Forecast 2021-2033
- 5.1. Market Analysis, Insights and Forecast - by Type
- 5.1.1. Ocean Marine Insurance
- 5.1.2. Commercial Auto Insurance
- 5.1.3. Flood Insurance
- 5.1.4. Pet Insurance
- 5.1.5. Wedding Insurance
- 5.1.6. Jewelry Insurance
- 5.1.7. Cyber Liability Insurance
- 5.1.8. Commercial Umbrella Insurance
- 5.1.9. Others
- 5.2. Market Analysis, Insights and Forecast - by Enterprise Size
- 5.2.1. Large Enterprises
- 5.2.2. Small & Medium Enterprises (SMEs)
- 5.3. Market Analysis, Insights and Forecast - by Distribution Channel
- 5.3.1. Direct Sales
- 5.3.2. Brokers & Agents
- 5.3.3. Bancassurance
- 5.3.4. Digital Platforms
- 5.4. Market Analysis, Insights and Forecast - by End User Industry
- 5.4.1. BFSI
- 5.4.2. Healthcare & Life Sciences
- 5.4.3. Manufacturing
- 5.4.4. Energy & Utilities
- 5.4.5. Construction & Infrastructure
- 5.4.6. Transportation & Logistics
- 5.4.7. Aerospace & Defense
- 5.4.8. Marine & Shipping
- 5.4.9. Others
- 5.5. Market Analysis, Insights and Forecast - by Region
- 5.5.1. North America
- 5.5.2. South America
- 5.5.3. Europe
- 5.5.4. Middle East & Africa
- 5.5.5. Asia Pacific
- 5.1. Market Analysis, Insights and Forecast - by Type
- 6. Global Specialty Insurance Analysis, Insights and Forecast, 2021-2033
- 6.1. Market Analysis, Insights and Forecast - by Type
- 6.1.1. Ocean Marine Insurance
- 6.1.2. Commercial Auto Insurance
- 6.1.3. Flood Insurance
- 6.1.4. Pet Insurance
- 6.1.5. Wedding Insurance
- 6.1.6. Jewelry Insurance
- 6.1.7. Cyber Liability Insurance
- 6.1.8. Commercial Umbrella Insurance
- 6.1.9. Others
- 6.2. Market Analysis, Insights and Forecast - by Enterprise Size
- 6.2.1. Large Enterprises
- 6.2.2. Small & Medium Enterprises (SMEs)
- 6.3. Market Analysis, Insights and Forecast - by Distribution Channel
- 6.3.1. Direct Sales
- 6.3.2. Brokers & Agents
- 6.3.3. Bancassurance
- 6.3.4. Digital Platforms
- 6.4. Market Analysis, Insights and Forecast - by End User Industry
- 6.4.1. BFSI
- 6.4.2. Healthcare & Life Sciences
- 6.4.3. Manufacturing
- 6.4.4. Energy & Utilities
- 6.4.5. Construction & Infrastructure
- 6.4.6. Transportation & Logistics
- 6.4.7. Aerospace & Defense
- 6.4.8. Marine & Shipping
- 6.4.9. Others
- 6.1. Market Analysis, Insights and Forecast - by Type
- 7. North America Specialty Insurance Analysis, Insights and Forecast, 2021-2033
- 7.1. Market Analysis, Insights and Forecast - by Type
- 7.1.1. Ocean Marine Insurance
- 7.1.2. Commercial Auto Insurance
- 7.1.3. Flood Insurance
- 7.1.4. Pet Insurance
- 7.1.5. Wedding Insurance
- 7.1.6. Jewelry Insurance
- 7.1.7. Cyber Liability Insurance
- 7.1.8. Commercial Umbrella Insurance
- 7.1.9. Others
- 7.2. Market Analysis, Insights and Forecast - by Enterprise Size
- 7.2.1. Large Enterprises
- 7.2.2. Small & Medium Enterprises (SMEs)
- 7.3. Market Analysis, Insights and Forecast - by Distribution Channel
- 7.3.1. Direct Sales
- 7.3.2. Brokers & Agents
- 7.3.3. Bancassurance
- 7.3.4. Digital Platforms
- 7.4. Market Analysis, Insights and Forecast - by End User Industry
- 7.4.1. BFSI
- 7.4.2. Healthcare & Life Sciences
- 7.4.3. Manufacturing
- 7.4.4. Energy & Utilities
- 7.4.5. Construction & Infrastructure
- 7.4.6. Transportation & Logistics
- 7.4.7. Aerospace & Defense
- 7.4.8. Marine & Shipping
- 7.4.9. Others
- 7.1. Market Analysis, Insights and Forecast - by Type
- 8. South America Specialty Insurance Analysis, Insights and Forecast, 2021-2033
- 8.1. Market Analysis, Insights and Forecast - by Type
- 8.1.1. Ocean Marine Insurance
- 8.1.2. Commercial Auto Insurance
- 8.1.3. Flood Insurance
- 8.1.4. Pet Insurance
- 8.1.5. Wedding Insurance
- 8.1.6. Jewelry Insurance
- 8.1.7. Cyber Liability Insurance
- 8.1.8. Commercial Umbrella Insurance
- 8.1.9. Others
- 8.2. Market Analysis, Insights and Forecast - by Enterprise Size
- 8.2.1. Large Enterprises
- 8.2.2. Small & Medium Enterprises (SMEs)
- 8.3. Market Analysis, Insights and Forecast - by Distribution Channel
- 8.3.1. Direct Sales
- 8.3.2. Brokers & Agents
- 8.3.3. Bancassurance
- 8.3.4. Digital Platforms
- 8.4. Market Analysis, Insights and Forecast - by End User Industry
- 8.4.1. BFSI
- 8.4.2. Healthcare & Life Sciences
- 8.4.3. Manufacturing
- 8.4.4. Energy & Utilities
- 8.4.5. Construction & Infrastructure
- 8.4.6. Transportation & Logistics
- 8.4.7. Aerospace & Defense
- 8.4.8. Marine & Shipping
- 8.4.9. Others
- 8.1. Market Analysis, Insights and Forecast - by Type
- 9. Europe Specialty Insurance Analysis, Insights and Forecast, 2021-2033
- 9.1. Market Analysis, Insights and Forecast - by Type
- 9.1.1. Ocean Marine Insurance
- 9.1.2. Commercial Auto Insurance
- 9.1.3. Flood Insurance
- 9.1.4. Pet Insurance
- 9.1.5. Wedding Insurance
- 9.1.6. Jewelry Insurance
- 9.1.7. Cyber Liability Insurance
- 9.1.8. Commercial Umbrella Insurance
- 9.1.9. Others
- 9.2. Market Analysis, Insights and Forecast - by Enterprise Size
- 9.2.1. Large Enterprises
- 9.2.2. Small & Medium Enterprises (SMEs)
- 9.3. Market Analysis, Insights and Forecast - by Distribution Channel
- 9.3.1. Direct Sales
- 9.3.2. Brokers & Agents
- 9.3.3. Bancassurance
- 9.3.4. Digital Platforms
- 9.4. Market Analysis, Insights and Forecast - by End User Industry
- 9.4.1. BFSI
- 9.4.2. Healthcare & Life Sciences
- 9.4.3. Manufacturing
- 9.4.4. Energy & Utilities
- 9.4.5. Construction & Infrastructure
- 9.4.6. Transportation & Logistics
- 9.4.7. Aerospace & Defense
- 9.4.8. Marine & Shipping
- 9.4.9. Others
- 9.1. Market Analysis, Insights and Forecast - by Type
- 10. Middle East & Africa Specialty Insurance Analysis, Insights and Forecast, 2021-2033
- 10.1. Market Analysis, Insights and Forecast - by Type
- 10.1.1. Ocean Marine Insurance
- 10.1.2. Commercial Auto Insurance
- 10.1.3. Flood Insurance
- 10.1.4. Pet Insurance
- 10.1.5. Wedding Insurance
- 10.1.6. Jewelry Insurance
- 10.1.7. Cyber Liability Insurance
- 10.1.8. Commercial Umbrella Insurance
- 10.1.9. Others
- 10.2. Market Analysis, Insights and Forecast - by Enterprise Size
- 10.2.1. Large Enterprises
- 10.2.2. Small & Medium Enterprises (SMEs)
- 10.3. Market Analysis, Insights and Forecast - by Distribution Channel
- 10.3.1. Direct Sales
- 10.3.2. Brokers & Agents
- 10.3.3. Bancassurance
- 10.3.4. Digital Platforms
- 10.4. Market Analysis, Insights and Forecast - by End User Industry
- 10.4.1. BFSI
- 10.4.2. Healthcare & Life Sciences
- 10.4.3. Manufacturing
- 10.4.4. Energy & Utilities
- 10.4.5. Construction & Infrastructure
- 10.4.6. Transportation & Logistics
- 10.4.7. Aerospace & Defense
- 10.4.8. Marine & Shipping
- 10.4.9. Others
- 10.1. Market Analysis, Insights and Forecast - by Type
- 11. Asia Pacific Specialty Insurance Analysis, Insights and Forecast, 2021-2033
- 11.1. Market Analysis, Insights and Forecast - by Type
- 11.1.1. Ocean Marine Insurance
- 11.1.2. Commercial Auto Insurance
- 11.1.3. Flood Insurance
- 11.1.4. Pet Insurance
- 11.1.5. Wedding Insurance
- 11.1.6. Jewelry Insurance
- 11.1.7. Cyber Liability Insurance
- 11.1.8. Commercial Umbrella Insurance
- 11.1.9. Others
- 11.2. Market Analysis, Insights and Forecast - by Enterprise Size
- 11.2.1. Large Enterprises
- 11.2.2. Small & Medium Enterprises (SMEs)
- 11.3. Market Analysis, Insights and Forecast - by Distribution Channel
- 11.3.1. Direct Sales
- 11.3.2. Brokers & Agents
- 11.3.3. Bancassurance
- 11.3.4. Digital Platforms
- 11.4. Market Analysis, Insights and Forecast - by End User Industry
- 11.4.1. BFSI
- 11.4.2. Healthcare & Life Sciences
- 11.4.3. Manufacturing
- 11.4.4. Energy & Utilities
- 11.4.5. Construction & Infrastructure
- 11.4.6. Transportation & Logistics
- 11.4.7. Aerospace & Defense
- 11.4.8. Marine & Shipping
- 11.4.9. Others
- 11.1. Market Analysis, Insights and Forecast - by Type
- 12. Competitive Analysis
- 12.1. Company Profiles
- 12.1.1 AIG
- 12.1.1.1. Company Overview
- 12.1.1.2. Products
- 12.1.1.3. Company Financials
- 12.1.1.4. SWOT Analysis
- 12.1.2 Chubb
- 12.1.2.1. Company Overview
- 12.1.2.2. Products
- 12.1.2.3. Company Financials
- 12.1.2.4. SWOT Analysis
- 12.1.3 Zurich Insurance Group
- 12.1.3.1. Company Overview
- 12.1.3.2. Products
- 12.1.3.3. Company Financials
- 12.1.3.4. SWOT Analysis
- 12.1.4 Allianz
- 12.1.4.1. Company Overview
- 12.1.4.2. Products
- 12.1.4.3. Company Financials
- 12.1.4.4. SWOT Analysis
- 12.1.5 AXA XL
- 12.1.5.1. Company Overview
- 12.1.5.2. Products
- 12.1.5.3. Company Financials
- 12.1.5.4. SWOT Analysis
- 12.1.6 Munich Re
- 12.1.6.1. Company Overview
- 12.1.6.2. Products
- 12.1.6.3. Company Financials
- 12.1.6.4. SWOT Analysis
- 12.1.7 Swiss Re
- 12.1.7.1. Company Overview
- 12.1.7.2. Products
- 12.1.7.3. Company Financials
- 12.1.7.4. SWOT Analysis
- 12.1.8 The Hartford
- 12.1.8.1. Company Overview
- 12.1.8.2. Products
- 12.1.8.3. Company Financials
- 12.1.8.4. SWOT Analysis
- 12.1.9 Travelers
- 12.1.9.1. Company Overview
- 12.1.9.2. Products
- 12.1.9.3. Company Financials
- 12.1.9.4. SWOT Analysis
- 12.1.10 Liberty Mutual
- 12.1.10.1. Company Overview
- 12.1.10.2. Products
- 12.1.10.3. Company Financials
- 12.1.10.4. SWOT Analysis
- 12.1.11 Tokio Marine Holdings
- 12.1.11.1. Company Overview
- 12.1.11.2. Products
- 12.1.11.3. Company Financials
- 12.1.11.4. SWOT Analysis
- 12.1.12 Lloyd's of London
- 12.1.12.1. Company Overview
- 12.1.12.2. Products
- 12.1.12.3. Company Financials
- 12.1.12.4. SWOT Analysis
- 12.1.13 Sompo Holdings
- 12.1.13.1. Company Overview
- 12.1.13.2. Products
- 12.1.13.3. Company Financials
- 12.1.13.4. SWOT Analysis
- 12.1.14 Others
- 12.1.14.1. Company Overview
- 12.1.14.2. Products
- 12.1.14.3. Company Financials
- 12.1.14.4. SWOT Analysis
- 12.1.1 AIG
- 12.2. Market Entropy
- 12.2.1 Company's Key Areas Served
- 12.2.2 Recent Developments
- 12.3. Company Market Share Analysis 2025
- 12.3.1 Top 5 Companies Market Share Analysis
- 12.3.2 Top 3 Companies Market Share Analysis
- 12.4. List of Potential Customers
- 13. Research Methodology
List of Figures
- Figure 1: Global Specialty Insurance Revenue Breakdown (billion, %) by Region 2025 & 2033
- Figure 2: North America Specialty Insurance Revenue (billion), by Type 2025 & 2033
- Figure 3: North America Specialty Insurance Revenue Share (%), by Type 2025 & 2033
- Figure 4: North America Specialty Insurance Revenue (billion), by Enterprise Size 2025 & 2033
- Figure 5: North America Specialty Insurance Revenue Share (%), by Enterprise Size 2025 & 2033
- Figure 6: North America Specialty Insurance Revenue (billion), by Distribution Channel 2025 & 2033
- Figure 7: North America Specialty Insurance Revenue Share (%), by Distribution Channel 2025 & 2033
- Figure 8: North America Specialty Insurance Revenue (billion), by End User Industry 2025 & 2033
- Figure 9: North America Specialty Insurance Revenue Share (%), by End User Industry 2025 & 2033
- Figure 10: North America Specialty Insurance Revenue (billion), by Country 2025 & 2033
- Figure 11: North America Specialty Insurance Revenue Share (%), by Country 2025 & 2033
- Figure 12: South America Specialty Insurance Revenue (billion), by Type 2025 & 2033
- Figure 13: South America Specialty Insurance Revenue Share (%), by Type 2025 & 2033
- Figure 14: South America Specialty Insurance Revenue (billion), by Enterprise Size 2025 & 2033
- Figure 15: South America Specialty Insurance Revenue Share (%), by Enterprise Size 2025 & 2033
- Figure 16: South America Specialty Insurance Revenue (billion), by Distribution Channel 2025 & 2033
- Figure 17: South America Specialty Insurance Revenue Share (%), by Distribution Channel 2025 & 2033
- Figure 18: South America Specialty Insurance Revenue (billion), by End User Industry 2025 & 2033
- Figure 19: South America Specialty Insurance Revenue Share (%), by End User Industry 2025 & 2033
- Figure 20: South America Specialty Insurance Revenue (billion), by Country 2025 & 2033
- Figure 21: South America Specialty Insurance Revenue Share (%), by Country 2025 & 2033
- Figure 22: Europe Specialty Insurance Revenue (billion), by Type 2025 & 2033
- Figure 23: Europe Specialty Insurance Revenue Share (%), by Type 2025 & 2033
- Figure 24: Europe Specialty Insurance Revenue (billion), by Enterprise Size 2025 & 2033
- Figure 25: Europe Specialty Insurance Revenue Share (%), by Enterprise Size 2025 & 2033
- Figure 26: Europe Specialty Insurance Revenue (billion), by Distribution Channel 2025 & 2033
- Figure 27: Europe Specialty Insurance Revenue Share (%), by Distribution Channel 2025 & 2033
- Figure 28: Europe Specialty Insurance Revenue (billion), by End User Industry 2025 & 2033
- Figure 29: Europe Specialty Insurance Revenue Share (%), by End User Industry 2025 & 2033
- Figure 30: Europe Specialty Insurance Revenue (billion), by Country 2025 & 2033
- Figure 31: Europe Specialty Insurance Revenue Share (%), by Country 2025 & 2033
- Figure 32: Middle East & Africa Specialty Insurance Revenue (billion), by Type 2025 & 2033
- Figure 33: Middle East & Africa Specialty Insurance Revenue Share (%), by Type 2025 & 2033
- Figure 34: Middle East & Africa Specialty Insurance Revenue (billion), by Enterprise Size 2025 & 2033
- Figure 35: Middle East & Africa Specialty Insurance Revenue Share (%), by Enterprise Size 2025 & 2033
- Figure 36: Middle East & Africa Specialty Insurance Revenue (billion), by Distribution Channel 2025 & 2033
- Figure 37: Middle East & Africa Specialty Insurance Revenue Share (%), by Distribution Channel 2025 & 2033
- Figure 38: Middle East & Africa Specialty Insurance Revenue (billion), by End User Industry 2025 & 2033
- Figure 39: Middle East & Africa Specialty Insurance Revenue Share (%), by End User Industry 2025 & 2033
- Figure 40: Middle East & Africa Specialty Insurance Revenue (billion), by Country 2025 & 2033
- Figure 41: Middle East & Africa Specialty Insurance Revenue Share (%), by Country 2025 & 2033
- Figure 42: Asia Pacific Specialty Insurance Revenue (billion), by Type 2025 & 2033
- Figure 43: Asia Pacific Specialty Insurance Revenue Share (%), by Type 2025 & 2033
- Figure 44: Asia Pacific Specialty Insurance Revenue (billion), by Enterprise Size 2025 & 2033
- Figure 45: Asia Pacific Specialty Insurance Revenue Share (%), by Enterprise Size 2025 & 2033
- Figure 46: Asia Pacific Specialty Insurance Revenue (billion), by Distribution Channel 2025 & 2033
- Figure 47: Asia Pacific Specialty Insurance Revenue Share (%), by Distribution Channel 2025 & 2033
- Figure 48: Asia Pacific Specialty Insurance Revenue (billion), by End User Industry 2025 & 2033
- Figure 49: Asia Pacific Specialty Insurance Revenue Share (%), by End User Industry 2025 & 2033
- Figure 50: Asia Pacific Specialty Insurance Revenue (billion), by Country 2025 & 2033
- Figure 51: Asia Pacific Specialty Insurance Revenue Share (%), by Country 2025 & 2033
List of Tables
- Table 1: Global Specialty Insurance Revenue billion Forecast, by Type 2020 & 2033
- Table 2: Global Specialty Insurance Revenue billion Forecast, by Enterprise Size 2020 & 2033
- Table 3: Global Specialty Insurance Revenue billion Forecast, by Distribution Channel 2020 & 2033
- Table 4: Global Specialty Insurance Revenue billion Forecast, by End User Industry 2020 & 2033
- Table 5: Global Specialty Insurance Revenue billion Forecast, by Region 2020 & 2033
- Table 6: Global Specialty Insurance Revenue billion Forecast, by Type 2020 & 2033
- Table 7: Global Specialty Insurance Revenue billion Forecast, by Enterprise Size 2020 & 2033
- Table 8: Global Specialty Insurance Revenue billion Forecast, by Distribution Channel 2020 & 2033
- Table 9: Global Specialty Insurance Revenue billion Forecast, by End User Industry 2020 & 2033
- Table 10: Global Specialty Insurance Revenue billion Forecast, by Country 2020 & 2033
- Table 11: United States Specialty Insurance Revenue (billion) Forecast, by Application 2020 & 2033
- Table 12: Canada Specialty Insurance Revenue (billion) Forecast, by Application 2020 & 2033
- Table 13: Mexico Specialty Insurance Revenue (billion) Forecast, by Application 2020 & 2033
- Table 14: Global Specialty Insurance Revenue billion Forecast, by Type 2020 & 2033
- Table 15: Global Specialty Insurance Revenue billion Forecast, by Enterprise Size 2020 & 2033
- Table 16: Global Specialty Insurance Revenue billion Forecast, by Distribution Channel 2020 & 2033
- Table 17: Global Specialty Insurance Revenue billion Forecast, by End User Industry 2020 & 2033
- Table 18: Global Specialty Insurance Revenue billion Forecast, by Country 2020 & 2033
- Table 19: Brazil Specialty Insurance Revenue (billion) Forecast, by Application 2020 & 2033
- Table 20: Argentina Specialty Insurance Revenue (billion) Forecast, by Application 2020 & 2033
- Table 21: Rest of South America Specialty Insurance Revenue (billion) Forecast, by Application 2020 & 2033
- Table 22: Global Specialty Insurance Revenue billion Forecast, by Type 2020 & 2033
- Table 23: Global Specialty Insurance Revenue billion Forecast, by Enterprise Size 2020 & 2033
- Table 24: Global Specialty Insurance Revenue billion Forecast, by Distribution Channel 2020 & 2033
- Table 25: Global Specialty Insurance Revenue billion Forecast, by End User Industry 2020 & 2033
- Table 26: Global Specialty Insurance Revenue billion Forecast, by Country 2020 & 2033
- Table 27: United Kingdom Specialty Insurance Revenue (billion) Forecast, by Application 2020 & 2033
- Table 28: Germany Specialty Insurance Revenue (billion) Forecast, by Application 2020 & 2033
- Table 29: France Specialty Insurance Revenue (billion) Forecast, by Application 2020 & 2033
- Table 30: Italy Specialty Insurance Revenue (billion) Forecast, by Application 2020 & 2033
- Table 31: Spain Specialty Insurance Revenue (billion) Forecast, by Application 2020 & 2033
- Table 32: Russia Specialty Insurance Revenue (billion) Forecast, by Application 2020 & 2033
- Table 33: Benelux Specialty Insurance Revenue (billion) Forecast, by Application 2020 & 2033
- Table 34: Nordics Specialty Insurance Revenue (billion) Forecast, by Application 2020 & 2033
- Table 35: Rest of Europe Specialty Insurance Revenue (billion) Forecast, by Application 2020 & 2033
- Table 36: Global Specialty Insurance Revenue billion Forecast, by Type 2020 & 2033
- Table 37: Global Specialty Insurance Revenue billion Forecast, by Enterprise Size 2020 & 2033
- Table 38: Global Specialty Insurance Revenue billion Forecast, by Distribution Channel 2020 & 2033
- Table 39: Global Specialty Insurance Revenue billion Forecast, by End User Industry 2020 & 2033
- Table 40: Global Specialty Insurance Revenue billion Forecast, by Country 2020 & 2033
- Table 41: Turkey Specialty Insurance Revenue (billion) Forecast, by Application 2020 & 2033
- Table 42: Israel Specialty Insurance Revenue (billion) Forecast, by Application 2020 & 2033
- Table 43: GCC Specialty Insurance Revenue (billion) Forecast, by Application 2020 & 2033
- Table 44: North Africa Specialty Insurance Revenue (billion) Forecast, by Application 2020 & 2033
- Table 45: South Africa Specialty Insurance Revenue (billion) Forecast, by Application 2020 & 2033
- Table 46: Rest of Middle East & Africa Specialty Insurance Revenue (billion) Forecast, by Application 2020 & 2033
- Table 47: Global Specialty Insurance Revenue billion Forecast, by Type 2020 & 2033
- Table 48: Global Specialty Insurance Revenue billion Forecast, by Enterprise Size 2020 & 2033
- Table 49: Global Specialty Insurance Revenue billion Forecast, by Distribution Channel 2020 & 2033
- Table 50: Global Specialty Insurance Revenue billion Forecast, by End User Industry 2020 & 2033
- Table 51: Global Specialty Insurance Revenue billion Forecast, by Country 2020 & 2033
- Table 52: China Specialty Insurance Revenue (billion) Forecast, by Application 2020 & 2033
- Table 53: India Specialty Insurance Revenue (billion) Forecast, by Application 2020 & 2033
- Table 54: Japan Specialty Insurance Revenue (billion) Forecast, by Application 2020 & 2033
- Table 55: South Korea Specialty Insurance Revenue (billion) Forecast, by Application 2020 & 2033
- Table 56: ASEAN Specialty Insurance Revenue (billion) Forecast, by Application 2020 & 2033
- Table 57: Oceania Specialty Insurance Revenue (billion) Forecast, by Application 2020 & 2033
- Table 58: Rest of Asia Pacific Specialty Insurance Revenue (billion) Forecast, by Application 2020 & 2033
Frequently Asked Questions
1. What is the projected Compound Annual Growth Rate (CAGR) of the Specialty Insurance?
The projected CAGR is approximately 7%.
2. Which companies are prominent players in the Specialty Insurance?
Key companies in the market include AIG, Chubb, Zurich Insurance Group, Allianz, AXA XL, Munich Re, Swiss Re, The Hartford, Travelers, Liberty Mutual, Tokio Marine Holdings, Lloyd's of London, Sompo Holdings, Others.
3. What are the main segments of the Specialty Insurance?
The market segments include Type, Enterprise Size, Distribution Channel, End User Industry.
4. Can you provide details about the market size?
The market size is estimated to be USD 100.4 billion as of 2022.
5. What are some drivers contributing to market growth?
N/A
6. What are the notable trends driving market growth?
N/A
7. Are there any restraints impacting market growth?
N/A
8. Can you provide examples of recent developments in the market?
N/A
9. What pricing options are available for accessing the report?
Pricing options include single-user, multi-user, and enterprise licenses priced at USD 2900.00, USD 4350.00, and USD 5800.00 respectively.
10. Is the market size provided in terms of value or volume?
The market size is provided in terms of value, measured in billion.
11. Are there any specific market keywords associated with the report?
Yes, the market keyword associated with the report is "Specialty Insurance," which aids in identifying and referencing the specific market segment covered.
12. How do I determine which pricing option suits my needs best?
The pricing options vary based on user requirements and access needs. Individual users may opt for single-user licenses, while businesses requiring broader access may choose multi-user or enterprise licenses for cost-effective access to the report.
13. Are there any additional resources or data provided in the Specialty Insurance report?
While the report offers comprehensive insights, it's advisable to review the specific contents or supplementary materials provided to ascertain if additional resources or data are available.
14. How can I stay updated on further developments or reports in the Specialty Insurance?
To stay informed about further developments, trends, and reports in the Specialty Insurance, consider subscribing to industry newsletters, following relevant companies and organizations, or regularly checking reputable industry news sources and publications.
Methodology
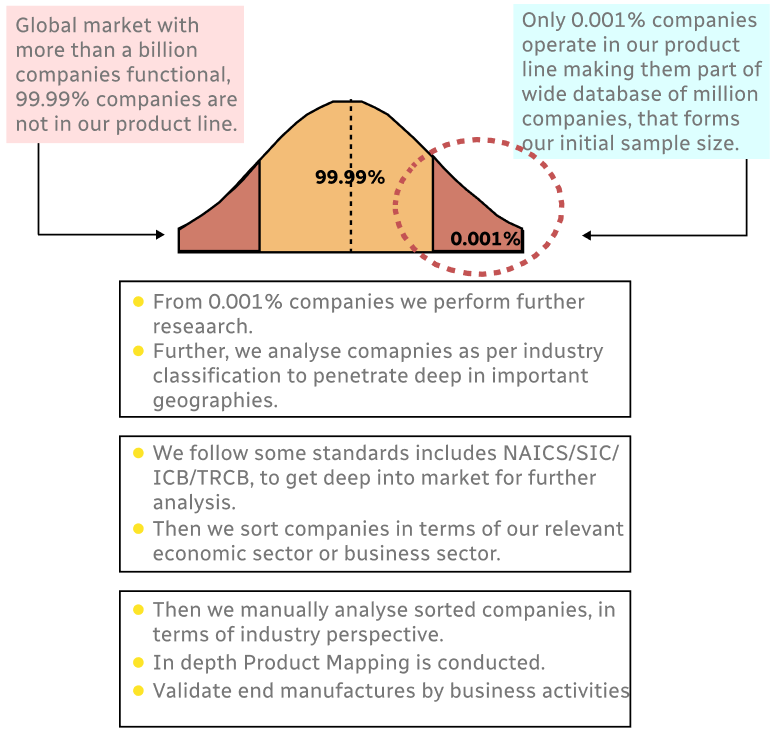
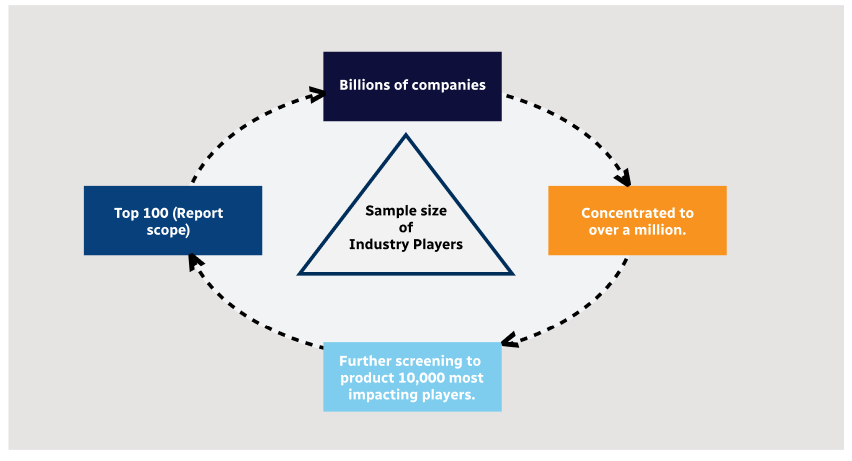
Step 1 - Identification of Relevant Samples Size from Population Database
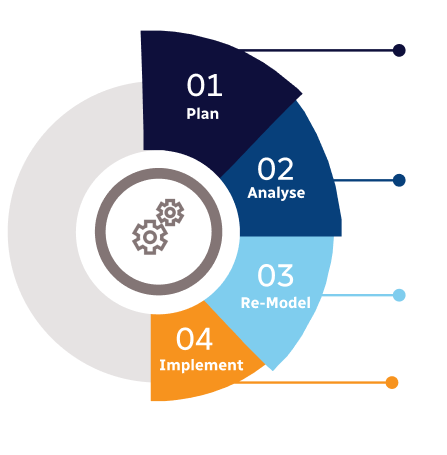
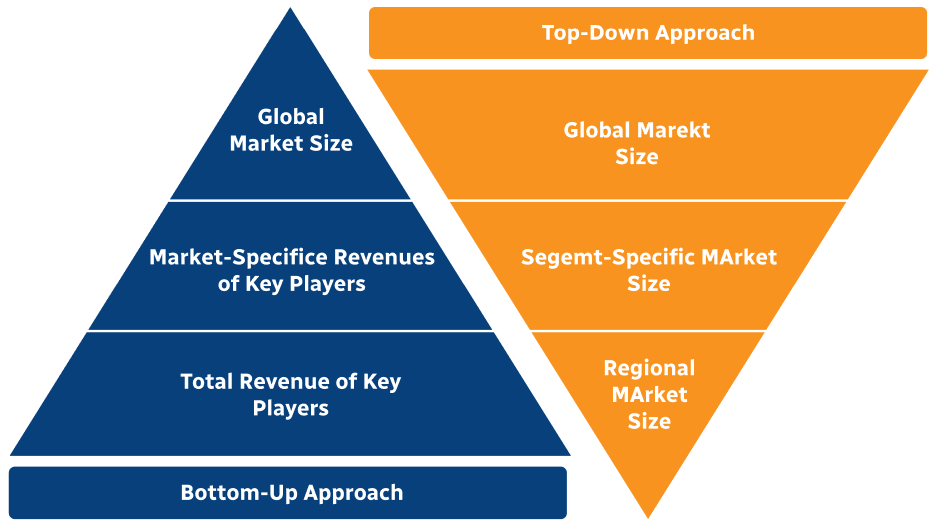
Step 2 - Approaches for Defining Global Market Size (Value, Volume* & Price*)
Note*: In applicable scenarios
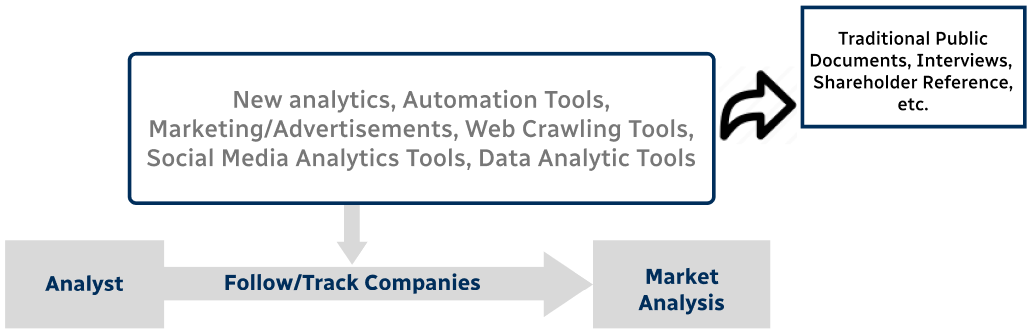
Step 3 - Data Sources
Primary Research
- Web Analytics
- Survey Reports
- Research Institute
- Latest Research Reports
- Opinion Leaders
Secondary Research
- Annual Reports
- White Paper
- Latest Press Release
- Industry Association
- Paid Database
- Investor Presentations
Step 4 - Data Triangulation
Involves using different sources of information in order to increase the validity of a study
These sources are likely to be stakeholders in a program - participants, other researchers, program staff, other community members, and so on.
Then we put all data in single framework & apply various statistical tools to find out the dynamic on the market.
During the analysis stage, feedback from the stakeholder groups would be compared to determine areas of agreement as well as areas of divergence