

Key Insights
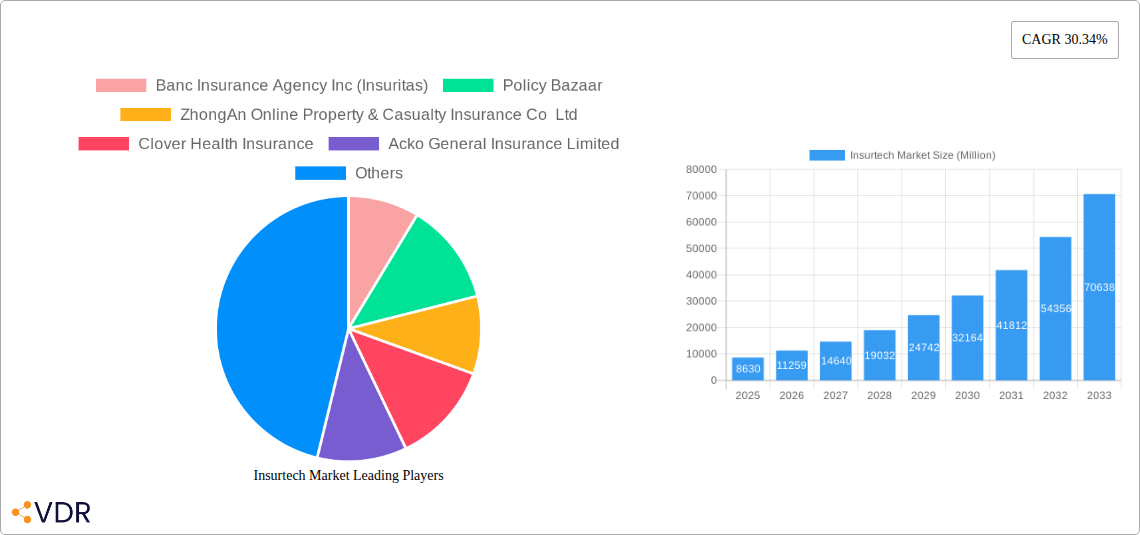
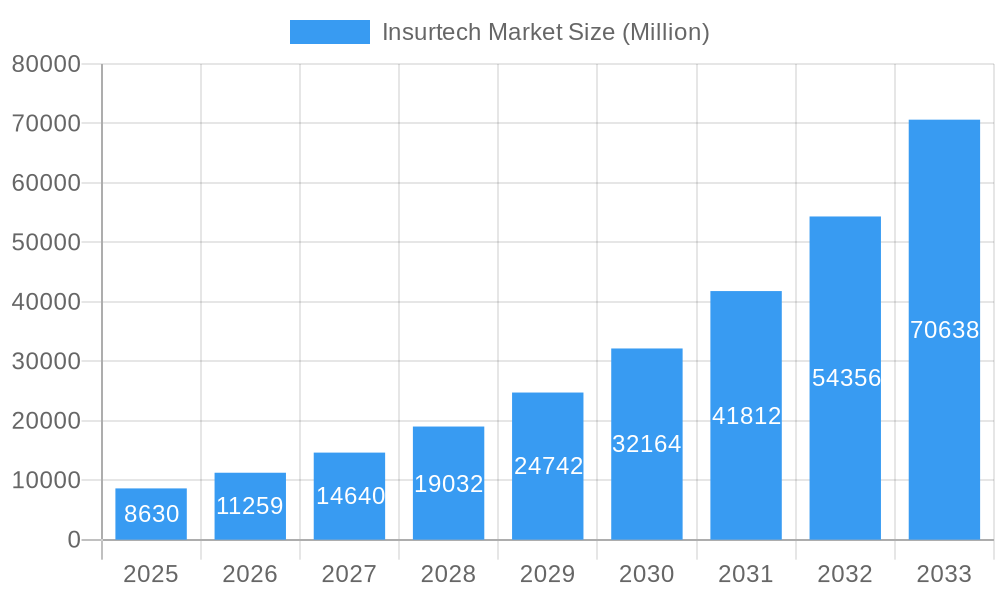
The Insurtech market, valued at $8.63 billion in 2025, is experiencing explosive growth, projected to expand at a compound annual growth rate (CAGR) of 30.34% from 2025 to 2033. This surge is driven by several key factors. Firstly, increasing consumer demand for digital-first, personalized insurance solutions is fueling adoption. Consumers are seeking convenient, transparent, and cost-effective insurance options, which Insurtech companies excel at providing through innovative platforms and technologies. Secondly, advancements in artificial intelligence (AI), machine learning (ML), and big data analytics are enabling insurers to improve risk assessment, personalize pricing, and automate processes, leading to greater efficiency and customer satisfaction. The integration of these technologies streamlines claims processing, reduces operational costs, and allows for more accurate risk profiling, benefiting both insurers and policyholders. Finally, regulatory changes in various markets are creating a more favorable environment for Insurtech innovation and competition, encouraging further market expansion. The market's rapid growth is also attracting significant investment, fostering the development of new technologies and business models.
Insurtech Market Market Size (In Billion)
The competitive landscape is dynamic, with established players like Banc Insurance Agency Inc (Insuritas), Policy Bazaar, and ZhongAn Online Property & Casualty Insurance Co Ltd, alongside innovative startups such as Lemonade, Acko General Insurance Limited, and Oscar Health, vying for market share. These companies are focusing on niche segments, leveraging specialized technologies, and developing unique value propositions to capture specific customer segments. While challenges remain, including cybersecurity concerns and regulatory hurdles, the long-term outlook for the Insurtech market remains positive. The continued adoption of digital technologies, growing consumer expectations, and ongoing innovation will further propel market growth throughout the forecast period. The market’s segmentation, while not explicitly detailed, is likely diversified across product types (e.g., health, auto, home), distribution channels (e.g., direct-to-consumer, embedded insurance), and geographical regions.
Insurtech Market Company Market Share
Insurtech Market Report: 2019-2033
This comprehensive report provides an in-depth analysis of the Insurtech market, encompassing market dynamics, growth trends, regional dominance, product landscape, key players, and future outlook. The study period covers 2019-2033, with a base year of 2025 and a forecast period of 2025-2033. The report leverages extensive data and industry expertise to offer actionable insights for businesses operating within or seeking to enter this rapidly evolving sector. Parent markets include the broader financial technology and insurance industries, while child markets include specific Insurtech niches like embedded insurance and digital health insurance.
Insurtech Market Dynamics & Structure
The Insurtech market is characterized by a dynamic interplay of factors shaping its structure and growth. Market concentration is currently moderate, with a few large players alongside numerous startups and niche providers. Technological innovation, driven by AI, machine learning, and big data analytics, is a key driver, enabling personalized pricing, risk assessment, and fraud detection. Regulatory frameworks, varying significantly across regions, influence market access and operational practices. Competitive pressures from traditional insurers and the emergence of new Insurtech entrants create a complex competitive landscape. M&A activity is frequent, with larger players acquiring smaller firms to enhance their technological capabilities or expand their market reach.
- Market Concentration: Moderate, with a Herfindahl-Hirschman Index (HHI) estimated at xx in 2025.
- Technological Innovation: AI, Machine Learning, Blockchain, IoT driving product differentiation and efficiency.
- Regulatory Frameworks: Vary significantly across geographies, impacting market entry and operational costs. xx% of Insurtech companies face significant regulatory hurdles.
- Competitive Landscape: Intense competition from both established insurers and new entrants.
- M&A Activity: xx deals were recorded in 2024, representing a xx% increase from 2023. Average deal size: $xx million.
- End-User Demographics: Shifting towards younger, tech-savvy consumers who demand digital-first solutions.
Insurtech Market Growth Trends & Insights
The Insurtech market exhibits robust growth, fueled by increasing digital adoption, changing consumer expectations, and technological advancements. The market size, valued at $xx million in 2024, is projected to reach $xx million by 2033, exhibiting a CAGR of xx%. Adoption rates are accelerating, particularly in regions with high internet penetration and mobile phone usage. Disruptive technologies like AI and blockchain are transforming insurance processes, leading to greater efficiency and enhanced customer experiences. Consumers are increasingly demanding personalized, on-demand insurance solutions, pushing Insurtech companies to innovate and adapt.
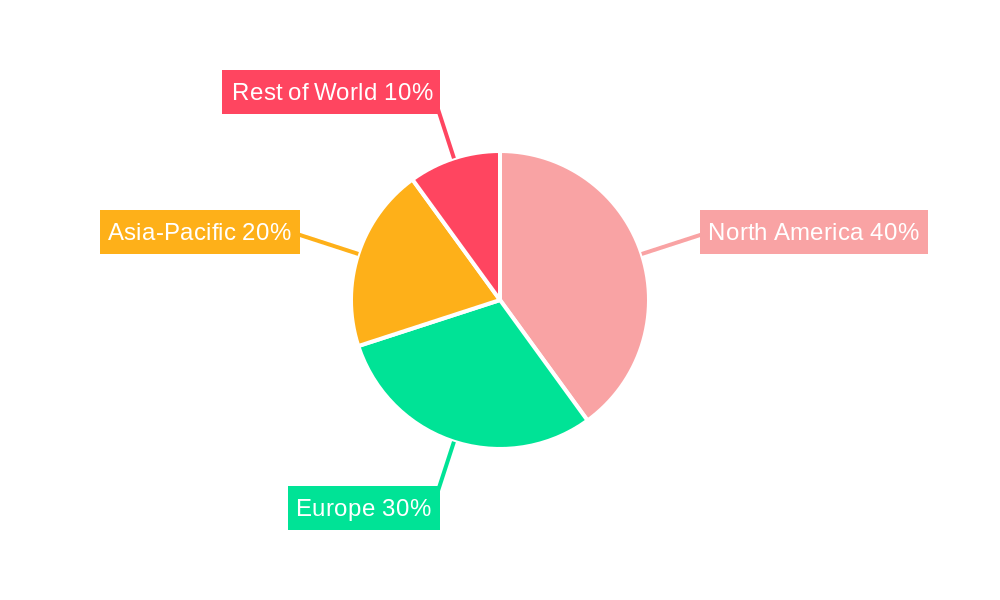
Dominant Regions, Countries, or Segments in Insurtech Market
North America currently dominates the Insurtech market, holding approximately xx% of the global market share in 2025, followed by Europe and Asia-Pacific. This dominance is attributed to several factors:
- North America: High levels of technological adoption, robust venture capital funding, and a mature insurance sector creating a fertile ground for innovation. Strong regulatory support (in some areas) also plays a role.
- Europe: Growing adoption of digital insurance solutions, particularly in the UK and Germany. Increased regulatory focus on Insurtech is creating both challenges and opportunities.
- Asia-Pacific: Rapid technological advancements and a large, young, and digitally-savvy population are driving significant growth. However, regulatory uncertainty and market fragmentation represent challenges.
Insurtech Market Product Landscape
The Insurtech market offers a diverse range of products and services, including personalized insurance offerings, usage-based insurance, embedded insurance solutions, and digital claims processing. These products leverage AI, machine learning, and big data to improve pricing accuracy, risk assessment, fraud detection, and customer service. Unique selling propositions include seamless digital experiences, personalized pricing, and faster claim settlements. Significant technological advancements are streamlining insurance operations and delivering superior customer value.
Key Drivers, Barriers & Challenges in Insurtech Market
Key Drivers:
- Technological advancements: AI, machine learning, blockchain, and big data analytics.
- Increased consumer demand for digital insurance solutions.
- Rising smartphone penetration and internet access.
- Favorable regulatory environments in specific regions.
Key Challenges & Restraints:
- Regulatory hurdles and compliance requirements. xx% of surveyed Insurtech startups cited regulatory uncertainty as a major challenge.
- Cybersecurity threats and data privacy concerns.
- Competition from established insurance companies.
- Integration challenges with legacy insurance systems.
Emerging Opportunities in Insurtech Market
- Untapped markets in developing economies with high growth potential.
- Expansion of embedded insurance into various sectors.
- Growth of Insurtech solutions for specific demographics (e.g., gig economy workers).
- Development of innovative insurance products addressing emerging risks (e.g., cyber insurance).
Growth Accelerators in the Insurtech Market Industry
The Insurtech market's long-term growth trajectory is propelled by continued technological innovation, strategic partnerships between Insurtech companies and traditional insurers, and expansion into new geographic markets. The integration of Insurtech solutions into existing financial ecosystems and the development of tailored insurance products for niche segments promise significant future growth.
Key Players Shaping the Insurtech Market Market
- Banc Insurance Agency Inc (Insuritas)
- Policy Bazaar
- ZhongAn Online Property & Casualty Insurance Co Ltd
- Clover Health Insurance
- Acko General Insurance Limited
- Moonshot-Internet
- Sureify
- Lemonade
- Oscar Health
- Anorak
- BDEO
- Earnix
- Planck
- ThingCo
- Tractable
- Bima
- Metromile
- Collective Health
Notable Milestones in Insurtech Market Sector
- March 2024: CNB Bank & Trust (CIBC) and Insuritas partnered to launch an embedded full-service insurance agency, showcasing the growing trend of embedded finance.
- June 2023: Clover Health Investments Corp. settled seven derivative lawsuits, reducing legal uncertainty and improving investor confidence.
In-Depth Insurtech Market Market Outlook
The Insurtech market is poised for continued expansion, driven by sustained technological advancements, increased consumer adoption, and strategic partnerships. Opportunities exist in niche segments, emerging markets, and the development of innovative products addressing evolving risks. Strategic alliances between traditional insurers and Insurtech startups will likely shape the market landscape in the coming years, fostering accelerated growth and innovation.
Insurtech Market Segmentation
-
1. Insurance Line
- 1.1. Health
- 1.2. Life
- 1.3. Automotive
- 1.4. Home And Property
- 1.5. Travel Insurance
- 1.6. Other Insurance Lines
Insurtech Market Segmentation By Geography
-
1. North America
- 1.1. United States
- 1.2. Canada
- 1.3. Rest of North America
-
2. Europe
- 2.1. Germany
- 2.2. France
- 2.3. Spain
- 2.4. United Kingdom
- 2.5. Rest of Europe
-
3. South America
- 3.1. Brazil
- 3.2. Argentina
- 3.3. Rest of South America
-
4. Asia Pacific
- 4.1. India
- 4.2. China
- 4.3. Australia
- 4.4. Singapore
- 4.5. Hong Kong
- 4.6. Japan
- 4.7. Rest of Asia Pacific
- 5. Middle East
-
6. United Arab Emirates
- 6.1. Saudi Arabia
- 6.2. South Africa
- 6.3. Rest of Middle East
Insurtech Market Regional Market Share
Geographic Coverage of Insurtech Market
Insurtech Market REPORT HIGHLIGHTS
| Aspects | Details |
|---|---|
| Study Period | 2020-2034 |
| Base Year | 2025 |
| Estimated Year | 2026 |
| Forecast Period | 2026-2034 |
| Historical Period | 2020-2025 |
| Growth Rate | CAGR of 30.34% from 2020-2034 |
| Segmentation |
|
Table of Contents
- 1. Introduction
- 1.1. Research Scope
- 1.2. Market Segmentation
- 1.3. Research Objective
- 1.4. Definitions and Assumptions
- 2. Executive Summary
- 2.1. Market Snapshot
- 3. Market Dynamics
- 3.1. Market Drivers
- 3.2. Market Restrains
- 3.3. Market Trends
- 3.4. Market Opportunities
- 4. Market Factor Analysis
- 4.1. Porters Five Forces
- 4.1.1. Bargaining Power of Suppliers
- 4.1.2. Bargaining Power of Buyers
- 4.1.3. Threat of New Entrants
- 4.1.4. Threat of Substitutes
- 4.1.5. Competitive Rivalry
- 4.2. PESTEL analysis
- 4.3. BCG Analysis
- 4.3.1. Stars (High Growth, High Market Share)
- 4.3.2. Cash Cows (Low Growth, High Market Share)
- 4.3.3. Question Mark (High Growth, Low Market Share)
- 4.3.4. Dogs (Low Growth, Low Market Share)
- 4.4. Ansoff Matrix Analysis
- 4.5. Supply Chain Analysis
- 4.6. Regulatory Landscape
- 4.7. Current Market Potential and Opportunity Assessment (TAM–SAM–SOM Framework)
- 4.8. VDR Analyst Note
- 4.1. Porters Five Forces
- 5. Market Analysis, Insights and Forecast 2021-2033
- 5.1. Market Analysis, Insights and Forecast - by Insurance Line
- 5.1.1. Health
- 5.1.2. Life
- 5.1.3. Automotive
- 5.1.4. Home And Property
- 5.1.5. Travel Insurance
- 5.1.6. Other Insurance Lines
- 5.2. Market Analysis, Insights and Forecast - by Region
- 5.2.1. North America
- 5.2.2. Europe
- 5.2.3. South America
- 5.2.4. Asia Pacific
- 5.2.5. Middle East
- 5.2.6. United Arab Emirates
- 5.1. Market Analysis, Insights and Forecast - by Insurance Line
- 6. Global Insurtech Market Analysis, Insights and Forecast, 2021-2033
- 6.1. Market Analysis, Insights and Forecast - by Insurance Line
- 6.1.1. Health
- 6.1.2. Life
- 6.1.3. Automotive
- 6.1.4. Home And Property
- 6.1.5. Travel Insurance
- 6.1.6. Other Insurance Lines
- 6.1. Market Analysis, Insights and Forecast - by Insurance Line
- 7. North America Insurtech Market Analysis, Insights and Forecast, 2021-2033
- 7.1. Market Analysis, Insights and Forecast - by Insurance Line
- 7.1.1. Health
- 7.1.2. Life
- 7.1.3. Automotive
- 7.1.4. Home And Property
- 7.1.5. Travel Insurance
- 7.1.6. Other Insurance Lines
- 7.1. Market Analysis, Insights and Forecast - by Insurance Line
- 8. Europe Insurtech Market Analysis, Insights and Forecast, 2021-2033
- 8.1. Market Analysis, Insights and Forecast - by Insurance Line
- 8.1.1. Health
- 8.1.2. Life
- 8.1.3. Automotive
- 8.1.4. Home And Property
- 8.1.5. Travel Insurance
- 8.1.6. Other Insurance Lines
- 8.1. Market Analysis, Insights and Forecast - by Insurance Line
- 9. South America Insurtech Market Analysis, Insights and Forecast, 2021-2033
- 9.1. Market Analysis, Insights and Forecast - by Insurance Line
- 9.1.1. Health
- 9.1.2. Life
- 9.1.3. Automotive
- 9.1.4. Home And Property
- 9.1.5. Travel Insurance
- 9.1.6. Other Insurance Lines
- 9.1. Market Analysis, Insights and Forecast - by Insurance Line
- 10. Asia Pacific Insurtech Market Analysis, Insights and Forecast, 2021-2033
- 10.1. Market Analysis, Insights and Forecast - by Insurance Line
- 10.1.1. Health
- 10.1.2. Life
- 10.1.3. Automotive
- 10.1.4. Home And Property
- 10.1.5. Travel Insurance
- 10.1.6. Other Insurance Lines
- 10.1. Market Analysis, Insights and Forecast - by Insurance Line
- 11. Middle East Insurtech Market Analysis, Insights and Forecast, 2021-2033
- 11.1. Market Analysis, Insights and Forecast - by Insurance Line
- 11.1.1. Health
- 11.1.2. Life
- 11.1.3. Automotive
- 11.1.4. Home And Property
- 11.1.5. Travel Insurance
- 11.1.6. Other Insurance Lines
- 11.1. Market Analysis, Insights and Forecast - by Insurance Line
- 12. United Arab Emirates Insurtech Market Analysis, Insights and Forecast, 2021-2033
- 12.1. Market Analysis, Insights and Forecast - by Insurance Line
- 12.1.1. Health
- 12.1.2. Life
- 12.1.3. Automotive
- 12.1.4. Home And Property
- 12.1.5. Travel Insurance
- 12.1.6. Other Insurance Lines
- 12.1. Market Analysis, Insights and Forecast - by Insurance Line
- 13. Competitive Analysis
- 13.1. Company Profiles
- 13.1.1 Banc Insurance Agency Inc (Insuritas)
- 13.1.1.1. Company Overview
- 13.1.1.2. Products
- 13.1.1.3. Company Financials
- 13.1.1.4. SWOT Analysis
- 13.1.2 Policy Bazaar
- 13.1.2.1. Company Overview
- 13.1.2.2. Products
- 13.1.2.3. Company Financials
- 13.1.2.4. SWOT Analysis
- 13.1.3 ZhongAn Online Property & Casualty Insurance Co Ltd
- 13.1.3.1. Company Overview
- 13.1.3.2. Products
- 13.1.3.3. Company Financials
- 13.1.3.4. SWOT Analysis
- 13.1.4 Clover Health Insurance
- 13.1.4.1. Company Overview
- 13.1.4.2. Products
- 13.1.4.3. Company Financials
- 13.1.4.4. SWOT Analysis
- 13.1.5 Acko General Insurance Limited
- 13.1.5.1. Company Overview
- 13.1.5.2. Products
- 13.1.5.3. Company Financials
- 13.1.5.4. SWOT Analysis
- 13.1.6 Moonshot-Internet
- 13.1.6.1. Company Overview
- 13.1.6.2. Products
- 13.1.6.3. Company Financials
- 13.1.6.4. SWOT Analysis
- 13.1.7 Sureify
- 13.1.7.1. Company Overview
- 13.1.7.2. Products
- 13.1.7.3. Company Financials
- 13.1.7.4. SWOT Analysis
- 13.1.8 Lemonade
- 13.1.8.1. Company Overview
- 13.1.8.2. Products
- 13.1.8.3. Company Financials
- 13.1.8.4. SWOT Analysis
- 13.1.9 Oscar Health
- 13.1.9.1. Company Overview
- 13.1.9.2. Products
- 13.1.9.3. Company Financials
- 13.1.9.4. SWOT Analysis
- 13.1.10 Anorak
- 13.1.10.1. Company Overview
- 13.1.10.2. Products
- 13.1.10.3. Company Financials
- 13.1.10.4. SWOT Analysis
- 13.1.11 BDEO
- 13.1.11.1. Company Overview
- 13.1.11.2. Products
- 13.1.11.3. Company Financials
- 13.1.11.4. SWOT Analysis
- 13.1.12 Earnix
- 13.1.12.1. Company Overview
- 13.1.12.2. Products
- 13.1.12.3. Company Financials
- 13.1.12.4. SWOT Analysis
- 13.1.13 Planck
- 13.1.13.1. Company Overview
- 13.1.13.2. Products
- 13.1.13.3. Company Financials
- 13.1.13.4. SWOT Analysis
- 13.1.14 ThingCo
- 13.1.14.1. Company Overview
- 13.1.14.2. Products
- 13.1.14.3. Company Financials
- 13.1.14.4. SWOT Analysis
- 13.1.15 Tractable
- 13.1.15.1. Company Overview
- 13.1.15.2. Products
- 13.1.15.3. Company Financials
- 13.1.15.4. SWOT Analysis
- 13.1.16 Bima
- 13.1.16.1. Company Overview
- 13.1.16.2. Products
- 13.1.16.3. Company Financials
- 13.1.16.4. SWOT Analysis
- 13.1.17 Metromile
- 13.1.17.1. Company Overview
- 13.1.17.2. Products
- 13.1.17.3. Company Financials
- 13.1.17.4. SWOT Analysis
- 13.1.18 Collective Health**List Not Exhaustive
- 13.1.18.1. Company Overview
- 13.1.18.2. Products
- 13.1.18.3. Company Financials
- 13.1.18.4. SWOT Analysis
- 13.1.1 Banc Insurance Agency Inc (Insuritas)
- 13.2. Market Entropy
- 13.2.1 Company's Key Areas Served
- 13.2.2 Recent Developments
- 13.3. Company Market Share Analysis 2025
- 13.3.1 Top 5 Companies Market Share Analysis
- 13.3.2 Top 3 Companies Market Share Analysis
- 13.4. List of Potential Customers
- 14. Research Methodology
List of Figures
- Figure 1: Global Insurtech Market Revenue Breakdown (Million, %) by Region 2025 & 2033
- Figure 2: Global Insurtech Market Volume Breakdown (Billion, %) by Region 2025 & 2033
- Figure 3: North America Insurtech Market Revenue (Million), by Insurance Line 2025 & 2033
- Figure 4: North America Insurtech Market Volume (Billion), by Insurance Line 2025 & 2033
- Figure 5: North America Insurtech Market Revenue Share (%), by Insurance Line 2025 & 2033
- Figure 6: North America Insurtech Market Volume Share (%), by Insurance Line 2025 & 2033
- Figure 7: North America Insurtech Market Revenue (Million), by Country 2025 & 2033
- Figure 8: North America Insurtech Market Volume (Billion), by Country 2025 & 2033
- Figure 9: North America Insurtech Market Revenue Share (%), by Country 2025 & 2033
- Figure 10: North America Insurtech Market Volume Share (%), by Country 2025 & 2033
- Figure 11: Europe Insurtech Market Revenue (Million), by Insurance Line 2025 & 2033
- Figure 12: Europe Insurtech Market Volume (Billion), by Insurance Line 2025 & 2033
- Figure 13: Europe Insurtech Market Revenue Share (%), by Insurance Line 2025 & 2033
- Figure 14: Europe Insurtech Market Volume Share (%), by Insurance Line 2025 & 2033
- Figure 15: Europe Insurtech Market Revenue (Million), by Country 2025 & 2033
- Figure 16: Europe Insurtech Market Volume (Billion), by Country 2025 & 2033
- Figure 17: Europe Insurtech Market Revenue Share (%), by Country 2025 & 2033
- Figure 18: Europe Insurtech Market Volume Share (%), by Country 2025 & 2033
- Figure 19: South America Insurtech Market Revenue (Million), by Insurance Line 2025 & 2033
- Figure 20: South America Insurtech Market Volume (Billion), by Insurance Line 2025 & 2033
- Figure 21: South America Insurtech Market Revenue Share (%), by Insurance Line 2025 & 2033
- Figure 22: South America Insurtech Market Volume Share (%), by Insurance Line 2025 & 2033
- Figure 23: South America Insurtech Market Revenue (Million), by Country 2025 & 2033
- Figure 24: South America Insurtech Market Volume (Billion), by Country 2025 & 2033
- Figure 25: South America Insurtech Market Revenue Share (%), by Country 2025 & 2033
- Figure 26: South America Insurtech Market Volume Share (%), by Country 2025 & 2033
- Figure 27: Asia Pacific Insurtech Market Revenue (Million), by Insurance Line 2025 & 2033
- Figure 28: Asia Pacific Insurtech Market Volume (Billion), by Insurance Line 2025 & 2033
- Figure 29: Asia Pacific Insurtech Market Revenue Share (%), by Insurance Line 2025 & 2033
- Figure 30: Asia Pacific Insurtech Market Volume Share (%), by Insurance Line 2025 & 2033
- Figure 31: Asia Pacific Insurtech Market Revenue (Million), by Country 2025 & 2033
- Figure 32: Asia Pacific Insurtech Market Volume (Billion), by Country 2025 & 2033
- Figure 33: Asia Pacific Insurtech Market Revenue Share (%), by Country 2025 & 2033
- Figure 34: Asia Pacific Insurtech Market Volume Share (%), by Country 2025 & 2033
- Figure 35: Middle East Insurtech Market Revenue (Million), by Insurance Line 2025 & 2033
- Figure 36: Middle East Insurtech Market Volume (Billion), by Insurance Line 2025 & 2033
- Figure 37: Middle East Insurtech Market Revenue Share (%), by Insurance Line 2025 & 2033
- Figure 38: Middle East Insurtech Market Volume Share (%), by Insurance Line 2025 & 2033
- Figure 39: Middle East Insurtech Market Revenue (Million), by Country 2025 & 2033
- Figure 40: Middle East Insurtech Market Volume (Billion), by Country 2025 & 2033
- Figure 41: Middle East Insurtech Market Revenue Share (%), by Country 2025 & 2033
- Figure 42: Middle East Insurtech Market Volume Share (%), by Country 2025 & 2033
- Figure 43: United Arab Emirates Insurtech Market Revenue (Million), by Insurance Line 2025 & 2033
- Figure 44: United Arab Emirates Insurtech Market Volume (Billion), by Insurance Line 2025 & 2033
- Figure 45: United Arab Emirates Insurtech Market Revenue Share (%), by Insurance Line 2025 & 2033
- Figure 46: United Arab Emirates Insurtech Market Volume Share (%), by Insurance Line 2025 & 2033
- Figure 47: United Arab Emirates Insurtech Market Revenue (Million), by Country 2025 & 2033
- Figure 48: United Arab Emirates Insurtech Market Volume (Billion), by Country 2025 & 2033
- Figure 49: United Arab Emirates Insurtech Market Revenue Share (%), by Country 2025 & 2033
- Figure 50: United Arab Emirates Insurtech Market Volume Share (%), by Country 2025 & 2033
List of Tables
- Table 1: Global Insurtech Market Revenue Million Forecast, by Insurance Line 2020 & 2033
- Table 2: Global Insurtech Market Volume Billion Forecast, by Insurance Line 2020 & 2033
- Table 3: Global Insurtech Market Revenue Million Forecast, by Region 2020 & 2033
- Table 4: Global Insurtech Market Volume Billion Forecast, by Region 2020 & 2033
- Table 5: Global Insurtech Market Revenue Million Forecast, by Insurance Line 2020 & 2033
- Table 6: Global Insurtech Market Volume Billion Forecast, by Insurance Line 2020 & 2033
- Table 7: Global Insurtech Market Revenue Million Forecast, by Country 2020 & 2033
- Table 8: Global Insurtech Market Volume Billion Forecast, by Country 2020 & 2033
- Table 9: United States Insurtech Market Revenue (Million) Forecast, by Application 2020 & 2033
- Table 10: United States Insurtech Market Volume (Billion) Forecast, by Application 2020 & 2033
- Table 11: Canada Insurtech Market Revenue (Million) Forecast, by Application 2020 & 2033
- Table 12: Canada Insurtech Market Volume (Billion) Forecast, by Application 2020 & 2033
- Table 13: Rest of North America Insurtech Market Revenue (Million) Forecast, by Application 2020 & 2033
- Table 14: Rest of North America Insurtech Market Volume (Billion) Forecast, by Application 2020 & 2033
- Table 15: Global Insurtech Market Revenue Million Forecast, by Insurance Line 2020 & 2033
- Table 16: Global Insurtech Market Volume Billion Forecast, by Insurance Line 2020 & 2033
- Table 17: Global Insurtech Market Revenue Million Forecast, by Country 2020 & 2033
- Table 18: Global Insurtech Market Volume Billion Forecast, by Country 2020 & 2033
- Table 19: Germany Insurtech Market Revenue (Million) Forecast, by Application 2020 & 2033
- Table 20: Germany Insurtech Market Volume (Billion) Forecast, by Application 2020 & 2033
- Table 21: France Insurtech Market Revenue (Million) Forecast, by Application 2020 & 2033
- Table 22: France Insurtech Market Volume (Billion) Forecast, by Application 2020 & 2033
- Table 23: Spain Insurtech Market Revenue (Million) Forecast, by Application 2020 & 2033
- Table 24: Spain Insurtech Market Volume (Billion) Forecast, by Application 2020 & 2033
- Table 25: United Kingdom Insurtech Market Revenue (Million) Forecast, by Application 2020 & 2033
- Table 26: United Kingdom Insurtech Market Volume (Billion) Forecast, by Application 2020 & 2033
- Table 27: Rest of Europe Insurtech Market Revenue (Million) Forecast, by Application 2020 & 2033
- Table 28: Rest of Europe Insurtech Market Volume (Billion) Forecast, by Application 2020 & 2033
- Table 29: Global Insurtech Market Revenue Million Forecast, by Insurance Line 2020 & 2033
- Table 30: Global Insurtech Market Volume Billion Forecast, by Insurance Line 2020 & 2033
- Table 31: Global Insurtech Market Revenue Million Forecast, by Country 2020 & 2033
- Table 32: Global Insurtech Market Volume Billion Forecast, by Country 2020 & 2033
- Table 33: Brazil Insurtech Market Revenue (Million) Forecast, by Application 2020 & 2033
- Table 34: Brazil Insurtech Market Volume (Billion) Forecast, by Application 2020 & 2033
- Table 35: Argentina Insurtech Market Revenue (Million) Forecast, by Application 2020 & 2033
- Table 36: Argentina Insurtech Market Volume (Billion) Forecast, by Application 2020 & 2033
- Table 37: Rest of South America Insurtech Market Revenue (Million) Forecast, by Application 2020 & 2033
- Table 38: Rest of South America Insurtech Market Volume (Billion) Forecast, by Application 2020 & 2033
- Table 39: Global Insurtech Market Revenue Million Forecast, by Insurance Line 2020 & 2033
- Table 40: Global Insurtech Market Volume Billion Forecast, by Insurance Line 2020 & 2033
- Table 41: Global Insurtech Market Revenue Million Forecast, by Country 2020 & 2033
- Table 42: Global Insurtech Market Volume Billion Forecast, by Country 2020 & 2033
- Table 43: India Insurtech Market Revenue (Million) Forecast, by Application 2020 & 2033
- Table 44: India Insurtech Market Volume (Billion) Forecast, by Application 2020 & 2033
- Table 45: China Insurtech Market Revenue (Million) Forecast, by Application 2020 & 2033
- Table 46: China Insurtech Market Volume (Billion) Forecast, by Application 2020 & 2033
- Table 47: Australia Insurtech Market Revenue (Million) Forecast, by Application 2020 & 2033
- Table 48: Australia Insurtech Market Volume (Billion) Forecast, by Application 2020 & 2033
- Table 49: Singapore Insurtech Market Revenue (Million) Forecast, by Application 2020 & 2033
- Table 50: Singapore Insurtech Market Volume (Billion) Forecast, by Application 2020 & 2033
- Table 51: Hong Kong Insurtech Market Revenue (Million) Forecast, by Application 2020 & 2033
- Table 52: Hong Kong Insurtech Market Volume (Billion) Forecast, by Application 2020 & 2033
- Table 53: Japan Insurtech Market Revenue (Million) Forecast, by Application 2020 & 2033
- Table 54: Japan Insurtech Market Volume (Billion) Forecast, by Application 2020 & 2033
- Table 55: Rest of Asia Pacific Insurtech Market Revenue (Million) Forecast, by Application 2020 & 2033
- Table 56: Rest of Asia Pacific Insurtech Market Volume (Billion) Forecast, by Application 2020 & 2033
- Table 57: Global Insurtech Market Revenue Million Forecast, by Insurance Line 2020 & 2033
- Table 58: Global Insurtech Market Volume Billion Forecast, by Insurance Line 2020 & 2033
- Table 59: Global Insurtech Market Revenue Million Forecast, by Country 2020 & 2033
- Table 60: Global Insurtech Market Volume Billion Forecast, by Country 2020 & 2033
- Table 61: Global Insurtech Market Revenue Million Forecast, by Insurance Line 2020 & 2033
- Table 62: Global Insurtech Market Volume Billion Forecast, by Insurance Line 2020 & 2033
- Table 63: Global Insurtech Market Revenue Million Forecast, by Country 2020 & 2033
- Table 64: Global Insurtech Market Volume Billion Forecast, by Country 2020 & 2033
- Table 65: Saudi Arabia Insurtech Market Revenue (Million) Forecast, by Application 2020 & 2033
- Table 66: Saudi Arabia Insurtech Market Volume (Billion) Forecast, by Application 2020 & 2033
- Table 67: South Africa Insurtech Market Revenue (Million) Forecast, by Application 2020 & 2033
- Table 68: South Africa Insurtech Market Volume (Billion) Forecast, by Application 2020 & 2033
- Table 69: Rest of Middle East Insurtech Market Revenue (Million) Forecast, by Application 2020 & 2033
- Table 70: Rest of Middle East Insurtech Market Volume (Billion) Forecast, by Application 2020 & 2033
Frequently Asked Questions
1. What is the projected Compound Annual Growth Rate (CAGR) of the Insurtech Market?
The projected CAGR is approximately 30.34%.
2. Which companies are prominent players in the Insurtech Market?
Key companies in the market include Banc Insurance Agency Inc (Insuritas), Policy Bazaar, ZhongAn Online Property & Casualty Insurance Co Ltd, Clover Health Insurance, Acko General Insurance Limited, Moonshot-Internet, Sureify, Lemonade, Oscar Health, Anorak, BDEO, Earnix, Planck, ThingCo, Tractable, Bima, Metromile, Collective Health**List Not Exhaustive.
3. What are the main segments of the Insurtech Market?
The market segments include Insurance Line.
4. Can you provide details about the market size?
The market size is estimated to be USD 8.63 Million as of 2022.
5. What are some drivers contributing to market growth?
Rise in Investments in Digital Technologies to Reduce Operational Costs and Improve Efficiency & Customer Experience; Growth in the Use of Blockchain-Based Technology Among Health and Life Insurance Companies is Also Expected to Drive the Growth.
6. What are the notable trends driving market growth?
Automotive Segment is Driving the Insurtech Market.
7. Are there any restraints impacting market growth?
Rise in Investments in Digital Technologies to Reduce Operational Costs and Improve Efficiency & Customer Experience; Growth in the Use of Blockchain-Based Technology Among Health and Life Insurance Companies is Also Expected to Drive the Growth.
8. Can you provide examples of recent developments in the market?
March 2024: CNB Bank & Trust (CIBC) and Insuritas partnered to launch an embedded full-service insurance agency. Insuritas is proud to announce that it has been chosen by CIBC to install its award-winning, fully-functioning digital insurance agency solution. BUNDLE is Insuritas' award-winning, full-functioning insurance agency platform embedded in CIBC's ecosystem and engineered to provide a complete solution for CIBC's retail and commercial clients.June 2023: Clover Health Investments Corp., a leading provider of physician enablement services with a mission to improve Medicare access to quality healthcare, announced that it had reached a partnership agreement in principle to settle seven derivative lawsuits that are pending in the courts of Delaware and New York, as well as in the courts of Tennessee.
9. What pricing options are available for accessing the report?
Pricing options include single-user, multi-user, and enterprise licenses priced at USD 4750, USD 5250, and USD 8750 respectively.
10. Is the market size provided in terms of value or volume?
The market size is provided in terms of value, measured in Million and volume, measured in Billion.
11. Are there any specific market keywords associated with the report?
Yes, the market keyword associated with the report is "Insurtech Market," which aids in identifying and referencing the specific market segment covered.
12. How do I determine which pricing option suits my needs best?
The pricing options vary based on user requirements and access needs. Individual users may opt for single-user licenses, while businesses requiring broader access may choose multi-user or enterprise licenses for cost-effective access to the report.
13. Are there any additional resources or data provided in the Insurtech Market report?
While the report offers comprehensive insights, it's advisable to review the specific contents or supplementary materials provided to ascertain if additional resources or data are available.
14. How can I stay updated on further developments or reports in the Insurtech Market?
To stay informed about further developments, trends, and reports in the Insurtech Market, consider subscribing to industry newsletters, following relevant companies and organizations, or regularly checking reputable industry news sources and publications.
Methodology
Step 1 - Identification of Relevant Samples Size from Population Database


Step 2 - Approaches for Defining Global Market Size (Value, Volume* & Price*)

Note*: In applicable scenarios
Step 3 - Data Sources
Primary Research
- Web Analytics
- Survey Reports
- Research Institute
- Latest Research Reports
- Opinion Leaders
Secondary Research
- Annual Reports
- White Paper
- Latest Press Release
- Industry Association
- Paid Database
- Investor Presentations

Step 4 - Data Triangulation
Involves using different sources of information in order to increase the validity of a study
These sources are likely to be stakeholders in a program - participants, other researchers, program staff, other community members, and so on.
Then we put all data in single framework & apply various statistical tools to find out the dynamic on the market.
During the analysis stage, feedback from the stakeholder groups would be compared to determine areas of agreement as well as areas of divergence