

Key Insights
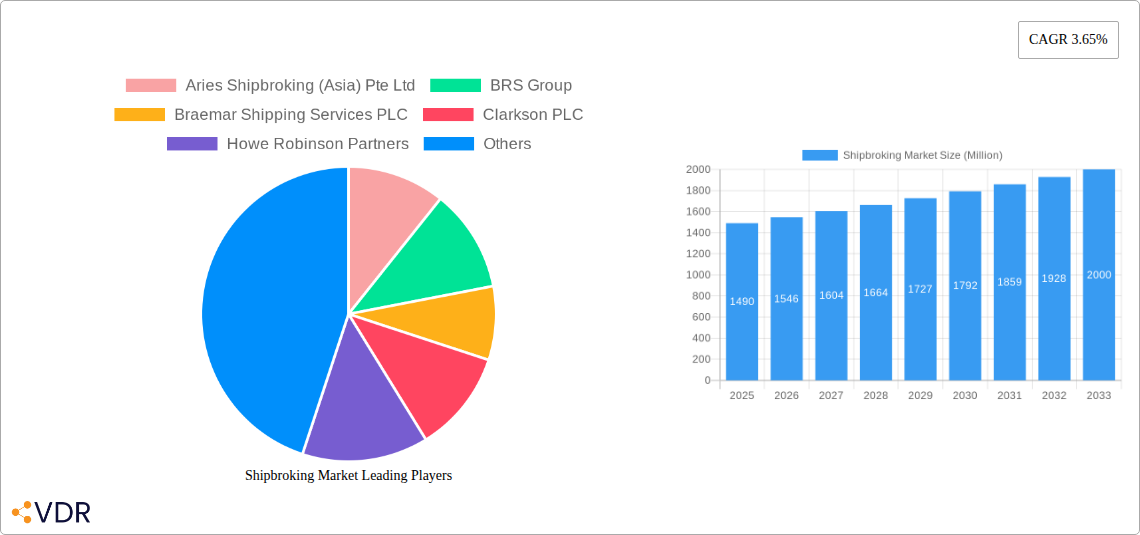
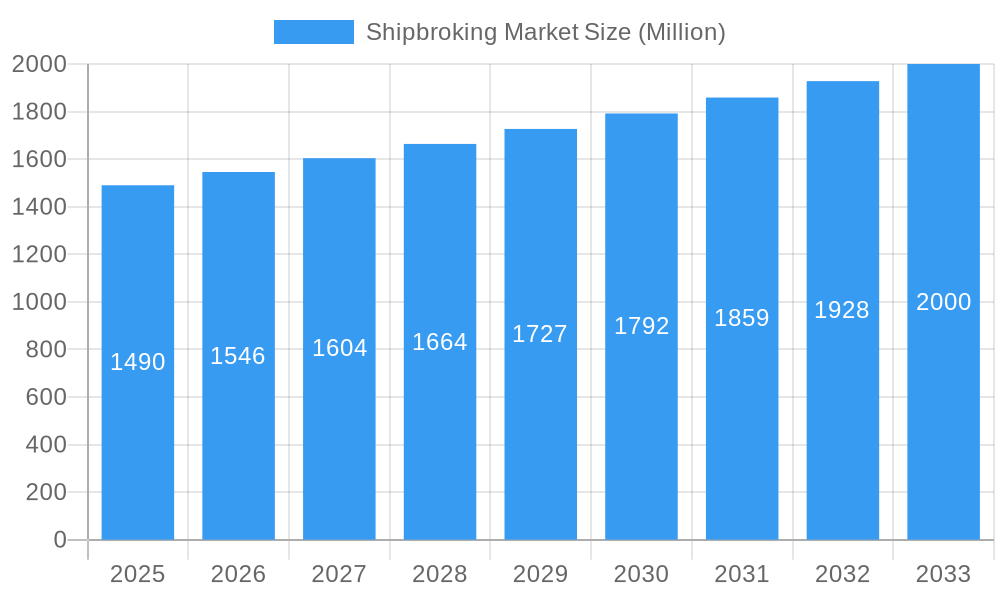
The global shipbroking market is poised for steady growth, projected to reach an estimated value of approximately USD 1.49 billion in 2025 with a Compound Annual Growth Rate (CAGR) of 3.65% extending through 2033. This expansion is primarily fueled by the increasing volume of international trade, the ongoing demand for energy resources necessitating tanker chartering, and the dynamic nature of the manufacturing and industrial sectors. Key drivers include the globalization of supply chains, the cyclical but persistent need for vessel acquisition and disposal, and the growing complexity of chartering contracts requiring expert brokerage services. Furthermore, emergent trends such as the increasing focus on sustainable shipping practices and the digitalization of the broking process are shaping market dynamics, creating opportunities for specialized services and technologically advanced platforms. The market's resilience is underpinned by the essential role of shipbrokers in facilitating maritime trade, navigating regulatory landscapes, and connecting cargo owners with vessel operators across diverse shipping segments.
Shipbroking Market Market Size (In Billion)
The shipbroking market is characterized by its diverse service offerings, including dry cargo, tanker, and container vessel broking, alongside specialized services like charting, sales and purchases, offshore support, newbuilding services, and salvage & towage. These services cater to a wide array of industries, notably oil and gas, manufacturing, and government sectors, each with unique logistical demands. Despite robust growth potential, the market faces certain restraints, including the inherent volatility of freight rates influenced by geopolitical events and economic fluctuations, as well as increasing regulatory pressures on shipping operations. The competitive landscape features established players like Clarkson PLC and Braemar Shipping Services PLC, alongside emerging firms, all vying for market share. Geographically, Asia Pacific, particularly China and India, is expected to be a significant growth engine due to its expanding manufacturing base and substantial import/export activities, while mature markets like Europe and North America continue to represent substantial demand centers.
Shipbroking Market Company Market Share
This in-depth report provides a detailed analysis of the global shipbroking market, covering market dynamics, growth trends, regional dominance, product landscape, key drivers, barriers, emerging opportunities, growth accelerators, and a comprehensive outlook. With a study period spanning from 2019 to 2033, a base year of 2025, and a forecast period from 2025 to 2033, this report offers invaluable insights for industry professionals, investors, and stakeholders navigating the complex world of maritime brokerage.
Shipbroking Market Market Dynamics & Structure
The shipbroking market exhibits a moderately concentrated structure, with key players like Clarkson PLC, Braemar Shipping Services PLC, and BRS Group holding significant market share. Technological innovation, particularly in digital platforms for chartering and real-time market data, is a primary driver, enhancing efficiency and transparency. Regulatory frameworks, including those governing environmental standards (e.g., IMO 2020) and international trade, significantly influence operational practices. Competitive product substitutes are minimal, as the core service of expert brokerage remains indispensable for complex maritime transactions. End-user demographics are diverse, encompassing shipowners, charterers, and commodity traders across various industries such as Oil and Gas, Manufacturing, and Aerospace and Defense. Mergers and acquisitions (M&A) trends are observed, albeit at a moderate pace, as larger firms seek to consolidate their market position and expand service offerings. For instance, the market share of the top 5 players is estimated to be around 55% in 2025. Innovation barriers include the high capital investment required for advanced digital solutions and the need for specialized human capital with deep industry knowledge.
- Market Concentration: Moderate, with a few dominant global players.
- Technological Innovation Drivers: Digitalization of chartering, AI-powered market analysis, blockchain for trade finance.
- Regulatory Frameworks: IMO regulations, trade sanctions, emissions control policies.
- Competitive Product Substitutes: Limited, direct human expertise remains critical.
- End-User Demographics: Diverse, from large corporations to smaller trading entities.
- M&A Trends: Consolidation efforts to gain scale and broader service portfolios.
- Quantitative Insights: Top 5 player market share ~55% (2025).
- Qualitative Factors: Need for skilled personnel, adoption challenges for new technologies.
Shipbroking Market Growth Trends & Insights
The shipbroking market is poised for robust growth, driven by increasing global trade volumes and the evolving complexities of maritime logistics. Leveraging the analysis of historical data from 2019 to 2024 and projecting forward, the market is expected to experience a Compound Annual Growth Rate (CAGR) of approximately 6.8% during the forecast period (2025–2033). Adoption rates for advanced digital brokerage platforms are steadily rising, as industry participants seek greater efficiency, transparency, and cost-effectiveness in their operations. Technological disruptions, such as the integration of AI for predictive analytics and the use of big data in market forecasting, are transforming the way shipbrokers operate, enabling them to provide more strategic advice to clients. Consumer behavior shifts are evident, with a growing demand for integrated services, including chartering, sales and purchases, and specialized offshore services. The market penetration of specialized brokerage services for niches like Tanker Broking and Container Vessel Broking continues to expand, reflecting the increasing specialization within the maritime industry. The overall market size is projected to grow from an estimated $15,500 Million in 2025 to over $26,000 Million by 2033.
- Market Size Evolution: From an estimated $15,500 Million (2025) to over $26,000 Million (2033).
- CAGR: Approximately 6.8% (2025–2033).
- Adoption Rates: Increasing for digital brokerage platforms and data analytics tools.
- Technological Disruptions: AI for forecasting, big data analytics, blockchain in trade.
- Consumer Behavior Shifts: Demand for integrated services and specialized expertise.
- Market Penetration: Growing for niche segments like Tanker and Container Vessel Broking.
- Specific Metrics: Market size projections, CAGR, adoption rates for digital services.
Dominant Regions, Countries, or Segments in Shipbroking Market
The Dry Cargo Broking segment is anticipated to be a dominant force within the shipbroking market, driven by its integral role in global commodity trade. Regions with significant commodity export and import activities, such as Asia-Pacific, North America, and Europe, are key contributors to this dominance. The economic policies and infrastructure development in countries within these regions directly influence the demand for dry bulk shipping services. For instance, China's continuous investment in infrastructure and its position as a major importer of raw materials fuels a substantial portion of the dry cargo market. The Oil and Gas industry, a primary consumer of Tanker Broking services, also plays a crucial role in regional market dynamics, with the Middle East and North America being leading hubs. The Manufacturing sector's global expansion also bolsters demand for Container Vessel Broking.
Key drivers for the dominance of Dry Cargo Broking include:
- Global Commodity Trade: China's insatiable demand for iron ore, coal, and grains.
- Economic Policies: Government incentives for export-oriented manufacturing and resource extraction.
- Infrastructure Development: Investment in ports, railways, and storage facilities.
- Market Share: Dry Cargo Broking estimated to hold 38% of the market in 2025.
In the Service segment, Charting services are expected to maintain a leading position due to their fundamental role in securing vessel space for cargo transportation. The Oil and Gas industry, a significant end-user, directly impacts the demand for Charting and Tanker Broking services.
The dominance of specific segments is further influenced by:
- Dry Cargo Broking: Driven by bulk commodity movements, estimated at $5,890 Million in 2025.
- Tanker Broking: Fueled by the global energy trade, estimated at $5,115 Million in 2025.
- Container Vessel Broking: Supported by globalized manufacturing and trade, estimated at $3,565 Million in 2025.
- Charting Services: The core brokerage activity, estimated at $7,000 Million in 2025.
- Sales and Purchases Services: Significant for fleet expansion and disposal, estimated at $3,000 Million in 2025.
- Oil and Gas Industry: A primary end-user, contributing significantly to demand for tanker and related services.
Shipbroking Market Product Landscape
The shipbroking market product landscape is characterized by sophisticated digital platforms and data-driven advisory services. Innovations focus on enhancing the efficiency of chartering processes through AI-powered vessel and cargo matching, real-time market intelligence dashboards, and automated documentation. Performance metrics are tracked through client satisfaction scores, transaction volumes, and the accuracy of market forecasts. Unique selling propositions often lie in the depth of market knowledge, specialized expertise in niche segments like Offshore Services or Newbuilding Services, and the ability to provide integrated solutions encompassing chartering, sales, and post-fixture services. Technological advancements are continuously pushing the boundaries of predictive analytics, helping clients navigate market volatility and optimize their shipping strategies for segments like Aerospace and Defense logistics and Government contracts.
Key Drivers, Barriers & Challenges in Shipbroking Market
Key Drivers:
- Globalization and International Trade: Increasing cross-border movement of goods necessitates efficient maritime transport.
- Economic Growth: Expansion of industries like Oil and Gas, Manufacturing, and Aerospace and Defense fuels demand for shipping.
- Technological Advancements: Digitalization and AI are improving brokerage efficiency and client service.
- Demand for Specialized Services: Growing need for expertise in areas like Newbuilding Services and Salvage & Towage Services.
Barriers & Challenges:
- Market Volatility: Fluctuations in freight rates and cargo demand create uncertainty.
- Regulatory Complexity: Evolving environmental regulations and international trade policies pose compliance challenges.
- Supply Chain Disruptions: Geopolitical events and port congestion can impact service delivery.
- Talent Acquisition and Retention: The need for experienced and knowledgeable shipbrokers.
- Cybersecurity Threats: Protecting sensitive client data and transaction information.
- Environmental Compliance Costs: Increasing pressure for greener shipping practices.
Emerging Opportunities in Shipbroking Market
Emerging opportunities in the shipbroking market lie in the development of advanced sustainability-focused brokerage services, assisting clients in navigating the transition to greener fuels and vessels. The burgeoning offshore wind sector presents a significant growth avenue for specialized brokerage services related to installation and maintenance vessels. Furthermore, the integration of blockchain technology for enhanced transparency and security in trade finance and charter party agreements offers a promising frontier. Untapped markets in developing economies with expanding maritime trade also represent significant potential for growth and service expansion. The increasing demand for end-to-end logistics solutions also opens doors for shipbrokers to offer more comprehensive maritime supply chain management services.
Growth Accelerators in the Shipbroking Market Industry
Catalysts driving long-term growth in the shipbroking market include strategic partnerships between traditional brokers and technology providers to develop cutting-edge digital solutions. Market expansion strategies, such as establishing a presence in emerging trade routes and focusing on niche, high-growth segments, will be crucial. Technological breakthroughs in data analytics and AI will continue to empower brokers with predictive capabilities, enabling them to offer more value-added advisory services. The increasing emphasis on decarbonization and sustainable shipping practices will create new opportunities for brokers specializing in environmentally friendly vessels and fuel solutions, further accelerating market growth.
Key Players Shaping the Shipbroking Market Market
- Aries Shipbroking (Asia) Pte Ltd
- BRS Group
- Braemar Shipping Services PLC
- Clarkson PLC
- Howe Robinson Partners
- Simpson Spense Young
- Fearnleys A/S
- ACM Shipping Group PLC
- Chowgule Brothers Pvt Ltd
- Affinity (Shipping) LLP
Notable Milestones in Shipbroking Market Sector
- January 2024: The Danish shipping giant Maersk announced a significant long-term collaboration with its German counterpart, Hapag-Lloyd, consolidating hundreds of vessels under this partnership, aimed at optimizing operational efficiencies and route planning.
- September 2023: Global container liner shipping business ZIM Integrated Shipping Services Ltd signed a new operational collaboration agreement spanning many trades with MSC, the industry leader, intended to improve service standards for ZIM's esteemed clientele and greatly increase operating efficiencies.
In-Depth Shipbroking Market Market Outlook
The future of the shipbroking market is characterized by continued digital transformation, a growing emphasis on sustainability, and increasing consolidation. Growth accelerators will stem from the adoption of advanced technologies like AI and blockchain, leading to more efficient and transparent transactions. Strategic partnerships and market expansion into underserved regions will further fuel growth. The evolving regulatory landscape, particularly concerning environmental protection, will create new opportunities for brokers specializing in green shipping solutions. The market's ability to adapt to these changes and offer integrated, data-driven services will be critical for success in the coming years. The estimated market size for Other Types of broking is $2,270 Million in 2025, indicating room for growth and specialization.
Shipbroking Market Segmentation
-
1. Type
- 1.1. Dry Cargo Broking
- 1.2. Tanker Broking
- 1.3. Container Vessel Broking
- 1.4. Other Types
-
2. Service
- 2.1. Charting
- 2.2. Sales and Purchases
- 2.3. Offshore Services
- 2.4. Newbuilding Services
- 2.5. Salvage &Towage Services
-
3. Industry
- 3.1. Oil and Gas
- 3.2. Manufacturing
- 3.3. Aerospace and Defense
- 3.4. Government
- 3.5. Other Industries
Shipbroking Market Segmentation By Geography
-
1. North America
- 1.1. United States
- 1.2. Canada
- 1.3. Rest of North America
-
2. Europe
- 2.1. Germany
- 2.2. United Kingdom
- 2.3. France
- 2.4. Russia
- 2.5. Spain
- 2.6. Rest of Europe
-
3. Asia Pacific
- 3.1. India
- 3.2. China
- 3.3. Japan
- 3.4. Rest of Asia Pacific
-
4. South America
- 4.1. Brazil
- 4.2. Argentina
- 4.3. Rest of South America
-
5. Middle East and Africa
- 5.1. United Arab Emirates
- 5.2. Saudi Arabia
- 5.3. Rest of Middle East and Africa
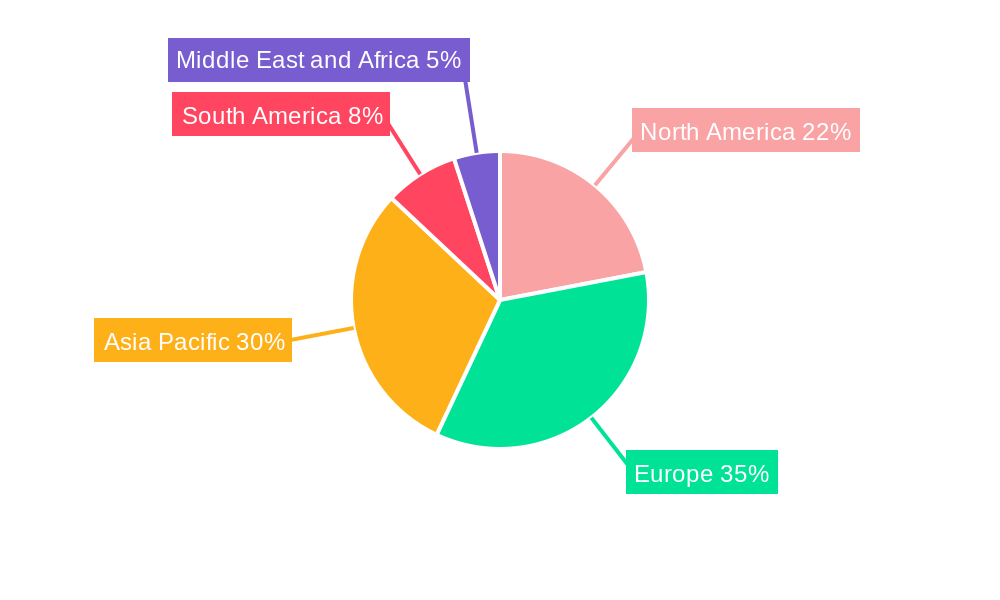
Shipbroking Market Regional Market Share
Geographic Coverage of Shipbroking Market
Shipbroking Market REPORT HIGHLIGHTS
| Aspects | Details |
|---|---|
| Study Period | 2020-2034 |
| Base Year | 2025 |
| Estimated Year | 2026 |
| Forecast Period | 2026-2034 |
| Historical Period | 2020-2025 |
| Growth Rate | CAGR of 3.65% from 2020-2034 |
| Segmentation |
|
Table of Contents
- 1. Introduction
- 1.1. Research Scope
- 1.2. Market Segmentation
- 1.3. Research Objective
- 1.4. Definitions and Assumptions
- 2. Executive Summary
- 2.1. Market Snapshot
- 3. Market Dynamics
- 3.1. Market Drivers
- 3.2. Market Restrains
- 3.3. Market Trends
- 3.4. Market Opportunities
- 4. Market Factor Analysis
- 4.1. Porters Five Forces
- 4.1.1. Bargaining Power of Suppliers
- 4.1.2. Bargaining Power of Buyers
- 4.1.3. Threat of New Entrants
- 4.1.4. Threat of Substitutes
- 4.1.5. Competitive Rivalry
- 4.2. PESTEL analysis
- 4.3. BCG Analysis
- 4.3.1. Stars (High Growth, High Market Share)
- 4.3.2. Cash Cows (Low Growth, High Market Share)
- 4.3.3. Question Mark (High Growth, Low Market Share)
- 4.3.4. Dogs (Low Growth, Low Market Share)
- 4.4. Ansoff Matrix Analysis
- 4.5. Supply Chain Analysis
- 4.6. Regulatory Landscape
- 4.7. Current Market Potential and Opportunity Assessment (TAM–SAM–SOM Framework)
- 4.8. VDR Analyst Note
- 4.1. Porters Five Forces
- 5. Market Analysis, Insights and Forecast 2021-2033
- 5.1. Market Analysis, Insights and Forecast - by Type
- 5.1.1. Dry Cargo Broking
- 5.1.2. Tanker Broking
- 5.1.3. Container Vessel Broking
- 5.1.4. Other Types
- 5.2. Market Analysis, Insights and Forecast - by Service
- 5.2.1. Charting
- 5.2.2. Sales and Purchases
- 5.2.3. Offshore Services
- 5.2.4. Newbuilding Services
- 5.2.5. Salvage &Towage Services
- 5.3. Market Analysis, Insights and Forecast - by Industry
- 5.3.1. Oil and Gas
- 5.3.2. Manufacturing
- 5.3.3. Aerospace and Defense
- 5.3.4. Government
- 5.3.5. Other Industries
- 5.4. Market Analysis, Insights and Forecast - by Region
- 5.4.1. North America
- 5.4.2. Europe
- 5.4.3. Asia Pacific
- 5.4.4. South America
- 5.4.5. Middle East and Africa
- 5.1. Market Analysis, Insights and Forecast - by Type
- 6. Global Shipbroking Market Analysis, Insights and Forecast, 2021-2033
- 6.1. Market Analysis, Insights and Forecast - by Type
- 6.1.1. Dry Cargo Broking
- 6.1.2. Tanker Broking
- 6.1.3. Container Vessel Broking
- 6.1.4. Other Types
- 6.2. Market Analysis, Insights and Forecast - by Service
- 6.2.1. Charting
- 6.2.2. Sales and Purchases
- 6.2.3. Offshore Services
- 6.2.4. Newbuilding Services
- 6.2.5. Salvage &Towage Services
- 6.3. Market Analysis, Insights and Forecast - by Industry
- 6.3.1. Oil and Gas
- 6.3.2. Manufacturing
- 6.3.3. Aerospace and Defense
- 6.3.4. Government
- 6.3.5. Other Industries
- 6.1. Market Analysis, Insights and Forecast - by Type
- 7. North America Shipbroking Market Analysis, Insights and Forecast, 2021-2033
- 7.1. Market Analysis, Insights and Forecast - by Type
- 7.1.1. Dry Cargo Broking
- 7.1.2. Tanker Broking
- 7.1.3. Container Vessel Broking
- 7.1.4. Other Types
- 7.2. Market Analysis, Insights and Forecast - by Service
- 7.2.1. Charting
- 7.2.2. Sales and Purchases
- 7.2.3. Offshore Services
- 7.2.4. Newbuilding Services
- 7.2.5. Salvage &Towage Services
- 7.3. Market Analysis, Insights and Forecast - by Industry
- 7.3.1. Oil and Gas
- 7.3.2. Manufacturing
- 7.3.3. Aerospace and Defense
- 7.3.4. Government
- 7.3.5. Other Industries
- 7.1. Market Analysis, Insights and Forecast - by Type
- 8. Europe Shipbroking Market Analysis, Insights and Forecast, 2021-2033
- 8.1. Market Analysis, Insights and Forecast - by Type
- 8.1.1. Dry Cargo Broking
- 8.1.2. Tanker Broking
- 8.1.3. Container Vessel Broking
- 8.1.4. Other Types
- 8.2. Market Analysis, Insights and Forecast - by Service
- 8.2.1. Charting
- 8.2.2. Sales and Purchases
- 8.2.3. Offshore Services
- 8.2.4. Newbuilding Services
- 8.2.5. Salvage &Towage Services
- 8.3. Market Analysis, Insights and Forecast - by Industry
- 8.3.1. Oil and Gas
- 8.3.2. Manufacturing
- 8.3.3. Aerospace and Defense
- 8.3.4. Government
- 8.3.5. Other Industries
- 8.1. Market Analysis, Insights and Forecast - by Type
- 9. Asia Pacific Shipbroking Market Analysis, Insights and Forecast, 2021-2033
- 9.1. Market Analysis, Insights and Forecast - by Type
- 9.1.1. Dry Cargo Broking
- 9.1.2. Tanker Broking
- 9.1.3. Container Vessel Broking
- 9.1.4. Other Types
- 9.2. Market Analysis, Insights and Forecast - by Service
- 9.2.1. Charting
- 9.2.2. Sales and Purchases
- 9.2.3. Offshore Services
- 9.2.4. Newbuilding Services
- 9.2.5. Salvage &Towage Services
- 9.3. Market Analysis, Insights and Forecast - by Industry
- 9.3.1. Oil and Gas
- 9.3.2. Manufacturing
- 9.3.3. Aerospace and Defense
- 9.3.4. Government
- 9.3.5. Other Industries
- 9.1. Market Analysis, Insights and Forecast - by Type
- 10. South America Shipbroking Market Analysis, Insights and Forecast, 2021-2033
- 10.1. Market Analysis, Insights and Forecast - by Type
- 10.1.1. Dry Cargo Broking
- 10.1.2. Tanker Broking
- 10.1.3. Container Vessel Broking
- 10.1.4. Other Types
- 10.2. Market Analysis, Insights and Forecast - by Service
- 10.2.1. Charting
- 10.2.2. Sales and Purchases
- 10.2.3. Offshore Services
- 10.2.4. Newbuilding Services
- 10.2.5. Salvage &Towage Services
- 10.3. Market Analysis, Insights and Forecast - by Industry
- 10.3.1. Oil and Gas
- 10.3.2. Manufacturing
- 10.3.3. Aerospace and Defense
- 10.3.4. Government
- 10.3.5. Other Industries
- 10.1. Market Analysis, Insights and Forecast - by Type
- 11. Middle East and Africa Shipbroking Market Analysis, Insights and Forecast, 2021-2033
- 11.1. Market Analysis, Insights and Forecast - by Type
- 11.1.1. Dry Cargo Broking
- 11.1.2. Tanker Broking
- 11.1.3. Container Vessel Broking
- 11.1.4. Other Types
- 11.2. Market Analysis, Insights and Forecast - by Service
- 11.2.1. Charting
- 11.2.2. Sales and Purchases
- 11.2.3. Offshore Services
- 11.2.4. Newbuilding Services
- 11.2.5. Salvage &Towage Services
- 11.3. Market Analysis, Insights and Forecast - by Industry
- 11.3.1. Oil and Gas
- 11.3.2. Manufacturing
- 11.3.3. Aerospace and Defense
- 11.3.4. Government
- 11.3.5. Other Industries
- 11.1. Market Analysis, Insights and Forecast - by Type
- 12. Competitive Analysis
- 12.1. Company Profiles
- 12.1.1 Aries Shipbroking (Asia) Pte Ltd
- 12.1.1.1. Company Overview
- 12.1.1.2. Products
- 12.1.1.3. Company Financials
- 12.1.1.4. SWOT Analysis
- 12.1.2 BRS Group
- 12.1.2.1. Company Overview
- 12.1.2.2. Products
- 12.1.2.3. Company Financials
- 12.1.2.4. SWOT Analysis
- 12.1.3 Braemar Shipping Services PLC
- 12.1.3.1. Company Overview
- 12.1.3.2. Products
- 12.1.3.3. Company Financials
- 12.1.3.4. SWOT Analysis
- 12.1.4 Clarkson PLC
- 12.1.4.1. Company Overview
- 12.1.4.2. Products
- 12.1.4.3. Company Financials
- 12.1.4.4. SWOT Analysis
- 12.1.5 Howe Robinson Partners
- 12.1.5.1. Company Overview
- 12.1.5.2. Products
- 12.1.5.3. Company Financials
- 12.1.5.4. SWOT Analysis
- 12.1.6 Simpson Spense Young
- 12.1.6.1. Company Overview
- 12.1.6.2. Products
- 12.1.6.3. Company Financials
- 12.1.6.4. SWOT Analysis
- 12.1.7 Fearnleys A/S
- 12.1.7.1. Company Overview
- 12.1.7.2. Products
- 12.1.7.3. Company Financials
- 12.1.7.4. SWOT Analysis
- 12.1.8 ACM Shipping Group PLC
- 12.1.8.1. Company Overview
- 12.1.8.2. Products
- 12.1.8.3. Company Financials
- 12.1.8.4. SWOT Analysis
- 12.1.9 Chowgule Brothers Pvt Ltd
- 12.1.9.1. Company Overview
- 12.1.9.2. Products
- 12.1.9.3. Company Financials
- 12.1.9.4. SWOT Analysis
- 12.1.10 Affinity (Shipping) LLP**List Not Exhaustive
- 12.1.10.1. Company Overview
- 12.1.10.2. Products
- 12.1.10.3. Company Financials
- 12.1.10.4. SWOT Analysis
- 12.1.1 Aries Shipbroking (Asia) Pte Ltd
- 12.2. Market Entropy
- 12.2.1 Company's Key Areas Served
- 12.2.2 Recent Developments
- 12.3. Company Market Share Analysis 2025
- 12.3.1 Top 5 Companies Market Share Analysis
- 12.3.2 Top 3 Companies Market Share Analysis
- 12.4. List of Potential Customers
- 13. Research Methodology
List of Figures
- Figure 1: Global Shipbroking Market Revenue Breakdown (Million, %) by Region 2025 & 2033
- Figure 2: Global Shipbroking Market Volume Breakdown (Billion, %) by Region 2025 & 2033
- Figure 3: North America Shipbroking Market Revenue (Million), by Type 2025 & 2033
- Figure 4: North America Shipbroking Market Volume (Billion), by Type 2025 & 2033
- Figure 5: North America Shipbroking Market Revenue Share (%), by Type 2025 & 2033
- Figure 6: North America Shipbroking Market Volume Share (%), by Type 2025 & 2033
- Figure 7: North America Shipbroking Market Revenue (Million), by Service 2025 & 2033
- Figure 8: North America Shipbroking Market Volume (Billion), by Service 2025 & 2033
- Figure 9: North America Shipbroking Market Revenue Share (%), by Service 2025 & 2033
- Figure 10: North America Shipbroking Market Volume Share (%), by Service 2025 & 2033
- Figure 11: North America Shipbroking Market Revenue (Million), by Industry 2025 & 2033
- Figure 12: North America Shipbroking Market Volume (Billion), by Industry 2025 & 2033
- Figure 13: North America Shipbroking Market Revenue Share (%), by Industry 2025 & 2033
- Figure 14: North America Shipbroking Market Volume Share (%), by Industry 2025 & 2033
- Figure 15: North America Shipbroking Market Revenue (Million), by Country 2025 & 2033
- Figure 16: North America Shipbroking Market Volume (Billion), by Country 2025 & 2033
- Figure 17: North America Shipbroking Market Revenue Share (%), by Country 2025 & 2033
- Figure 18: North America Shipbroking Market Volume Share (%), by Country 2025 & 2033
- Figure 19: Europe Shipbroking Market Revenue (Million), by Type 2025 & 2033
- Figure 20: Europe Shipbroking Market Volume (Billion), by Type 2025 & 2033
- Figure 21: Europe Shipbroking Market Revenue Share (%), by Type 2025 & 2033
- Figure 22: Europe Shipbroking Market Volume Share (%), by Type 2025 & 2033
- Figure 23: Europe Shipbroking Market Revenue (Million), by Service 2025 & 2033
- Figure 24: Europe Shipbroking Market Volume (Billion), by Service 2025 & 2033
- Figure 25: Europe Shipbroking Market Revenue Share (%), by Service 2025 & 2033
- Figure 26: Europe Shipbroking Market Volume Share (%), by Service 2025 & 2033
- Figure 27: Europe Shipbroking Market Revenue (Million), by Industry 2025 & 2033
- Figure 28: Europe Shipbroking Market Volume (Billion), by Industry 2025 & 2033
- Figure 29: Europe Shipbroking Market Revenue Share (%), by Industry 2025 & 2033
- Figure 30: Europe Shipbroking Market Volume Share (%), by Industry 2025 & 2033
- Figure 31: Europe Shipbroking Market Revenue (Million), by Country 2025 & 2033
- Figure 32: Europe Shipbroking Market Volume (Billion), by Country 2025 & 2033
- Figure 33: Europe Shipbroking Market Revenue Share (%), by Country 2025 & 2033
- Figure 34: Europe Shipbroking Market Volume Share (%), by Country 2025 & 2033
- Figure 35: Asia Pacific Shipbroking Market Revenue (Million), by Type 2025 & 2033
- Figure 36: Asia Pacific Shipbroking Market Volume (Billion), by Type 2025 & 2033
- Figure 37: Asia Pacific Shipbroking Market Revenue Share (%), by Type 2025 & 2033
- Figure 38: Asia Pacific Shipbroking Market Volume Share (%), by Type 2025 & 2033
- Figure 39: Asia Pacific Shipbroking Market Revenue (Million), by Service 2025 & 2033
- Figure 40: Asia Pacific Shipbroking Market Volume (Billion), by Service 2025 & 2033
- Figure 41: Asia Pacific Shipbroking Market Revenue Share (%), by Service 2025 & 2033
- Figure 42: Asia Pacific Shipbroking Market Volume Share (%), by Service 2025 & 2033
- Figure 43: Asia Pacific Shipbroking Market Revenue (Million), by Industry 2025 & 2033
- Figure 44: Asia Pacific Shipbroking Market Volume (Billion), by Industry 2025 & 2033
- Figure 45: Asia Pacific Shipbroking Market Revenue Share (%), by Industry 2025 & 2033
- Figure 46: Asia Pacific Shipbroking Market Volume Share (%), by Industry 2025 & 2033
- Figure 47: Asia Pacific Shipbroking Market Revenue (Million), by Country 2025 & 2033
- Figure 48: Asia Pacific Shipbroking Market Volume (Billion), by Country 2025 & 2033
- Figure 49: Asia Pacific Shipbroking Market Revenue Share (%), by Country 2025 & 2033
- Figure 50: Asia Pacific Shipbroking Market Volume Share (%), by Country 2025 & 2033
- Figure 51: South America Shipbroking Market Revenue (Million), by Type 2025 & 2033
- Figure 52: South America Shipbroking Market Volume (Billion), by Type 2025 & 2033
- Figure 53: South America Shipbroking Market Revenue Share (%), by Type 2025 & 2033
- Figure 54: South America Shipbroking Market Volume Share (%), by Type 2025 & 2033
- Figure 55: South America Shipbroking Market Revenue (Million), by Service 2025 & 2033
- Figure 56: South America Shipbroking Market Volume (Billion), by Service 2025 & 2033
- Figure 57: South America Shipbroking Market Revenue Share (%), by Service 2025 & 2033
- Figure 58: South America Shipbroking Market Volume Share (%), by Service 2025 & 2033
- Figure 59: South America Shipbroking Market Revenue (Million), by Industry 2025 & 2033
- Figure 60: South America Shipbroking Market Volume (Billion), by Industry 2025 & 2033
- Figure 61: South America Shipbroking Market Revenue Share (%), by Industry 2025 & 2033
- Figure 62: South America Shipbroking Market Volume Share (%), by Industry 2025 & 2033
- Figure 63: South America Shipbroking Market Revenue (Million), by Country 2025 & 2033
- Figure 64: South America Shipbroking Market Volume (Billion), by Country 2025 & 2033
- Figure 65: South America Shipbroking Market Revenue Share (%), by Country 2025 & 2033
- Figure 66: South America Shipbroking Market Volume Share (%), by Country 2025 & 2033
- Figure 67: Middle East and Africa Shipbroking Market Revenue (Million), by Type 2025 & 2033
- Figure 68: Middle East and Africa Shipbroking Market Volume (Billion), by Type 2025 & 2033
- Figure 69: Middle East and Africa Shipbroking Market Revenue Share (%), by Type 2025 & 2033
- Figure 70: Middle East and Africa Shipbroking Market Volume Share (%), by Type 2025 & 2033
- Figure 71: Middle East and Africa Shipbroking Market Revenue (Million), by Service 2025 & 2033
- Figure 72: Middle East and Africa Shipbroking Market Volume (Billion), by Service 2025 & 2033
- Figure 73: Middle East and Africa Shipbroking Market Revenue Share (%), by Service 2025 & 2033
- Figure 74: Middle East and Africa Shipbroking Market Volume Share (%), by Service 2025 & 2033
- Figure 75: Middle East and Africa Shipbroking Market Revenue (Million), by Industry 2025 & 2033
- Figure 76: Middle East and Africa Shipbroking Market Volume (Billion), by Industry 2025 & 2033
- Figure 77: Middle East and Africa Shipbroking Market Revenue Share (%), by Industry 2025 & 2033
- Figure 78: Middle East and Africa Shipbroking Market Volume Share (%), by Industry 2025 & 2033
- Figure 79: Middle East and Africa Shipbroking Market Revenue (Million), by Country 2025 & 2033
- Figure 80: Middle East and Africa Shipbroking Market Volume (Billion), by Country 2025 & 2033
- Figure 81: Middle East and Africa Shipbroking Market Revenue Share (%), by Country 2025 & 2033
- Figure 82: Middle East and Africa Shipbroking Market Volume Share (%), by Country 2025 & 2033
List of Tables
- Table 1: Global Shipbroking Market Revenue Million Forecast, by Type 2020 & 2033
- Table 2: Global Shipbroking Market Volume Billion Forecast, by Type 2020 & 2033
- Table 3: Global Shipbroking Market Revenue Million Forecast, by Service 2020 & 2033
- Table 4: Global Shipbroking Market Volume Billion Forecast, by Service 2020 & 2033
- Table 5: Global Shipbroking Market Revenue Million Forecast, by Industry 2020 & 2033
- Table 6: Global Shipbroking Market Volume Billion Forecast, by Industry 2020 & 2033
- Table 7: Global Shipbroking Market Revenue Million Forecast, by Region 2020 & 2033
- Table 8: Global Shipbroking Market Volume Billion Forecast, by Region 2020 & 2033
- Table 9: Global Shipbroking Market Revenue Million Forecast, by Type 2020 & 2033
- Table 10: Global Shipbroking Market Volume Billion Forecast, by Type 2020 & 2033
- Table 11: Global Shipbroking Market Revenue Million Forecast, by Service 2020 & 2033
- Table 12: Global Shipbroking Market Volume Billion Forecast, by Service 2020 & 2033
- Table 13: Global Shipbroking Market Revenue Million Forecast, by Industry 2020 & 2033
- Table 14: Global Shipbroking Market Volume Billion Forecast, by Industry 2020 & 2033
- Table 15: Global Shipbroking Market Revenue Million Forecast, by Country 2020 & 2033
- Table 16: Global Shipbroking Market Volume Billion Forecast, by Country 2020 & 2033
- Table 17: United States Shipbroking Market Revenue (Million) Forecast, by Application 2020 & 2033
- Table 18: United States Shipbroking Market Volume (Billion) Forecast, by Application 2020 & 2033
- Table 19: Canada Shipbroking Market Revenue (Million) Forecast, by Application 2020 & 2033
- Table 20: Canada Shipbroking Market Volume (Billion) Forecast, by Application 2020 & 2033
- Table 21: Rest of North America Shipbroking Market Revenue (Million) Forecast, by Application 2020 & 2033
- Table 22: Rest of North America Shipbroking Market Volume (Billion) Forecast, by Application 2020 & 2033
- Table 23: Global Shipbroking Market Revenue Million Forecast, by Type 2020 & 2033
- Table 24: Global Shipbroking Market Volume Billion Forecast, by Type 2020 & 2033
- Table 25: Global Shipbroking Market Revenue Million Forecast, by Service 2020 & 2033
- Table 26: Global Shipbroking Market Volume Billion Forecast, by Service 2020 & 2033
- Table 27: Global Shipbroking Market Revenue Million Forecast, by Industry 2020 & 2033
- Table 28: Global Shipbroking Market Volume Billion Forecast, by Industry 2020 & 2033
- Table 29: Global Shipbroking Market Revenue Million Forecast, by Country 2020 & 2033
- Table 30: Global Shipbroking Market Volume Billion Forecast, by Country 2020 & 2033
- Table 31: Germany Shipbroking Market Revenue (Million) Forecast, by Application 2020 & 2033
- Table 32: Germany Shipbroking Market Volume (Billion) Forecast, by Application 2020 & 2033
- Table 33: United Kingdom Shipbroking Market Revenue (Million) Forecast, by Application 2020 & 2033
- Table 34: United Kingdom Shipbroking Market Volume (Billion) Forecast, by Application 2020 & 2033
- Table 35: France Shipbroking Market Revenue (Million) Forecast, by Application 2020 & 2033
- Table 36: France Shipbroking Market Volume (Billion) Forecast, by Application 2020 & 2033
- Table 37: Russia Shipbroking Market Revenue (Million) Forecast, by Application 2020 & 2033
- Table 38: Russia Shipbroking Market Volume (Billion) Forecast, by Application 2020 & 2033
- Table 39: Spain Shipbroking Market Revenue (Million) Forecast, by Application 2020 & 2033
- Table 40: Spain Shipbroking Market Volume (Billion) Forecast, by Application 2020 & 2033
- Table 41: Rest of Europe Shipbroking Market Revenue (Million) Forecast, by Application 2020 & 2033
- Table 42: Rest of Europe Shipbroking Market Volume (Billion) Forecast, by Application 2020 & 2033
- Table 43: Global Shipbroking Market Revenue Million Forecast, by Type 2020 & 2033
- Table 44: Global Shipbroking Market Volume Billion Forecast, by Type 2020 & 2033
- Table 45: Global Shipbroking Market Revenue Million Forecast, by Service 2020 & 2033
- Table 46: Global Shipbroking Market Volume Billion Forecast, by Service 2020 & 2033
- Table 47: Global Shipbroking Market Revenue Million Forecast, by Industry 2020 & 2033
- Table 48: Global Shipbroking Market Volume Billion Forecast, by Industry 2020 & 2033
- Table 49: Global Shipbroking Market Revenue Million Forecast, by Country 2020 & 2033
- Table 50: Global Shipbroking Market Volume Billion Forecast, by Country 2020 & 2033
- Table 51: India Shipbroking Market Revenue (Million) Forecast, by Application 2020 & 2033
- Table 52: India Shipbroking Market Volume (Billion) Forecast, by Application 2020 & 2033
- Table 53: China Shipbroking Market Revenue (Million) Forecast, by Application 2020 & 2033
- Table 54: China Shipbroking Market Volume (Billion) Forecast, by Application 2020 & 2033
- Table 55: Japan Shipbroking Market Revenue (Million) Forecast, by Application 2020 & 2033
- Table 56: Japan Shipbroking Market Volume (Billion) Forecast, by Application 2020 & 2033
- Table 57: Rest of Asia Pacific Shipbroking Market Revenue (Million) Forecast, by Application 2020 & 2033
- Table 58: Rest of Asia Pacific Shipbroking Market Volume (Billion) Forecast, by Application 2020 & 2033
- Table 59: Global Shipbroking Market Revenue Million Forecast, by Type 2020 & 2033
- Table 60: Global Shipbroking Market Volume Billion Forecast, by Type 2020 & 2033
- Table 61: Global Shipbroking Market Revenue Million Forecast, by Service 2020 & 2033
- Table 62: Global Shipbroking Market Volume Billion Forecast, by Service 2020 & 2033
- Table 63: Global Shipbroking Market Revenue Million Forecast, by Industry 2020 & 2033
- Table 64: Global Shipbroking Market Volume Billion Forecast, by Industry 2020 & 2033
- Table 65: Global Shipbroking Market Revenue Million Forecast, by Country 2020 & 2033
- Table 66: Global Shipbroking Market Volume Billion Forecast, by Country 2020 & 2033
- Table 67: Brazil Shipbroking Market Revenue (Million) Forecast, by Application 2020 & 2033
- Table 68: Brazil Shipbroking Market Volume (Billion) Forecast, by Application 2020 & 2033
- Table 69: Argentina Shipbroking Market Revenue (Million) Forecast, by Application 2020 & 2033
- Table 70: Argentina Shipbroking Market Volume (Billion) Forecast, by Application 2020 & 2033
- Table 71: Rest of South America Shipbroking Market Revenue (Million) Forecast, by Application 2020 & 2033
- Table 72: Rest of South America Shipbroking Market Volume (Billion) Forecast, by Application 2020 & 2033
- Table 73: Global Shipbroking Market Revenue Million Forecast, by Type 2020 & 2033
- Table 74: Global Shipbroking Market Volume Billion Forecast, by Type 2020 & 2033
- Table 75: Global Shipbroking Market Revenue Million Forecast, by Service 2020 & 2033
- Table 76: Global Shipbroking Market Volume Billion Forecast, by Service 2020 & 2033
- Table 77: Global Shipbroking Market Revenue Million Forecast, by Industry 2020 & 2033
- Table 78: Global Shipbroking Market Volume Billion Forecast, by Industry 2020 & 2033
- Table 79: Global Shipbroking Market Revenue Million Forecast, by Country 2020 & 2033
- Table 80: Global Shipbroking Market Volume Billion Forecast, by Country 2020 & 2033
- Table 81: United Arab Emirates Shipbroking Market Revenue (Million) Forecast, by Application 2020 & 2033
- Table 82: United Arab Emirates Shipbroking Market Volume (Billion) Forecast, by Application 2020 & 2033
- Table 83: Saudi Arabia Shipbroking Market Revenue (Million) Forecast, by Application 2020 & 2033
- Table 84: Saudi Arabia Shipbroking Market Volume (Billion) Forecast, by Application 2020 & 2033
- Table 85: Rest of Middle East and Africa Shipbroking Market Revenue (Million) Forecast, by Application 2020 & 2033
- Table 86: Rest of Middle East and Africa Shipbroking Market Volume (Billion) Forecast, by Application 2020 & 2033
Frequently Asked Questions
1. What is the projected Compound Annual Growth Rate (CAGR) of the Shipbroking Market?
The projected CAGR is approximately 3.65%.
2. Which companies are prominent players in the Shipbroking Market?
Key companies in the market include Aries Shipbroking (Asia) Pte Ltd, BRS Group, Braemar Shipping Services PLC, Clarkson PLC, Howe Robinson Partners, Simpson Spense Young, Fearnleys A/S, ACM Shipping Group PLC, Chowgule Brothers Pvt Ltd, Affinity (Shipping) LLP**List Not Exhaustive.
3. What are the main segments of the Shipbroking Market?
The market segments include Type, Service, Industry.
4. Can you provide details about the market size?
The market size is estimated to be USD 1.49 Million as of 2022.
5. What are some drivers contributing to market growth?
Rise in Maritime Transport is Driving the Market; The Increasing Interconnectedness of Global Markets.
6. What are the notable trends driving market growth?
Rise in Oil and Gas Industry is Driving the Shipbroking Market.
7. Are there any restraints impacting market growth?
Rise in Maritime Transport is Driving the Market; The Increasing Interconnectedness of Global Markets.
8. Can you provide examples of recent developments in the market?
January 2024: The Danish shipping giant Maersk announced a significant long-term collaboration with its German counterpart, Hapag-Lloyd, consolidating hundreds of vessels under this partnership.September 2023: Global container liner shipping business ZIM Integrated Shipping Services Ltd signed a new operational collaboration agreement spanning many trades with MSC, the industry leader. This partnership is intended to improve service standards for ZIM's esteemed clientele and greatly increase operating efficiencies.
9. What pricing options are available for accessing the report?
Pricing options include single-user, multi-user, and enterprise licenses priced at USD 4750, USD 5250, and USD 8750 respectively.
10. Is the market size provided in terms of value or volume?
The market size is provided in terms of value, measured in Million and volume, measured in Billion.
11. Are there any specific market keywords associated with the report?
Yes, the market keyword associated with the report is "Shipbroking Market," which aids in identifying and referencing the specific market segment covered.
12. How do I determine which pricing option suits my needs best?
The pricing options vary based on user requirements and access needs. Individual users may opt for single-user licenses, while businesses requiring broader access may choose multi-user or enterprise licenses for cost-effective access to the report.
13. Are there any additional resources or data provided in the Shipbroking Market report?
While the report offers comprehensive insights, it's advisable to review the specific contents or supplementary materials provided to ascertain if additional resources or data are available.
14. How can I stay updated on further developments or reports in the Shipbroking Market?
To stay informed about further developments, trends, and reports in the Shipbroking Market, consider subscribing to industry newsletters, following relevant companies and organizations, or regularly checking reputable industry news sources and publications.
Methodology
Step 1 - Identification of Relevant Samples Size from Population Database


Step 2 - Approaches for Defining Global Market Size (Value, Volume* & Price*)

Note*: In applicable scenarios
Step 3 - Data Sources
Primary Research
- Web Analytics
- Survey Reports
- Research Institute
- Latest Research Reports
- Opinion Leaders
Secondary Research
- Annual Reports
- White Paper
- Latest Press Release
- Industry Association
- Paid Database
- Investor Presentations

Step 4 - Data Triangulation
Involves using different sources of information in order to increase the validity of a study
These sources are likely to be stakeholders in a program - participants, other researchers, program staff, other community members, and so on.
Then we put all data in single framework & apply various statistical tools to find out the dynamic on the market.
During the analysis stage, feedback from the stakeholder groups would be compared to determine areas of agreement as well as areas of divergence