
Key Insights
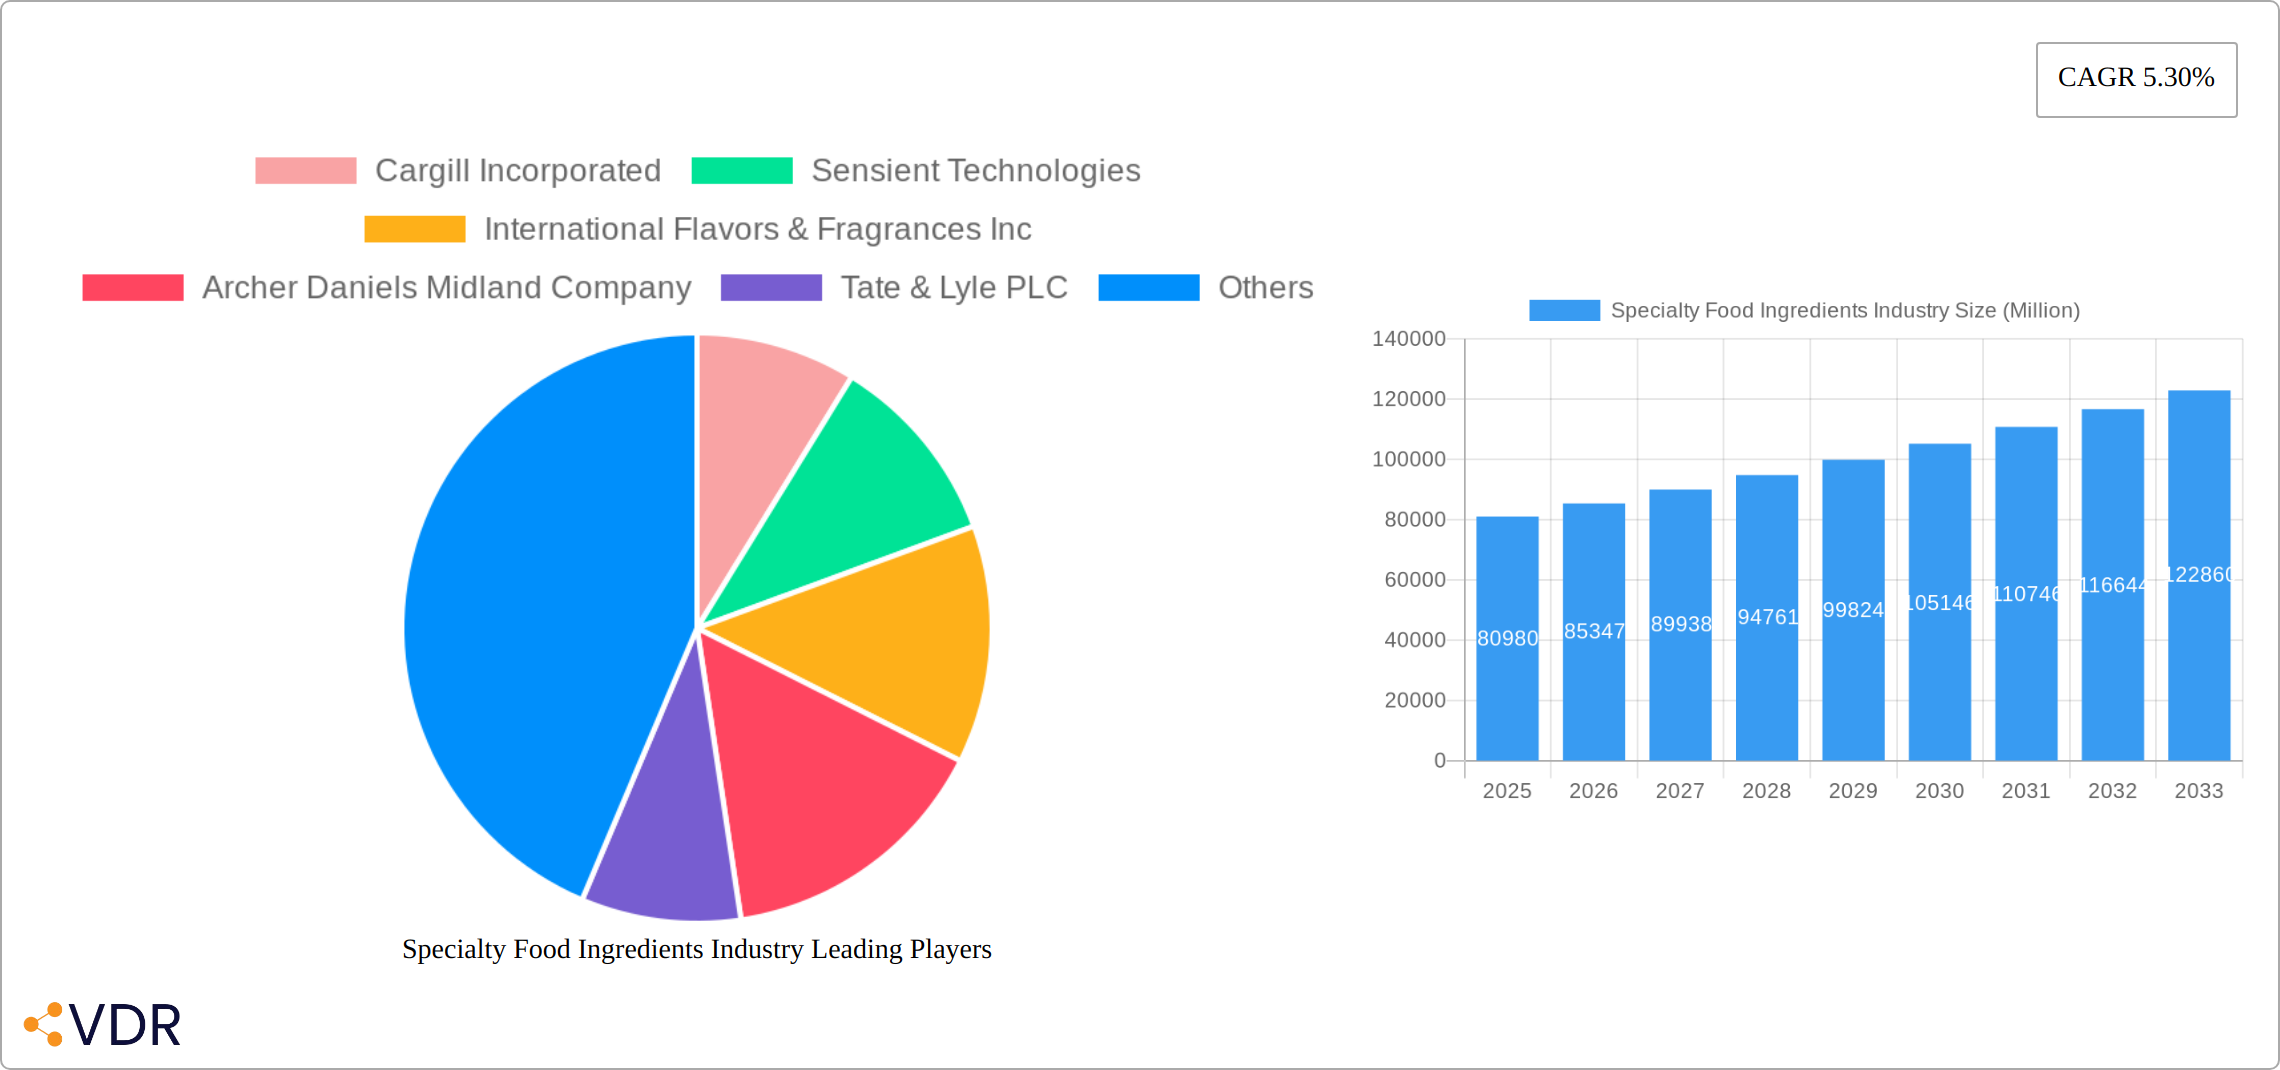
The global specialty food ingredients market, valued at $80.98 billion in 2025, is projected to experience robust growth, driven by several key factors. The increasing demand for convenient and healthy food products fuels the adoption of specialty ingredients that enhance taste, texture, and nutritional value. Consumers are increasingly seeking clean-label products with natural and minimally processed ingredients, driving demand for functional food ingredients, natural sweeteners, and clean-label preservatives. The burgeoning food processing industry, particularly in developing economies like India and China, further contributes to market expansion. Growth is also propelled by innovation in product development, with companies focusing on creating novel ingredients that cater to specific dietary needs and preferences, such as plant-based alternatives and gluten-free options. Specific segments like functional food ingredients and specialty starches are expected to witness particularly high growth due to their versatility in various food applications. However, fluctuating raw material prices and stringent regulatory requirements pose challenges to market expansion. Despite these constraints, the market's overall trajectory remains positive, fueled by consistent consumer demand and continuous innovation within the food and beverage sector.
A regional analysis reveals significant market share distribution across North America, Europe, and Asia Pacific. North America holds a dominant position, driven by high consumer spending on processed and convenient foods, and a strong presence of major food ingredient manufacturers. However, the Asia Pacific region is expected to witness the fastest growth rate due to rising disposable incomes, changing dietary habits, and a burgeoning middle class increasingly seeking diverse and convenient food options. Europe, while a significant market, faces slower growth due to relatively mature markets and stringent regulations. Emerging economies in South America and the Middle East are also expected to contribute to market expansion, though at a slower pace compared to Asia Pacific. Competitive dynamics are characterized by the presence of several multinational corporations and smaller specialized players. The market is witnessing strategic collaborations, mergers, and acquisitions as companies seek to expand their product portfolios and geographical reach to maintain their competitive edge. The forecast period (2025-2033) anticipates continued growth, driven by ongoing trends in consumer preferences and technological advancements within the food ingredient sector. A CAGR of 5.30% indicates a significant expansion potential for the industry during this period.
Specialty Food Ingredients Industry Market Report: 2019-2033
This comprehensive report provides an in-depth analysis of the Specialty Food Ingredients market, encompassing historical data (2019-2024), current estimates (2025), and future projections (2025-2033). We explore market dynamics, growth trends, key players, and emerging opportunities across diverse segments, including parent markets like Functional Foods and child markets such as Bakery Products and Plant-Based Foods. The report is invaluable for industry professionals, investors, and strategic decision-makers seeking a clear understanding of this dynamic sector. The market size is projected to reach xx Million by 2033.
Specialty Food Ingredients Industry Market Dynamics & Structure
The specialty food ingredients market is characterized by a moderately concentrated landscape, with key players like Cargill, DSM, and IFF holding significant market share. Technological innovation, particularly in areas like clean-label ingredients and functional foods, is a major driver. Stringent regulatory frameworks concerning food safety and labeling influence product development and market access. The market experiences competitive pressure from substitute ingredients, with consumers increasingly demanding natural and organic alternatives. M&A activity is substantial, reflecting the industry's consolidation trend and the pursuit of innovation and market expansion.
- Market Concentration: Top 5 players hold approximately xx% market share in 2025.
- Technological Innovation: Focus on clean-label, sustainable, and functional ingredients.
- Regulatory Framework: Stringent food safety and labeling regulations drive product development.
- Competitive Substitutes: Growing demand for natural and organic alternatives poses a challenge.
- M&A Activity: High volume of mergers and acquisitions, with xx deals recorded between 2019-2024.
- End-User Demographics: Shifting consumer preferences towards health and wellness are significant drivers.
Specialty Food Ingredients Industry Growth Trends & Insights
The specialty food ingredients market is experiencing robust growth, driven by several factors. The increasing demand for convenient, healthy, and functional foods fuels the adoption of specialty ingredients across diverse applications. Technological advancements enable the development of novel ingredients with enhanced functionalities and improved nutritional profiles. Consumer behavior shifts towards premiumization and personalized nutrition further contribute to market expansion. The market is expected to exhibit a CAGR of xx% during the forecast period (2025-2033), reaching an estimated value of xx Million by 2033. Market penetration of specific ingredients like plant-based proteins is showing significant growth, with xx% penetration in 2025, expected to reach xx% by 2033. Technological disruptions, such as precision fermentation and advanced extraction techniques, are streamlining production and expanding ingredient options. The rising prevalence of health conditions like obesity and diabetes is driving the demand for sugar substitutes and other functional ingredients.

Dominant Regions, Countries, or Segments in Specialty Food Ingredients Industry
North America and Europe currently dominate the specialty food ingredients market, driven by high consumer demand for processed foods and strong regulatory frameworks. However, Asia-Pacific is expected to experience rapid growth due to rising disposable incomes, expanding food processing industries, and changing dietary habits. Within product types, sweeteners, food flavors and enhancers, and functional food ingredients are the leading segments, reflecting consumer preferences for taste enhancement and health benefits. The Bakery Products application segment is particularly strong, due to consistent demand for diverse products with longer shelf life. Plant-based food & beverage is a fast-growing segment driven by health and sustainability trends.
- Key Drivers (North America & Europe): High processed food consumption, robust regulatory frameworks, strong R&D investment.
- Key Drivers (Asia-Pacific): Rising disposable incomes, expanding food processing sector, changing dietary habits.
- Leading Segments (Product Type): Sweeteners, Food Flavors and Enhancers, Functional Food Ingredients.
- Leading Segments (Application): Bakery Products, Beverages, Plant-based Food & Beverage.
Specialty Food Ingredients Industry Product Landscape
The specialty food ingredients market showcases continuous innovation, with a focus on clean-label, natural, and sustainably sourced ingredients. Product development emphasizes functionalities such as texture improvement, taste enhancement, and extended shelf life. Advancements in biotechnology and fermentation technology are crucial in creating novel ingredients with unique selling propositions. Companies are increasingly focusing on delivering tailored solutions that cater to specific dietary needs and consumer preferences, creating a highly competitive and innovative product landscape.
Key Drivers, Barriers & Challenges in Specialty Food Ingredients Industry
Key Drivers: Growing demand for processed and functional foods, increasing health awareness, technological advancements driving innovation. Government incentives and investments in food technology further accelerate growth.
Challenges: Fluctuating raw material prices, stringent regulations impacting product development and market access, intense competition from established and emerging players. Supply chain disruptions and geopolitical instability further influence market dynamics, potentially causing price increases and shortages.
Emerging Opportunities in Specialty Food Ingredients Industry
Significant opportunities exist in plant-based foods and beverages, personalized nutrition, and functional ingredients catering to specific health conditions. Demand for clean-label and sustainable ingredients presents a substantial growth avenue. Exploring new markets in developing economies offers significant potential for expansion. Developing innovative applications for existing ingredients, targeting niches such as probiotics and prebiotics, can unlock new revenue streams.
Growth Accelerators in the Specialty Food Ingredients Industry
Technological advancements, strategic partnerships and collaborations, and expansion into new geographic markets and application areas are driving long-term growth. Companies are increasingly adopting digital technologies to streamline operations, improve supply chain efficiency, and enhance customer engagement. The focus on sustainability and reduced environmental impact is a significant driver as well.
Key Players Shaping the Specialty Food Ingredients Industry Market
- Cargill Incorporated
- Sensient Technologies
- International Flavors & Fragrances Inc
- Archer Daniels Midland Company
- Tate & Lyle PLC
- Kerry Group PLC
- Koninklijke DSM NV
- Axiom Foods Inc
- Ingredion Incorporated
- Novozymes A/S
Notable Milestones in Specialty Food Ingredients Industry Sector
- Nov 2022: Tate & Lyle launched Erytesse erythritol sweetener, expanding its healthier product offerings.
- Oct 2022: International Flavors & Fragrances Inc. invested USD 30 million in a Singapore innovation center.
- Sept 2022: Royal DSM acquired First Choice Ingredients for USD 453 million, strengthening its dairy-based flavorings portfolio.
In-Depth Specialty Food Ingredients Industry Market Outlook
The specialty food ingredients market is poised for continued expansion, driven by innovation, evolving consumer preferences, and strategic investments. The focus on health, sustainability, and convenience will shape future market trends. Companies that effectively leverage technological advancements, build strong supply chains, and adapt to evolving regulatory landscapes are best positioned to capitalize on future growth opportunities. The market’s potential lies in its ability to meet rising consumer demand for functional, natural, and convenient food products.
Specialty Food Ingredients Industry Segmentation
-
1. Product Type
- 1.1. Functional Food Ingredient
- 1.2. Specialty Starch and Texturants
- 1.3. Sweetener
- 1.4. Food Flavors and Enhancers
- 1.5. Acidulants
- 1.6. Preservatives
- 1.7. Emulsifiers
- 1.8. Colorants
- 1.9. Enzymes
- 1.10. Cultures
- 1.11. Proteins
- 1.12. Speciality Fats and Oils
- 1.13. Food Hydrocolloids and Polysaccharides
- 1.14. Anti-Caking Agents
- 1.15. Yeast
- 1.16. Food-Grade Glycerin
-
2. Application
- 2.1. Bakery Products
- 2.2. Beverages
- 2.3. Meat, Poultry and Seafood
- 2.4. Dairy Products
- 2.5. Confectionery
- 2.6. Fats and Oils
- 2.7. Dressings/Condiments/Sauces/Marinade
- 2.8. Pasta, Soup and Noodles
- 2.9. Prepared Food
- 2.10. Plant-based Food & Beverage
- 2.11. Other Applications
Specialty Food Ingredients Industry Segmentation By Geography
-
1. North America
- 1.1. United States
- 1.2. Canada
- 1.3. Mexico
- 1.4. Rest of North America
-
2. Europe
- 2.1. Germany
- 2.2. United Kingdom
- 2.3. France
- 2.4. Spain
- 2.5. Italy
- 2.6. Russia
- 2.7. Rest of Europe
-
3. Asia Pacific
- 3.1. China
- 3.2. India
- 3.3. Japan
- 3.4. Australia
- 3.5. Rest of Asia Pacific
-
4. South America
- 4.1. Brazil
- 4.2. Argentina
- 4.3. Rest of South America
- 5. Middle East
-
6. United Arab Emirates
- 6.1. South Africa
- 6.2. Rest of Middle East

Specialty Food Ingredients Industry REPORT HIGHLIGHTS
| Aspects | Details |
|---|---|
| Study Period | 2019-2033 |
| Base Year | 2024 |
| Estimated Year | 2025 |
| Forecast Period | 2025-2033 |
| Historical Period | 2019-2024 |
| Growth Rate | CAGR of 5.30% from 2019-2033 |
| Segmentation |
|
Table of Contents
- 1. Introduction
- 1.1. Research Scope
- 1.2. Market Segmentation
- 1.3. Research Methodology
- 1.4. Definitions and Assumptions
- 2. Executive Summary
- 2.1. Introduction
- 3. Market Dynamics
- 3.1. Introduction
- 3.2. Market Drivers
- 3.2.1. Wide Applications and Functionality; Demand For Gluten-Free Products
- 3.3. Market Restrains
- 3.3.1. Easy Availability of Economically Feasible Alternatives
- 3.4. Market Trends
- 3.4.1. Escalated Demand for Fortified Processed Food
- 4. Market Factor Analysis
- 4.1. Porters Five Forces
- 4.2. Supply/Value Chain
- 4.3. PESTEL analysis
- 4.4. Market Entropy
- 4.5. Patent/Trademark Analysis
- 5. Global Specialty Food Ingredients Industry Analysis, Insights and Forecast, 2019-2031
- 5.1. Market Analysis, Insights and Forecast - by Product Type
- 5.1.1. Functional Food Ingredient
- 5.1.2. Specialty Starch and Texturants
- 5.1.3. Sweetener
- 5.1.4. Food Flavors and Enhancers
- 5.1.5. Acidulants
- 5.1.6. Preservatives
- 5.1.7. Emulsifiers
- 5.1.8. Colorants
- 5.1.9. Enzymes
- 5.1.10. Cultures
- 5.1.11. Proteins
- 5.1.12. Speciality Fats and Oils
- 5.1.13. Food Hydrocolloids and Polysaccharides
- 5.1.14. Anti-Caking Agents
- 5.1.15. Yeast
- 5.1.16. Food-Grade Glycerin
- 5.2. Market Analysis, Insights and Forecast - by Application
- 5.2.1. Bakery Products
- 5.2.2. Beverages
- 5.2.3. Meat, Poultry and Seafood
- 5.2.4. Dairy Products
- 5.2.5. Confectionery
- 5.2.6. Fats and Oils
- 5.2.7. Dressings/Condiments/Sauces/Marinade
- 5.2.8. Pasta, Soup and Noodles
- 5.2.9. Prepared Food
- 5.2.10. Plant-based Food & Beverage
- 5.2.11. Other Applications
- 5.3. Market Analysis, Insights and Forecast - by Region
- 5.3.1. North America
- 5.3.2. Europe
- 5.3.3. Asia Pacific
- 5.3.4. South America
- 5.3.5. Middle East
- 5.3.6. United Arab Emirates
- 5.1. Market Analysis, Insights and Forecast - by Product Type
- 6. North America Specialty Food Ingredients Industry Analysis, Insights and Forecast, 2019-2031
- 6.1. Market Analysis, Insights and Forecast - by Product Type
- 6.1.1. Functional Food Ingredient
- 6.1.2. Specialty Starch and Texturants
- 6.1.3. Sweetener
- 6.1.4. Food Flavors and Enhancers
- 6.1.5. Acidulants
- 6.1.6. Preservatives
- 6.1.7. Emulsifiers
- 6.1.8. Colorants
- 6.1.9. Enzymes
- 6.1.10. Cultures
- 6.1.11. Proteins
- 6.1.12. Speciality Fats and Oils
- 6.1.13. Food Hydrocolloids and Polysaccharides
- 6.1.14. Anti-Caking Agents
- 6.1.15. Yeast
- 6.1.16. Food-Grade Glycerin
- 6.2. Market Analysis, Insights and Forecast - by Application
- 6.2.1. Bakery Products
- 6.2.2. Beverages
- 6.2.3. Meat, Poultry and Seafood
- 6.2.4. Dairy Products
- 6.2.5. Confectionery
- 6.2.6. Fats and Oils
- 6.2.7. Dressings/Condiments/Sauces/Marinade
- 6.2.8. Pasta, Soup and Noodles
- 6.2.9. Prepared Food
- 6.2.10. Plant-based Food & Beverage
- 6.2.11. Other Applications
- 6.1. Market Analysis, Insights and Forecast - by Product Type
- 7. Europe Specialty Food Ingredients Industry Analysis, Insights and Forecast, 2019-2031
- 7.1. Market Analysis, Insights and Forecast - by Product Type
- 7.1.1. Functional Food Ingredient
- 7.1.2. Specialty Starch and Texturants
- 7.1.3. Sweetener
- 7.1.4. Food Flavors and Enhancers
- 7.1.5. Acidulants
- 7.1.6. Preservatives
- 7.1.7. Emulsifiers
- 7.1.8. Colorants
- 7.1.9. Enzymes
- 7.1.10. Cultures
- 7.1.11. Proteins
- 7.1.12. Speciality Fats and Oils
- 7.1.13. Food Hydrocolloids and Polysaccharides
- 7.1.14. Anti-Caking Agents
- 7.1.15. Yeast
- 7.1.16. Food-Grade Glycerin
- 7.2. Market Analysis, Insights and Forecast - by Application
- 7.2.1. Bakery Products
- 7.2.2. Beverages
- 7.2.3. Meat, Poultry and Seafood
- 7.2.4. Dairy Products
- 7.2.5. Confectionery
- 7.2.6. Fats and Oils
- 7.2.7. Dressings/Condiments/Sauces/Marinade
- 7.2.8. Pasta, Soup and Noodles
- 7.2.9. Prepared Food
- 7.2.10. Plant-based Food & Beverage
- 7.2.11. Other Applications
- 7.1. Market Analysis, Insights and Forecast - by Product Type
- 8. Asia Pacific Specialty Food Ingredients Industry Analysis, Insights and Forecast, 2019-2031
- 8.1. Market Analysis, Insights and Forecast - by Product Type
- 8.1.1. Functional Food Ingredient
- 8.1.2. Specialty Starch and Texturants
- 8.1.3. Sweetener
- 8.1.4. Food Flavors and Enhancers
- 8.1.5. Acidulants
- 8.1.6. Preservatives
- 8.1.7. Emulsifiers
- 8.1.8. Colorants
- 8.1.9. Enzymes
- 8.1.10. Cultures
- 8.1.11. Proteins
- 8.1.12. Speciality Fats and Oils
- 8.1.13. Food Hydrocolloids and Polysaccharides
- 8.1.14. Anti-Caking Agents
- 8.1.15. Yeast
- 8.1.16. Food-Grade Glycerin
- 8.2. Market Analysis, Insights and Forecast - by Application
- 8.2.1. Bakery Products
- 8.2.2. Beverages
- 8.2.3. Meat, Poultry and Seafood
- 8.2.4. Dairy Products
- 8.2.5. Confectionery
- 8.2.6. Fats and Oils
- 8.2.7. Dressings/Condiments/Sauces/Marinade
- 8.2.8. Pasta, Soup and Noodles
- 8.2.9. Prepared Food
- 8.2.10. Plant-based Food & Beverage
- 8.2.11. Other Applications
- 8.1. Market Analysis, Insights and Forecast - by Product Type
- 9. South America Specialty Food Ingredients Industry Analysis, Insights and Forecast, 2019-2031
- 9.1. Market Analysis, Insights and Forecast - by Product Type
- 9.1.1. Functional Food Ingredient
- 9.1.2. Specialty Starch and Texturants
- 9.1.3. Sweetener
- 9.1.4. Food Flavors and Enhancers
- 9.1.5. Acidulants
- 9.1.6. Preservatives
- 9.1.7. Emulsifiers
- 9.1.8. Colorants
- 9.1.9. Enzymes
- 9.1.10. Cultures
- 9.1.11. Proteins
- 9.1.12. Speciality Fats and Oils
- 9.1.13. Food Hydrocolloids and Polysaccharides
- 9.1.14. Anti-Caking Agents
- 9.1.15. Yeast
- 9.1.16. Food-Grade Glycerin
- 9.2. Market Analysis, Insights and Forecast - by Application
- 9.2.1. Bakery Products
- 9.2.2. Beverages
- 9.2.3. Meat, Poultry and Seafood
- 9.2.4. Dairy Products
- 9.2.5. Confectionery
- 9.2.6. Fats and Oils
- 9.2.7. Dressings/Condiments/Sauces/Marinade
- 9.2.8. Pasta, Soup and Noodles
- 9.2.9. Prepared Food
- 9.2.10. Plant-based Food & Beverage
- 9.2.11. Other Applications
- 9.1. Market Analysis, Insights and Forecast - by Product Type
- 10. Middle East Specialty Food Ingredients Industry Analysis, Insights and Forecast, 2019-2031
- 10.1. Market Analysis, Insights and Forecast - by Product Type
- 10.1.1. Functional Food Ingredient
- 10.1.2. Specialty Starch and Texturants
- 10.1.3. Sweetener
- 10.1.4. Food Flavors and Enhancers
- 10.1.5. Acidulants
- 10.1.6. Preservatives
- 10.1.7. Emulsifiers
- 10.1.8. Colorants
- 10.1.9. Enzymes
- 10.1.10. Cultures
- 10.1.11. Proteins
- 10.1.12. Speciality Fats and Oils
- 10.1.13. Food Hydrocolloids and Polysaccharides
- 10.1.14. Anti-Caking Agents
- 10.1.15. Yeast
- 10.1.16. Food-Grade Glycerin
- 10.2. Market Analysis, Insights and Forecast - by Application
- 10.2.1. Bakery Products
- 10.2.2. Beverages
- 10.2.3. Meat, Poultry and Seafood
- 10.2.4. Dairy Products
- 10.2.5. Confectionery
- 10.2.6. Fats and Oils
- 10.2.7. Dressings/Condiments/Sauces/Marinade
- 10.2.8. Pasta, Soup and Noodles
- 10.2.9. Prepared Food
- 10.2.10. Plant-based Food & Beverage
- 10.2.11. Other Applications
- 10.1. Market Analysis, Insights and Forecast - by Product Type
- 11. United Arab Emirates Specialty Food Ingredients Industry Analysis, Insights and Forecast, 2019-2031
- 11.1. Market Analysis, Insights and Forecast - by Product Type
- 11.1.1. Functional Food Ingredient
- 11.1.2. Specialty Starch and Texturants
- 11.1.3. Sweetener
- 11.1.4. Food Flavors and Enhancers
- 11.1.5. Acidulants
- 11.1.6. Preservatives
- 11.1.7. Emulsifiers
- 11.1.8. Colorants
- 11.1.9. Enzymes
- 11.1.10. Cultures
- 11.1.11. Proteins
- 11.1.12. Speciality Fats and Oils
- 11.1.13. Food Hydrocolloids and Polysaccharides
- 11.1.14. Anti-Caking Agents
- 11.1.15. Yeast
- 11.1.16. Food-Grade Glycerin
- 11.2. Market Analysis, Insights and Forecast - by Application
- 11.2.1. Bakery Products
- 11.2.2. Beverages
- 11.2.3. Meat, Poultry and Seafood
- 11.2.4. Dairy Products
- 11.2.5. Confectionery
- 11.2.6. Fats and Oils
- 11.2.7. Dressings/Condiments/Sauces/Marinade
- 11.2.8. Pasta, Soup and Noodles
- 11.2.9. Prepared Food
- 11.2.10. Plant-based Food & Beverage
- 11.2.11. Other Applications
- 11.1. Market Analysis, Insights and Forecast - by Product Type
- 12. North America Specialty Food Ingredients Industry Analysis, Insights and Forecast, 2019-2031
- 12.1. Market Analysis, Insights and Forecast - By Country/Sub-region
- 12.1.1 United States
- 12.1.2 Canada
- 12.1.3 Mexico
- 12.1.4 Rest of North America
- 13. Europe Specialty Food Ingredients Industry Analysis, Insights and Forecast, 2019-2031
- 13.1. Market Analysis, Insights and Forecast - By Country/Sub-region
- 13.1.1 Germany
- 13.1.2 United Kingdom
- 13.1.3 France
- 13.1.4 Spain
- 13.1.5 Italy
- 13.1.6 Russia
- 13.1.7 Rest of Europe
- 14. Asia Pacific Specialty Food Ingredients Industry Analysis, Insights and Forecast, 2019-2031
- 14.1. Market Analysis, Insights and Forecast - By Country/Sub-region
- 14.1.1 China
- 14.1.2 India
- 14.1.3 Japan
- 14.1.4 Australia
- 14.1.5 Rest of Asia Pacific
- 15. South America Specialty Food Ingredients Industry Analysis, Insights and Forecast, 2019-2031
- 15.1. Market Analysis, Insights and Forecast - By Country/Sub-region
- 15.1.1 Brazil
- 15.1.2 Argentina
- 15.1.3 Rest of South America
- 16. United Arab Emirates Specialty Food Ingredients Industry Analysis, Insights and Forecast, 2019-2031
- 16.1. Market Analysis, Insights and Forecast - By Country/Sub-region
- 16.1.1 South Africa
- 16.1.2 Rest of Middle East
- 17. Competitive Analysis
- 17.1. Global Market Share Analysis 2024
- 17.2. Company Profiles
- 17.2.1 Cargill Incorporated
- 17.2.1.1. Overview
- 17.2.1.2. Products
- 17.2.1.3. SWOT Analysis
- 17.2.1.4. Recent Developments
- 17.2.1.5. Financials (Based on Availability)
- 17.2.2 Sensient Technologies
- 17.2.2.1. Overview
- 17.2.2.2. Products
- 17.2.2.3. SWOT Analysis
- 17.2.2.4. Recent Developments
- 17.2.2.5. Financials (Based on Availability)
- 17.2.3 International Flavors & Fragrances Inc
- 17.2.3.1. Overview
- 17.2.3.2. Products
- 17.2.3.3. SWOT Analysis
- 17.2.3.4. Recent Developments
- 17.2.3.5. Financials (Based on Availability)
- 17.2.4 Archer Daniels Midland Company
- 17.2.4.1. Overview
- 17.2.4.2. Products
- 17.2.4.3. SWOT Analysis
- 17.2.4.4. Recent Developments
- 17.2.4.5. Financials (Based on Availability)
- 17.2.5 Tate & Lyle PLC
- 17.2.5.1. Overview
- 17.2.5.2. Products
- 17.2.5.3. SWOT Analysis
- 17.2.5.4. Recent Developments
- 17.2.5.5. Financials (Based on Availability)
- 17.2.6 Kerry Group PLC
- 17.2.6.1. Overview
- 17.2.6.2. Products
- 17.2.6.3. SWOT Analysis
- 17.2.6.4. Recent Developments
- 17.2.6.5. Financials (Based on Availability)
- 17.2.7 Koninklijke DSM NV
- 17.2.7.1. Overview
- 17.2.7.2. Products
- 17.2.7.3. SWOT Analysis
- 17.2.7.4. Recent Developments
- 17.2.7.5. Financials (Based on Availability)
- 17.2.8 Axiom Foods Inc
- 17.2.8.1. Overview
- 17.2.8.2. Products
- 17.2.8.3. SWOT Analysis
- 17.2.8.4. Recent Developments
- 17.2.8.5. Financials (Based on Availability)
- 17.2.9 Ingredion Incorporated
- 17.2.9.1. Overview
- 17.2.9.2. Products
- 17.2.9.3. SWOT Analysis
- 17.2.9.4. Recent Developments
- 17.2.9.5. Financials (Based on Availability)
- 17.2.10 Novozymes A/S
- 17.2.10.1. Overview
- 17.2.10.2. Products
- 17.2.10.3. SWOT Analysis
- 17.2.10.4. Recent Developments
- 17.2.10.5. Financials (Based on Availability)
- 17.2.1 Cargill Incorporated
List of Figures
- Figure 1: Global Specialty Food Ingredients Industry Revenue Breakdown (Million, %) by Region 2024 & 2032
- Figure 2: North America Specialty Food Ingredients Industry Revenue (Million), by Country 2024 & 2032
- Figure 3: North America Specialty Food Ingredients Industry Revenue Share (%), by Country 2024 & 2032
- Figure 4: Europe Specialty Food Ingredients Industry Revenue (Million), by Country 2024 & 2032
- Figure 5: Europe Specialty Food Ingredients Industry Revenue Share (%), by Country 2024 & 2032
- Figure 6: Asia Pacific Specialty Food Ingredients Industry Revenue (Million), by Country 2024 & 2032
- Figure 7: Asia Pacific Specialty Food Ingredients Industry Revenue Share (%), by Country 2024 & 2032
- Figure 8: South America Specialty Food Ingredients Industry Revenue (Million), by Country 2024 & 2032
- Figure 9: South America Specialty Food Ingredients Industry Revenue Share (%), by Country 2024 & 2032
- Figure 10: United Arab Emirates Specialty Food Ingredients Industry Revenue (Million), by Country 2024 & 2032
- Figure 11: United Arab Emirates Specialty Food Ingredients Industry Revenue Share (%), by Country 2024 & 2032
- Figure 12: North America Specialty Food Ingredients Industry Revenue (Million), by Product Type 2024 & 2032
- Figure 13: North America Specialty Food Ingredients Industry Revenue Share (%), by Product Type 2024 & 2032
- Figure 14: North America Specialty Food Ingredients Industry Revenue (Million), by Application 2024 & 2032
- Figure 15: North America Specialty Food Ingredients Industry Revenue Share (%), by Application 2024 & 2032
- Figure 16: North America Specialty Food Ingredients Industry Revenue (Million), by Country 2024 & 2032
- Figure 17: North America Specialty Food Ingredients Industry Revenue Share (%), by Country 2024 & 2032
- Figure 18: Europe Specialty Food Ingredients Industry Revenue (Million), by Product Type 2024 & 2032
- Figure 19: Europe Specialty Food Ingredients Industry Revenue Share (%), by Product Type 2024 & 2032
- Figure 20: Europe Specialty Food Ingredients Industry Revenue (Million), by Application 2024 & 2032
- Figure 21: Europe Specialty Food Ingredients Industry Revenue Share (%), by Application 2024 & 2032
- Figure 22: Europe Specialty Food Ingredients Industry Revenue (Million), by Country 2024 & 2032
- Figure 23: Europe Specialty Food Ingredients Industry Revenue Share (%), by Country 2024 & 2032
- Figure 24: Asia Pacific Specialty Food Ingredients Industry Revenue (Million), by Product Type 2024 & 2032
- Figure 25: Asia Pacific Specialty Food Ingredients Industry Revenue Share (%), by Product Type 2024 & 2032
- Figure 26: Asia Pacific Specialty Food Ingredients Industry Revenue (Million), by Application 2024 & 2032
- Figure 27: Asia Pacific Specialty Food Ingredients Industry Revenue Share (%), by Application 2024 & 2032
- Figure 28: Asia Pacific Specialty Food Ingredients Industry Revenue (Million), by Country 2024 & 2032
- Figure 29: Asia Pacific Specialty Food Ingredients Industry Revenue Share (%), by Country 2024 & 2032
- Figure 30: South America Specialty Food Ingredients Industry Revenue (Million), by Product Type 2024 & 2032
- Figure 31: South America Specialty Food Ingredients Industry Revenue Share (%), by Product Type 2024 & 2032
- Figure 32: South America Specialty Food Ingredients Industry Revenue (Million), by Application 2024 & 2032
- Figure 33: South America Specialty Food Ingredients Industry Revenue Share (%), by Application 2024 & 2032
- Figure 34: South America Specialty Food Ingredients Industry Revenue (Million), by Country 2024 & 2032
- Figure 35: South America Specialty Food Ingredients Industry Revenue Share (%), by Country 2024 & 2032
- Figure 36: Middle East Specialty Food Ingredients Industry Revenue (Million), by Product Type 2024 & 2032
- Figure 37: Middle East Specialty Food Ingredients Industry Revenue Share (%), by Product Type 2024 & 2032
- Figure 38: Middle East Specialty Food Ingredients Industry Revenue (Million), by Application 2024 & 2032
- Figure 39: Middle East Specialty Food Ingredients Industry Revenue Share (%), by Application 2024 & 2032
- Figure 40: Middle East Specialty Food Ingredients Industry Revenue (Million), by Country 2024 & 2032
- Figure 41: Middle East Specialty Food Ingredients Industry Revenue Share (%), by Country 2024 & 2032
- Figure 42: United Arab Emirates Specialty Food Ingredients Industry Revenue (Million), by Product Type 2024 & 2032
- Figure 43: United Arab Emirates Specialty Food Ingredients Industry Revenue Share (%), by Product Type 2024 & 2032
- Figure 44: United Arab Emirates Specialty Food Ingredients Industry Revenue (Million), by Application 2024 & 2032
- Figure 45: United Arab Emirates Specialty Food Ingredients Industry Revenue Share (%), by Application 2024 & 2032
- Figure 46: United Arab Emirates Specialty Food Ingredients Industry Revenue (Million), by Country 2024 & 2032
- Figure 47: United Arab Emirates Specialty Food Ingredients Industry Revenue Share (%), by Country 2024 & 2032
List of Tables
- Table 1: Global Specialty Food Ingredients Industry Revenue Million Forecast, by Region 2019 & 2032
- Table 2: Global Specialty Food Ingredients Industry Revenue Million Forecast, by Product Type 2019 & 2032
- Table 3: Global Specialty Food Ingredients Industry Revenue Million Forecast, by Application 2019 & 2032
- Table 4: Global Specialty Food Ingredients Industry Revenue Million Forecast, by Region 2019 & 2032
- Table 5: Global Specialty Food Ingredients Industry Revenue Million Forecast, by Country 2019 & 2032
- Table 6: United States Specialty Food Ingredients Industry Revenue (Million) Forecast, by Application 2019 & 2032
- Table 7: Canada Specialty Food Ingredients Industry Revenue (Million) Forecast, by Application 2019 & 2032
- Table 8: Mexico Specialty Food Ingredients Industry Revenue (Million) Forecast, by Application 2019 & 2032
- Table 9: Rest of North America Specialty Food Ingredients Industry Revenue (Million) Forecast, by Application 2019 & 2032
- Table 10: Global Specialty Food Ingredients Industry Revenue Million Forecast, by Country 2019 & 2032
- Table 11: Germany Specialty Food Ingredients Industry Revenue (Million) Forecast, by Application 2019 & 2032
- Table 12: United Kingdom Specialty Food Ingredients Industry Revenue (Million) Forecast, by Application 2019 & 2032
- Table 13: France Specialty Food Ingredients Industry Revenue (Million) Forecast, by Application 2019 & 2032
- Table 14: Spain Specialty Food Ingredients Industry Revenue (Million) Forecast, by Application 2019 & 2032
- Table 15: Italy Specialty Food Ingredients Industry Revenue (Million) Forecast, by Application 2019 & 2032
- Table 16: Russia Specialty Food Ingredients Industry Revenue (Million) Forecast, by Application 2019 & 2032
- Table 17: Rest of Europe Specialty Food Ingredients Industry Revenue (Million) Forecast, by Application 2019 & 2032
- Table 18: Global Specialty Food Ingredients Industry Revenue Million Forecast, by Country 2019 & 2032
- Table 19: China Specialty Food Ingredients Industry Revenue (Million) Forecast, by Application 2019 & 2032
- Table 20: India Specialty Food Ingredients Industry Revenue (Million) Forecast, by Application 2019 & 2032
- Table 21: Japan Specialty Food Ingredients Industry Revenue (Million) Forecast, by Application 2019 & 2032
- Table 22: Australia Specialty Food Ingredients Industry Revenue (Million) Forecast, by Application 2019 & 2032
- Table 23: Rest of Asia Pacific Specialty Food Ingredients Industry Revenue (Million) Forecast, by Application 2019 & 2032
- Table 24: Global Specialty Food Ingredients Industry Revenue Million Forecast, by Country 2019 & 2032
- Table 25: Brazil Specialty Food Ingredients Industry Revenue (Million) Forecast, by Application 2019 & 2032
- Table 26: Argentina Specialty Food Ingredients Industry Revenue (Million) Forecast, by Application 2019 & 2032
- Table 27: Rest of South America Specialty Food Ingredients Industry Revenue (Million) Forecast, by Application 2019 & 2032
- Table 28: Global Specialty Food Ingredients Industry Revenue Million Forecast, by Country 2019 & 2032
- Table 29: South Africa Specialty Food Ingredients Industry Revenue (Million) Forecast, by Application 2019 & 2032
- Table 30: Rest of Middle East Specialty Food Ingredients Industry Revenue (Million) Forecast, by Application 2019 & 2032
- Table 31: Global Specialty Food Ingredients Industry Revenue Million Forecast, by Product Type 2019 & 2032
- Table 32: Global Specialty Food Ingredients Industry Revenue Million Forecast, by Application 2019 & 2032
- Table 33: Global Specialty Food Ingredients Industry Revenue Million Forecast, by Country 2019 & 2032
- Table 34: United States Specialty Food Ingredients Industry Revenue (Million) Forecast, by Application 2019 & 2032
- Table 35: Canada Specialty Food Ingredients Industry Revenue (Million) Forecast, by Application 2019 & 2032
- Table 36: Mexico Specialty Food Ingredients Industry Revenue (Million) Forecast, by Application 2019 & 2032
- Table 37: Rest of North America Specialty Food Ingredients Industry Revenue (Million) Forecast, by Application 2019 & 2032
- Table 38: Global Specialty Food Ingredients Industry Revenue Million Forecast, by Product Type 2019 & 2032
- Table 39: Global Specialty Food Ingredients Industry Revenue Million Forecast, by Application 2019 & 2032
- Table 40: Global Specialty Food Ingredients Industry Revenue Million Forecast, by Country 2019 & 2032
- Table 41: Germany Specialty Food Ingredients Industry Revenue (Million) Forecast, by Application 2019 & 2032
- Table 42: United Kingdom Specialty Food Ingredients Industry Revenue (Million) Forecast, by Application 2019 & 2032
- Table 43: France Specialty Food Ingredients Industry Revenue (Million) Forecast, by Application 2019 & 2032
- Table 44: Spain Specialty Food Ingredients Industry Revenue (Million) Forecast, by Application 2019 & 2032
- Table 45: Italy Specialty Food Ingredients Industry Revenue (Million) Forecast, by Application 2019 & 2032
- Table 46: Russia Specialty Food Ingredients Industry Revenue (Million) Forecast, by Application 2019 & 2032
- Table 47: Rest of Europe Specialty Food Ingredients Industry Revenue (Million) Forecast, by Application 2019 & 2032
- Table 48: Global Specialty Food Ingredients Industry Revenue Million Forecast, by Product Type 2019 & 2032
- Table 49: Global Specialty Food Ingredients Industry Revenue Million Forecast, by Application 2019 & 2032
- Table 50: Global Specialty Food Ingredients Industry Revenue Million Forecast, by Country 2019 & 2032
- Table 51: China Specialty Food Ingredients Industry Revenue (Million) Forecast, by Application 2019 & 2032
- Table 52: India Specialty Food Ingredients Industry Revenue (Million) Forecast, by Application 2019 & 2032
- Table 53: Japan Specialty Food Ingredients Industry Revenue (Million) Forecast, by Application 2019 & 2032
- Table 54: Australia Specialty Food Ingredients Industry Revenue (Million) Forecast, by Application 2019 & 2032
- Table 55: Rest of Asia Pacific Specialty Food Ingredients Industry Revenue (Million) Forecast, by Application 2019 & 2032
- Table 56: Global Specialty Food Ingredients Industry Revenue Million Forecast, by Product Type 2019 & 2032
- Table 57: Global Specialty Food Ingredients Industry Revenue Million Forecast, by Application 2019 & 2032
- Table 58: Global Specialty Food Ingredients Industry Revenue Million Forecast, by Country 2019 & 2032
- Table 59: Brazil Specialty Food Ingredients Industry Revenue (Million) Forecast, by Application 2019 & 2032
- Table 60: Argentina Specialty Food Ingredients Industry Revenue (Million) Forecast, by Application 2019 & 2032
- Table 61: Rest of South America Specialty Food Ingredients Industry Revenue (Million) Forecast, by Application 2019 & 2032
- Table 62: Global Specialty Food Ingredients Industry Revenue Million Forecast, by Product Type 2019 & 2032
- Table 63: Global Specialty Food Ingredients Industry Revenue Million Forecast, by Application 2019 & 2032
- Table 64: Global Specialty Food Ingredients Industry Revenue Million Forecast, by Country 2019 & 2032
- Table 65: Global Specialty Food Ingredients Industry Revenue Million Forecast, by Product Type 2019 & 2032
- Table 66: Global Specialty Food Ingredients Industry Revenue Million Forecast, by Application 2019 & 2032
- Table 67: Global Specialty Food Ingredients Industry Revenue Million Forecast, by Country 2019 & 2032
- Table 68: South Africa Specialty Food Ingredients Industry Revenue (Million) Forecast, by Application 2019 & 2032
- Table 69: Rest of Middle East Specialty Food Ingredients Industry Revenue (Million) Forecast, by Application 2019 & 2032
Frequently Asked Questions
1. What is the projected Compound Annual Growth Rate (CAGR) of the Specialty Food Ingredients Industry?
The projected CAGR is approximately 5.30%.
2. Which companies are prominent players in the Specialty Food Ingredients Industry?
Key companies in the market include Cargill Incorporated, Sensient Technologies, International Flavors & Fragrances Inc, Archer Daniels Midland Company, Tate & Lyle PLC, Kerry Group PLC, Koninklijke DSM NV, Axiom Foods Inc, Ingredion Incorporated, Novozymes A/S.
3. What are the main segments of the Specialty Food Ingredients Industry?
The market segments include Product Type, Application.
4. Can you provide details about the market size?
The market size is estimated to be USD 80.98 Million as of 2022.
5. What are some drivers contributing to market growth?
Wide Applications and Functionality; Demand For Gluten-Free Products.
6. What are the notable trends driving market growth?
Escalated Demand for Fortified Processed Food.
7. Are there any restraints impacting market growth?
Easy Availability of Economically Feasible Alternatives.
8. Can you provide examples of recent developments in the market?
Nov 2022: Tate & Lyle launched a new sweetener, Erytesse erythritol. It announced that through a strategic partnership distribution agreement with a leading supplier of erythritol, this addition would expand its ability to help customers deliver on consumer demand for healthier and sugar and calorie-reduced products.
9. What pricing options are available for accessing the report?
Pricing options include single-user, multi-user, and enterprise licenses priced at USD 4750, USD 5250, and USD 8750 respectively.
10. Is the market size provided in terms of value or volume?
The market size is provided in terms of value, measured in Million.
11. Are there any specific market keywords associated with the report?
Yes, the market keyword associated with the report is "Specialty Food Ingredients Industry," which aids in identifying and referencing the specific market segment covered.
12. How do I determine which pricing option suits my needs best?
The pricing options vary based on user requirements and access needs. Individual users may opt for single-user licenses, while businesses requiring broader access may choose multi-user or enterprise licenses for cost-effective access to the report.
13. Are there any additional resources or data provided in the Specialty Food Ingredients Industry report?
While the report offers comprehensive insights, it's advisable to review the specific contents or supplementary materials provided to ascertain if additional resources or data are available.
14. How can I stay updated on further developments or reports in the Specialty Food Ingredients Industry?
To stay informed about further developments, trends, and reports in the Specialty Food Ingredients Industry, consider subscribing to industry newsletters, following relevant companies and organizations, or regularly checking reputable industry news sources and publications.
Methodology
Step 1 - Identification of Relevant Samples Size from Population Database


Step 2 - Approaches for Defining Global Market Size (Value, Volume* & Price*)

Note*: In applicable scenarios
Step 3 - Data Sources
Primary Research
- Web Analytics
- Survey Reports
- Research Institute
- Latest Research Reports
- Opinion Leaders
Secondary Research
- Annual Reports
- White Paper
- Latest Press Release
- Industry Association
- Paid Database
- Investor Presentations

Step 4 - Data Triangulation
Involves using different sources of information in order to increase the validity of a study
These sources are likely to be stakeholders in a program - participants, other researchers, program staff, other community members, and so on.
Then we put all data in single framework & apply various statistical tools to find out the dynamic on the market.
During the analysis stage, feedback from the stakeholder groups would be compared to determine areas of agreement as well as areas of divergence


