
Key Insights
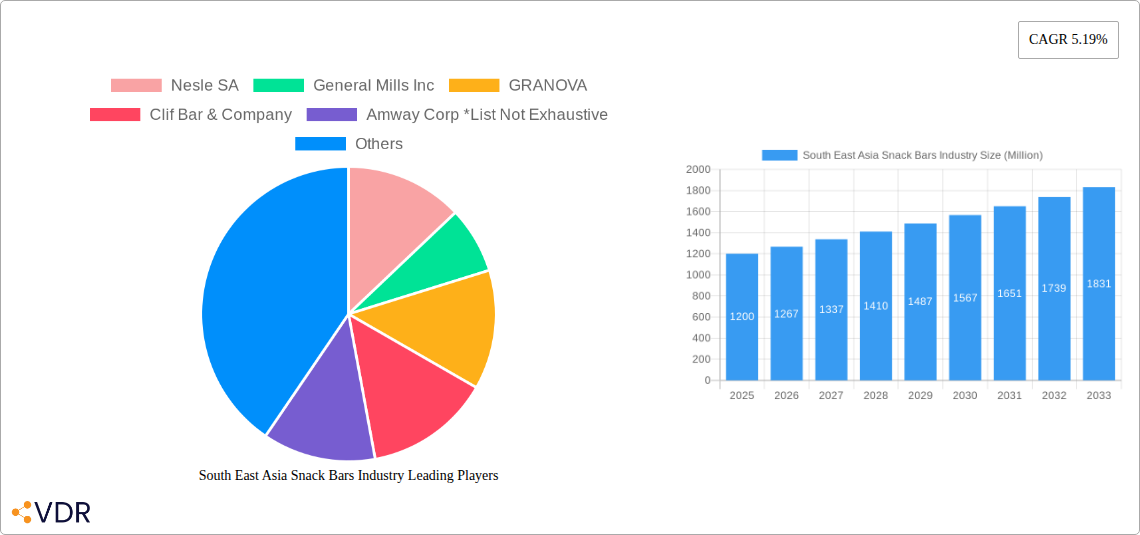
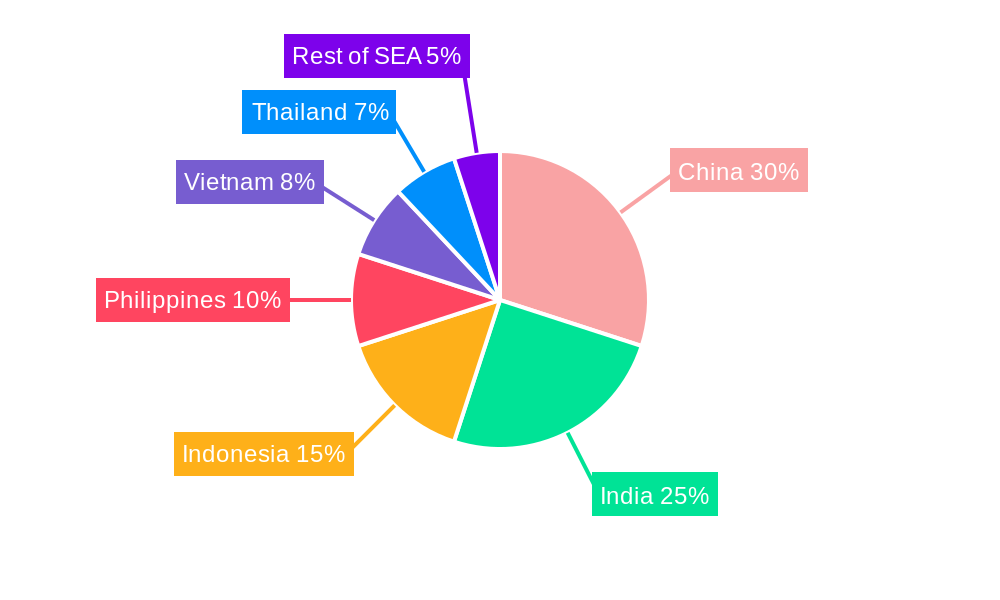
The Southeast Asia snack bar market, valued at approximately $1200 million in 2025, is projected to experience robust growth, driven by several key factors. The rising prevalence of health-conscious consumers seeking convenient and nutritious snack options fuels demand for cereal and energy bars. This trend is further amplified by increasing disposable incomes and urbanization across the region, particularly in rapidly developing economies like China, India, and Indonesia. The convenience offered by snack bars, especially for busy professionals and young adults, contributes significantly to market expansion. Furthermore, the growing popularity of online retail channels offers convenient access to a wider selection of brands and flavors, boosting sales. However, the market also faces challenges such as fluctuating raw material prices and intense competition among established brands and emerging local players. The increasing awareness of the sugar and processed ingredient content in many snack bars also presents a potential restraint, necessitating the development of healthier and more natural alternatives. The market segmentation, encompassing various distribution channels (hypermarkets/supermarkets dominating, followed by online and convenience stores) and product types (cereal and energy bars leading the way), allows for targeted marketing strategies and product development focusing on consumer preferences within specific demographics and channels. The competitive landscape includes both multinational giants like Nestle and General Mills and local brands tailoring their offerings to specific regional tastes and health trends.
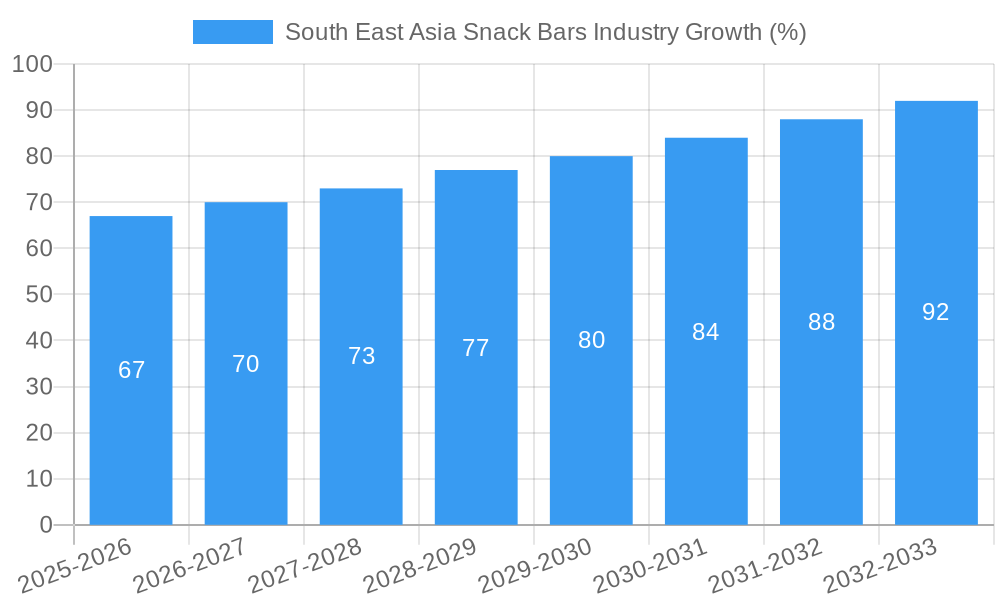
The forecast period (2025-2033) anticipates a compound annual growth rate (CAGR) of 5.19%, indicating a steady increase in market value. This growth will likely be uneven across different countries in Southeast Asia, with higher growth potential in countries experiencing rapid economic development and rising middle-class populations. The market's future hinges on the successful adaptation to changing consumer preferences, particularly regarding health and sustainability concerns. Brands focused on developing clean-label products, using organic and natural ingredients, and promoting transparency in their supply chains are likely to see higher success. Strategic partnerships and collaborations to increase market penetration, especially in less developed regions, will also be crucial for overall market expansion. Continued investment in research and development to improve product quality and enhance product innovation is vital for sustained growth within this competitive market.
South East Asia Snack Bars Industry: A Comprehensive Market Report (2019-2033)
This comprehensive report provides an in-depth analysis of the South East Asia snack bars industry, covering market dynamics, growth trends, key players, and future outlook. The study period spans from 2019 to 2033, with 2025 serving as the base and estimated year. This report is crucial for industry professionals, investors, and stakeholders seeking to understand and capitalize on the opportunities within this dynamic market. The report segments the market by distribution channel (hypermarket/supermarket, online stores, convenience stores, other) and product type (cereal bar, energy bar, other snack bars).
South East Asia Snack Bars Industry Market Dynamics & Structure
The South East Asia snack bar market is characterized by moderate concentration, with key players like Nestlé SA, General Mills Inc., and Kellogg Company holding significant market share, estimated at xx% collectively in 2025. However, the market also witnesses the presence of numerous smaller players and regional brands. Technological innovation, particularly in functional ingredients and sustainable packaging, is a key driver. Regulatory frameworks, especially those concerning sugar and fat content, significantly impact product formulations and marketing strategies. The market sees competition from other convenient food items like confectionery and packaged baked goods. Consumer demographics, specifically the growing health-conscious younger population and rising disposable incomes, fuel demand. M&A activity remains moderate, with an estimated xx deals in the past five years, primarily focused on expanding product portfolios and geographical reach.
- Market Concentration: Moderately concentrated, with top players holding xx% market share in 2025.
- Technological Innovation: Focus on functional ingredients, innovative flavors, and sustainable packaging.
- Regulatory Framework: Stringent regulations on sugar and fat content influencing product development.
- Competitive Substitutes: Confectionery, packaged baked goods, and other convenient snacks.
- End-User Demographics: Growing health-conscious younger population and rising disposable incomes drive demand.
- M&A Trends: Moderate activity, primarily for portfolio expansion and geographical reach.
South East Asia Snack Bars Industry Growth Trends & Insights
The South East Asia snack bars market experienced robust growth during the historical period (2019-2024), with a CAGR of xx%. This growth is projected to continue during the forecast period (2025-2033), albeit at a slightly moderated pace, with a projected CAGR of xx%. This growth is driven by factors such as rising disposable incomes, increasing health awareness (leading to demand for functional snack bars), and the expanding e-commerce sector facilitating easy access to a wider variety of products. Technological advancements in product formulation and packaging further enhance market appeal. Changing consumer preferences, including a growing preference for convenient and on-the-go food options, contribute to market expansion. Market penetration is estimated at xx% in 2025 and is expected to reach xx% by 2033.
Dominant Regions, Countries, or Segments in South East Asia Snack Bars Industry
Within South East Asia, Indonesia and the Philippines are currently leading the snack bar market, accounting for xx% and xx% of the total market value in 2025 respectively, driven by large populations and growing middle classes. The hypermarket/supermarket segment dominates distribution channels, holding a xx% market share due to established retail infrastructure and consumer familiarity. However, online stores are experiencing rapid growth, projected to achieve a CAGR of xx% during the forecast period, driven by increasing internet and smartphone penetration. The energy bar segment leads in product type, fueled by growing health and fitness consciousness.
- Key Drivers in Indonesia and Philippines: Large populations, rising middle class, and increasing health awareness.
- Hypermarket/Supermarket Dominance: Established retail infrastructure and consumer familiarity.
- Online Stores Growth: Rapid expansion driven by increasing internet and smartphone penetration.
- Energy Bar Segment Leadership: Growing health and fitness consciousness amongst consumers.
South East Asia Snack Bars Industry Product Landscape
The South East Asia snack bar market showcases a wide range of products, from traditional cereal bars to innovative energy bars packed with functional ingredients like protein, fiber, and vitamins. Manufacturers are constantly innovating with new flavors and formats to cater to evolving consumer preferences. Key selling propositions include health benefits, convenience, and portability. Technological advancements focus on improving nutritional value, extending shelf life, and enhancing taste and texture.
Key Drivers, Barriers & Challenges in South East Asia Snack Bars Industry
Key Drivers: Rising disposable incomes, growing health consciousness, increasing urbanization, and the expansion of e-commerce channels are key drivers propelling the South East Asia snack bar market. Government initiatives promoting healthy eating habits also contribute positively.
Key Challenges: Intense competition, fluctuating raw material prices, stringent regulations on sugar and fat content, and the need to balance affordability with premium ingredients pose significant challenges. Supply chain disruptions can also lead to production delays and increased costs.
Emerging Opportunities in South East Asia Snack Bars Industry
Untapped potential exists in smaller South East Asian markets with burgeoning middle classes. Opportunities abound in developing innovative products catering to specific dietary needs (vegan, gluten-free) and preferences (unique flavors, functional ingredients). Expanding distribution networks into rural areas and leveraging e-commerce platforms to reach wider audiences present significant opportunities for growth.
Growth Accelerators in the South East Asia Snack Bars Industry
Strategic partnerships and collaborations between established players and local brands will accelerate market growth. Technological breakthroughs in sustainable packaging and healthier ingredients will attract health-conscious consumers. Aggressive market expansion strategies focusing on untapped markets will further fuel the industry's growth.
Key Players Shaping the South East Asia Snack Bars Industry Market
- Nestlé SA
- General Mills Inc.
- GRANOVA
- Clif Bar & Company
- Amway Corp
- KIND LLC
- The Hut.com Limited (Myprotein)
- Kellogg Company
- General Nutrition Centers Inc
- PRISTINE (Yogood)
Notable Milestones in South East Asia Snack Bars Industry Sector
- 2020: Nestlé launches a new range of protein bars in Indonesia.
- 2021: Government of Thailand introduces stricter regulations on sugar content in processed foods.
- 2022: General Mills acquires a local snack bar company in the Philippines.
- 2023: Several key players introduce sustainable packaging for their snack bars.
- 2024: A significant increase in the number of new snack bar product launches with functional ingredients.
In-Depth South East Asia Snack Bars Industry Market Outlook
The South East Asia snack bar market is poised for sustained growth, driven by a confluence of factors including rising disposable incomes, evolving consumer preferences, and technological advancements. Strategic investments in product innovation, sustainable practices, and targeted marketing will be crucial for success in this dynamic and competitive market. The continued expansion of e-commerce and the penetration into rural markets will present significant opportunities for market expansion.
South East Asia Snack Bars Industry Segmentation
-
1. Product Type
-
1.1. Cereal Bar
- 1.1.1. Granola/Muesli Bars
- 1.1.2. Other Cereal Bars
- 1.2. Energy Bar
- 1.3. Other Snack Bars
-
1.1. Cereal Bar
-
2. Distribution Channel
- 2.1. Hypermarket/Supermarket
- 2.2. Online Stores
- 2.3. Convenience Stores
- 2.4. Other Distribution Channels
-
3. Countires
- 3.1. Indonesia
- 3.2. Malaysia
- 3.3. Myanmar
- 3.4. Philippines
- 3.5. Singapore
- 3.6. Thailand
- 3.7. Vietnam
- 3.8. Rest of South East Asia
South East Asia Snack Bars Industry Segmentation By Geography
-
1. South East Asia
- 1.1. Indonesia
- 1.2. Malaysia
- 1.3. Singapore
- 1.4. Thailand
- 1.5. Vietnam
- 1.6. Philippines
- 1.7. Myanmar
- 1.8. Cambodia
- 1.9. Laos
South East Asia Snack Bars Industry REPORT HIGHLIGHTS
| Aspects | Details |
|---|---|
| Study Period | 2019-2033 |
| Base Year | 2024 |
| Estimated Year | 2025 |
| Forecast Period | 2025-2033 |
| Historical Period | 2019-2024 |
| Growth Rate | CAGR of 5.19% from 2019-2033 |
| Segmentation |
|
Table of Contents
- 1. Introduction
- 1.1. Research Scope
- 1.2. Market Segmentation
- 1.3. Research Methodology
- 1.4. Definitions and Assumptions
- 2. Executive Summary
- 2.1. Introduction
- 3. Market Dynamics
- 3.1. Introduction
- 3.2. Market Drivers
- 3.2.1. Increasing application of Gelatin in healthcare and pharmaceutical sector
- 3.3. Market Restrains
- 3.3.1. Rising demand for clean label products
- 3.4. Market Trends
- 3.4.1. Propensity to Consume Convenient and Healthy On-the-go Meal and Snack Options
- 4. Market Factor Analysis
- 4.1. Porters Five Forces
- 4.2. Supply/Value Chain
- 4.3. PESTEL analysis
- 4.4. Market Entropy
- 4.5. Patent/Trademark Analysis
- 5. South East Asia Snack Bars Industry Analysis, Insights and Forecast, 2019-2031
- 5.1. Market Analysis, Insights and Forecast - by Product Type
- 5.1.1. Cereal Bar
- 5.1.1.1. Granola/Muesli Bars
- 5.1.1.2. Other Cereal Bars
- 5.1.2. Energy Bar
- 5.1.3. Other Snack Bars
- 5.1.1. Cereal Bar
- 5.2. Market Analysis, Insights and Forecast - by Distribution Channel
- 5.2.1. Hypermarket/Supermarket
- 5.2.2. Online Stores
- 5.2.3. Convenience Stores
- 5.2.4. Other Distribution Channels
- 5.3. Market Analysis, Insights and Forecast - by Countires
- 5.3.1. Indonesia
- 5.3.2. Malaysia
- 5.3.3. Myanmar
- 5.3.4. Philippines
- 5.3.5. Singapore
- 5.3.6. Thailand
- 5.3.7. Vietnam
- 5.3.8. Rest of South East Asia
- 5.4. Market Analysis, Insights and Forecast - by Region
- 5.4.1. South East Asia
- 5.1. Market Analysis, Insights and Forecast - by Product Type
- 6. China South East Asia Snack Bars Industry Analysis, Insights and Forecast, 2019-2031
- 7. Japan South East Asia Snack Bars Industry Analysis, Insights and Forecast, 2019-2031
- 8. India South East Asia Snack Bars Industry Analysis, Insights and Forecast, 2019-2031
- 9. South Korea South East Asia Snack Bars Industry Analysis, Insights and Forecast, 2019-2031
- 10. Taiwan South East Asia Snack Bars Industry Analysis, Insights and Forecast, 2019-2031
- 11. Australia South East Asia Snack Bars Industry Analysis, Insights and Forecast, 2019-2031
- 12. Rest of Asia-Pacific South East Asia Snack Bars Industry Analysis, Insights and Forecast, 2019-2031
- 13. Competitive Analysis
- 13.1. Market Share Analysis 2024
- 13.2. Company Profiles
- 13.2.1 Nesle SA
- 13.2.1.1. Overview
- 13.2.1.2. Products
- 13.2.1.3. SWOT Analysis
- 13.2.1.4. Recent Developments
- 13.2.1.5. Financials (Based on Availability)
- 13.2.2 General Mills Inc
- 13.2.2.1. Overview
- 13.2.2.2. Products
- 13.2.2.3. SWOT Analysis
- 13.2.2.4. Recent Developments
- 13.2.2.5. Financials (Based on Availability)
- 13.2.3 GRANOVA
- 13.2.3.1. Overview
- 13.2.3.2. Products
- 13.2.3.3. SWOT Analysis
- 13.2.3.4. Recent Developments
- 13.2.3.5. Financials (Based on Availability)
- 13.2.4 Clif Bar & Company
- 13.2.4.1. Overview
- 13.2.4.2. Products
- 13.2.4.3. SWOT Analysis
- 13.2.4.4. Recent Developments
- 13.2.4.5. Financials (Based on Availability)
- 13.2.5 Amway Corp *List Not Exhaustive
- 13.2.5.1. Overview
- 13.2.5.2. Products
- 13.2.5.3. SWOT Analysis
- 13.2.5.4. Recent Developments
- 13.2.5.5. Financials (Based on Availability)
- 13.2.6 KIND LLC
- 13.2.6.1. Overview
- 13.2.6.2. Products
- 13.2.6.3. SWOT Analysis
- 13.2.6.4. Recent Developments
- 13.2.6.5. Financials (Based on Availability)
- 13.2.7 The Hut com Limited (Myprotein)
- 13.2.7.1. Overview
- 13.2.7.2. Products
- 13.2.7.3. SWOT Analysis
- 13.2.7.4. Recent Developments
- 13.2.7.5. Financials (Based on Availability)
- 13.2.8 Kellogg Company
- 13.2.8.1. Overview
- 13.2.8.2. Products
- 13.2.8.3. SWOT Analysis
- 13.2.8.4. Recent Developments
- 13.2.8.5. Financials (Based on Availability)
- 13.2.9 General Nutrition Centers Inc
- 13.2.9.1. Overview
- 13.2.9.2. Products
- 13.2.9.3. SWOT Analysis
- 13.2.9.4. Recent Developments
- 13.2.9.5. Financials (Based on Availability)
- 13.2.10 PRISTINE (Yogood)
- 13.2.10.1. Overview
- 13.2.10.2. Products
- 13.2.10.3. SWOT Analysis
- 13.2.10.4. Recent Developments
- 13.2.10.5. Financials (Based on Availability)
- 13.2.1 Nesle SA
List of Figures
- Figure 1: South East Asia Snack Bars Industry Revenue Breakdown (Million, %) by Product 2024 & 2032
- Figure 2: South East Asia Snack Bars Industry Share (%) by Company 2024
List of Tables
- Table 1: South East Asia Snack Bars Industry Revenue Million Forecast, by Region 2019 & 2032
- Table 2: South East Asia Snack Bars Industry Volume K Tons Forecast, by Region 2019 & 2032
- Table 3: South East Asia Snack Bars Industry Revenue Million Forecast, by Product Type 2019 & 2032
- Table 4: South East Asia Snack Bars Industry Volume K Tons Forecast, by Product Type 2019 & 2032
- Table 5: South East Asia Snack Bars Industry Revenue Million Forecast, by Distribution Channel 2019 & 2032
- Table 6: South East Asia Snack Bars Industry Volume K Tons Forecast, by Distribution Channel 2019 & 2032
- Table 7: South East Asia Snack Bars Industry Revenue Million Forecast, by Countires 2019 & 2032
- Table 8: South East Asia Snack Bars Industry Volume K Tons Forecast, by Countires 2019 & 2032
- Table 9: South East Asia Snack Bars Industry Revenue Million Forecast, by Region 2019 & 2032
- Table 10: South East Asia Snack Bars Industry Volume K Tons Forecast, by Region 2019 & 2032
- Table 11: South East Asia Snack Bars Industry Revenue Million Forecast, by Country 2019 & 2032
- Table 12: South East Asia Snack Bars Industry Volume K Tons Forecast, by Country 2019 & 2032
- Table 13: China South East Asia Snack Bars Industry Revenue (Million) Forecast, by Application 2019 & 2032
- Table 14: China South East Asia Snack Bars Industry Volume (K Tons) Forecast, by Application 2019 & 2032
- Table 15: Japan South East Asia Snack Bars Industry Revenue (Million) Forecast, by Application 2019 & 2032
- Table 16: Japan South East Asia Snack Bars Industry Volume (K Tons) Forecast, by Application 2019 & 2032
- Table 17: India South East Asia Snack Bars Industry Revenue (Million) Forecast, by Application 2019 & 2032
- Table 18: India South East Asia Snack Bars Industry Volume (K Tons) Forecast, by Application 2019 & 2032
- Table 19: South Korea South East Asia Snack Bars Industry Revenue (Million) Forecast, by Application 2019 & 2032
- Table 20: South Korea South East Asia Snack Bars Industry Volume (K Tons) Forecast, by Application 2019 & 2032
- Table 21: Taiwan South East Asia Snack Bars Industry Revenue (Million) Forecast, by Application 2019 & 2032
- Table 22: Taiwan South East Asia Snack Bars Industry Volume (K Tons) Forecast, by Application 2019 & 2032
- Table 23: Australia South East Asia Snack Bars Industry Revenue (Million) Forecast, by Application 2019 & 2032
- Table 24: Australia South East Asia Snack Bars Industry Volume (K Tons) Forecast, by Application 2019 & 2032
- Table 25: Rest of Asia-Pacific South East Asia Snack Bars Industry Revenue (Million) Forecast, by Application 2019 & 2032
- Table 26: Rest of Asia-Pacific South East Asia Snack Bars Industry Volume (K Tons) Forecast, by Application 2019 & 2032
- Table 27: South East Asia Snack Bars Industry Revenue Million Forecast, by Product Type 2019 & 2032
- Table 28: South East Asia Snack Bars Industry Volume K Tons Forecast, by Product Type 2019 & 2032
- Table 29: South East Asia Snack Bars Industry Revenue Million Forecast, by Distribution Channel 2019 & 2032
- Table 30: South East Asia Snack Bars Industry Volume K Tons Forecast, by Distribution Channel 2019 & 2032
- Table 31: South East Asia Snack Bars Industry Revenue Million Forecast, by Countires 2019 & 2032
- Table 32: South East Asia Snack Bars Industry Volume K Tons Forecast, by Countires 2019 & 2032
- Table 33: South East Asia Snack Bars Industry Revenue Million Forecast, by Country 2019 & 2032
- Table 34: South East Asia Snack Bars Industry Volume K Tons Forecast, by Country 2019 & 2032
- Table 35: Indonesia South East Asia Snack Bars Industry Revenue (Million) Forecast, by Application 2019 & 2032
- Table 36: Indonesia South East Asia Snack Bars Industry Volume (K Tons) Forecast, by Application 2019 & 2032
- Table 37: Malaysia South East Asia Snack Bars Industry Revenue (Million) Forecast, by Application 2019 & 2032
- Table 38: Malaysia South East Asia Snack Bars Industry Volume (K Tons) Forecast, by Application 2019 & 2032
- Table 39: Singapore South East Asia Snack Bars Industry Revenue (Million) Forecast, by Application 2019 & 2032
- Table 40: Singapore South East Asia Snack Bars Industry Volume (K Tons) Forecast, by Application 2019 & 2032
- Table 41: Thailand South East Asia Snack Bars Industry Revenue (Million) Forecast, by Application 2019 & 2032
- Table 42: Thailand South East Asia Snack Bars Industry Volume (K Tons) Forecast, by Application 2019 & 2032
- Table 43: Vietnam South East Asia Snack Bars Industry Revenue (Million) Forecast, by Application 2019 & 2032
- Table 44: Vietnam South East Asia Snack Bars Industry Volume (K Tons) Forecast, by Application 2019 & 2032
- Table 45: Philippines South East Asia Snack Bars Industry Revenue (Million) Forecast, by Application 2019 & 2032
- Table 46: Philippines South East Asia Snack Bars Industry Volume (K Tons) Forecast, by Application 2019 & 2032
- Table 47: Myanmar South East Asia Snack Bars Industry Revenue (Million) Forecast, by Application 2019 & 2032
- Table 48: Myanmar South East Asia Snack Bars Industry Volume (K Tons) Forecast, by Application 2019 & 2032
- Table 49: Cambodia South East Asia Snack Bars Industry Revenue (Million) Forecast, by Application 2019 & 2032
- Table 50: Cambodia South East Asia Snack Bars Industry Volume (K Tons) Forecast, by Application 2019 & 2032
- Table 51: Laos South East Asia Snack Bars Industry Revenue (Million) Forecast, by Application 2019 & 2032
- Table 52: Laos South East Asia Snack Bars Industry Volume (K Tons) Forecast, by Application 2019 & 2032
Frequently Asked Questions
1. What is the projected Compound Annual Growth Rate (CAGR) of the South East Asia Snack Bars Industry?
The projected CAGR is approximately 5.19%.
2. Which companies are prominent players in the South East Asia Snack Bars Industry?
Key companies in the market include Nesle SA, General Mills Inc, GRANOVA, Clif Bar & Company, Amway Corp *List Not Exhaustive, KIND LLC, The Hut com Limited (Myprotein), Kellogg Company, General Nutrition Centers Inc, PRISTINE (Yogood).
3. What are the main segments of the South East Asia Snack Bars Industry?
The market segments include Product Type, Distribution Channel, Countires.
4. Can you provide details about the market size?
The market size is estimated to be USD 1200 Million as of 2022.
5. What are some drivers contributing to market growth?
Increasing application of Gelatin in healthcare and pharmaceutical sector.
6. What are the notable trends driving market growth?
Propensity to Consume Convenient and Healthy On-the-go Meal and Snack Options.
7. Are there any restraints impacting market growth?
Rising demand for clean label products.
8. Can you provide examples of recent developments in the market?
New product launches with functional ingredients and innovative flavors
9. What pricing options are available for accessing the report?
Pricing options include single-user, multi-user, and enterprise licenses priced at USD 4750, USD 4950, and USD 6800 respectively.
10. Is the market size provided in terms of value or volume?
The market size is provided in terms of value, measured in Million and volume, measured in K Tons.
11. Are there any specific market keywords associated with the report?
Yes, the market keyword associated with the report is "South East Asia Snack Bars Industry," which aids in identifying and referencing the specific market segment covered.
12. How do I determine which pricing option suits my needs best?
The pricing options vary based on user requirements and access needs. Individual users may opt for single-user licenses, while businesses requiring broader access may choose multi-user or enterprise licenses for cost-effective access to the report.
13. Are there any additional resources or data provided in the South East Asia Snack Bars Industry report?
While the report offers comprehensive insights, it's advisable to review the specific contents or supplementary materials provided to ascertain if additional resources or data are available.
14. How can I stay updated on further developments or reports in the South East Asia Snack Bars Industry?
To stay informed about further developments, trends, and reports in the South East Asia Snack Bars Industry, consider subscribing to industry newsletters, following relevant companies and organizations, or regularly checking reputable industry news sources and publications.
Methodology
Step 1 - Identification of Relevant Samples Size from Population Database


Step 2 - Approaches for Defining Global Market Size (Value, Volume* & Price*)

Note*: In applicable scenarios
Step 3 - Data Sources
Primary Research
- Web Analytics
- Survey Reports
- Research Institute
- Latest Research Reports
- Opinion Leaders
Secondary Research
- Annual Reports
- White Paper
- Latest Press Release
- Industry Association
- Paid Database
- Investor Presentations

Step 4 - Data Triangulation
Involves using different sources of information in order to increase the validity of a study
These sources are likely to be stakeholders in a program - participants, other researchers, program staff, other community members, and so on.
Then we put all data in single framework & apply various statistical tools to find out the dynamic on the market.
During the analysis stage, feedback from the stakeholder groups would be compared to determine areas of agreement as well as areas of divergence


