
Key Insights
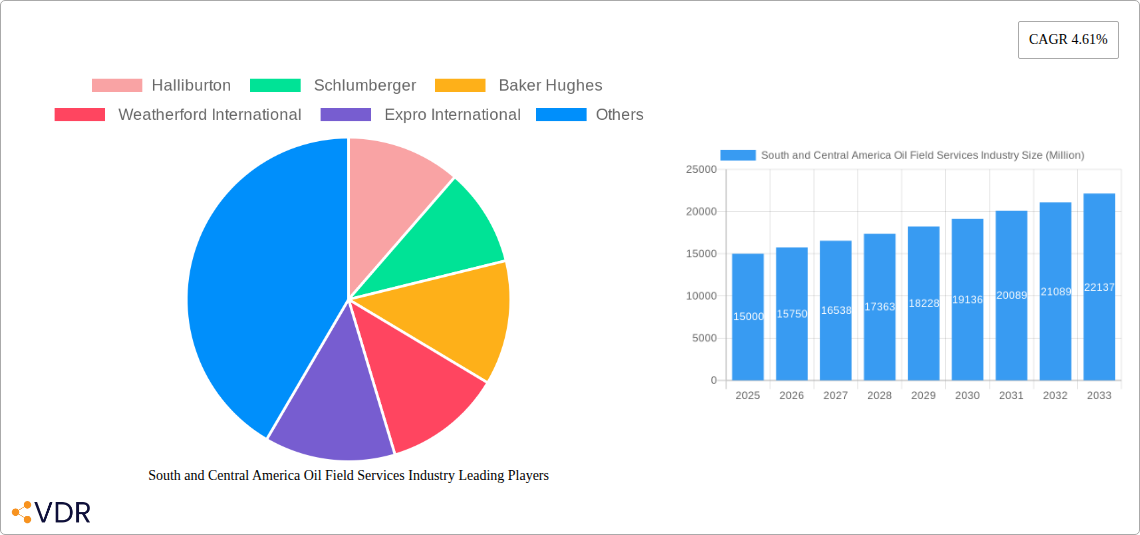
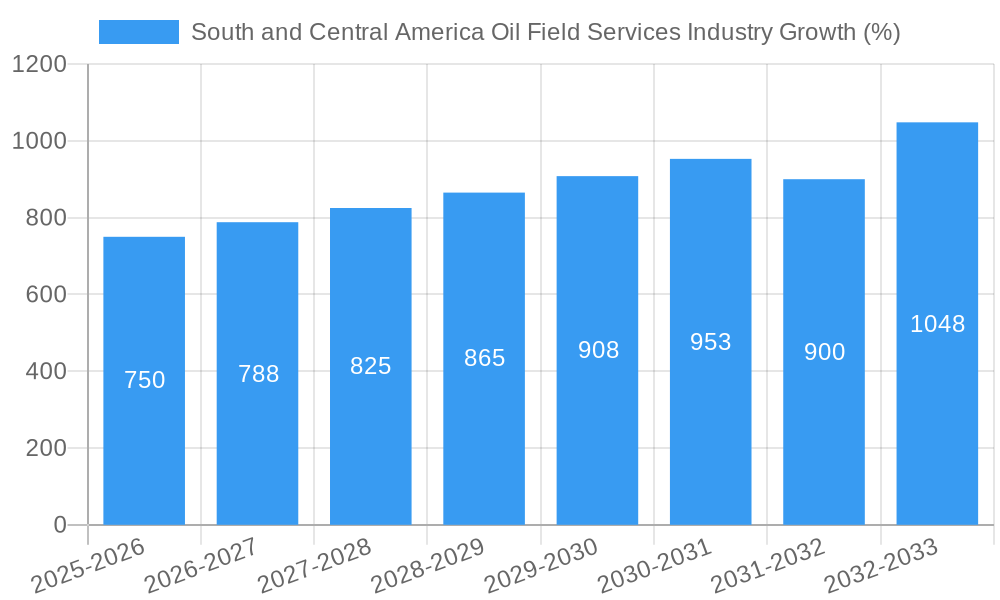
The South and Central American oil field services market, while smaller than North America or Europe, presents a compelling growth opportunity. Driven by ongoing exploration and production activities, particularly in Brazil, Argentina, and Colombia, the market is projected to experience steady expansion over the forecast period (2025-2033). While the overall global CAGR is 4.61%, the South and Central American region is likely to experience a slightly higher rate, potentially reaching 5.0-5.5% due to significant investments in both conventional and unconventional resources. This growth is fueled by increasing demand for enhanced oil recovery techniques and the exploration of deepwater reserves. However, the market faces challenges including geopolitical instability in certain regions, regulatory hurdles, and fluctuations in oil prices. The segment breakdown reveals a dominance of conventional oil field services, with solar, wind, and hydro power contributions likely remaining relatively small in the near term. Major international players like Halliburton, Schlumberger, and Baker Hughes are active in the region, competing with a smaller number of regional service providers. Brazil's robust oil and gas sector will continue to be a significant driver of market expansion, while Argentina and Colombia are expected to witness increased activity, particularly in shale gas development. Furthermore, infrastructure development and government initiatives promoting energy independence will further stimulate market growth.
Despite the positive outlook, significant challenges persist. Political and economic instability in some South American countries creates uncertainty for investment and operations. The region's infrastructure limitations can also hinder effective service delivery and increase operational costs. The fluctuating global price of oil remains a major external factor that can significantly impact spending on oil field services. The competition is intensifying as major players compete for market share, requiring providers to constantly innovate and improve operational efficiency. To succeed in this dynamic market, companies need a strong understanding of the regional landscape, including the diverse regulatory environments and local market dynamics.
South and Central America Oil Field Services Industry Report: 2019-2033
This comprehensive report provides an in-depth analysis of the South and Central America oil field services market, offering invaluable insights for industry professionals, investors, and strategic decision-makers. The study covers the period from 2019 to 2033, with a focus on the base year 2025 and a forecast period from 2025 to 2033. Key players like Halliburton, Schlumberger, Baker Hughes, Weatherford International, and Expro International are analyzed, along with market segmentation by service type (Solar, Wind, Hydro, Other Types).
South and Central America Oil Field Services Industry Market Dynamics & Structure
This section analyzes the market's competitive landscape, technological advancements, regulatory environment, and overall structure. We explore market concentration, identifying leading players and their market share percentages. The impact of mergers and acquisitions (M&A) activities, totaling xx Million USD in the historical period (2019-2024), is assessed, along with their influence on market consolidation and innovation. Furthermore, we examine the role of technological innovation, regulatory frameworks (including environmental regulations and safety standards), and the presence of substitute products and services. End-user demographics are also considered, focusing on the distribution of oil and gas exploration and production activities across different countries in the region.
- Market Concentration: xx% held by top 5 players in 2024.
- M&A Activity (2019-2024): xx deals, totaling xx Million USD.
- Technological Innovation: Focus on automation, digitalization, and enhanced oil recovery (EOR) techniques.
- Regulatory Landscape: Analysis of environmental regulations and their impact on operational costs.
- Competitive Substitutes: Evaluation of alternative service providers and technologies.
South and Central America Oil Field Services Industry Growth Trends & Insights
This section presents a detailed analysis of the market's growth trajectory, leveraging extensive data and research. We examine historical market size evolution from 2019 to 2024, projecting growth to xx Million USD by 2033. The Compound Annual Growth Rate (CAGR) during the forecast period (2025-2033) is estimated at xx%. We explore factors influencing adoption rates of new technologies and services, analyze shifts in consumer behavior (i.e., demand from oil and gas companies), and assess the impact of technological disruptions on market dynamics. The influence of macroeconomic factors and government policies on market growth is also incorporated.
Dominant Regions, Countries, or Segments in South and Central America Oil Field Services Industry
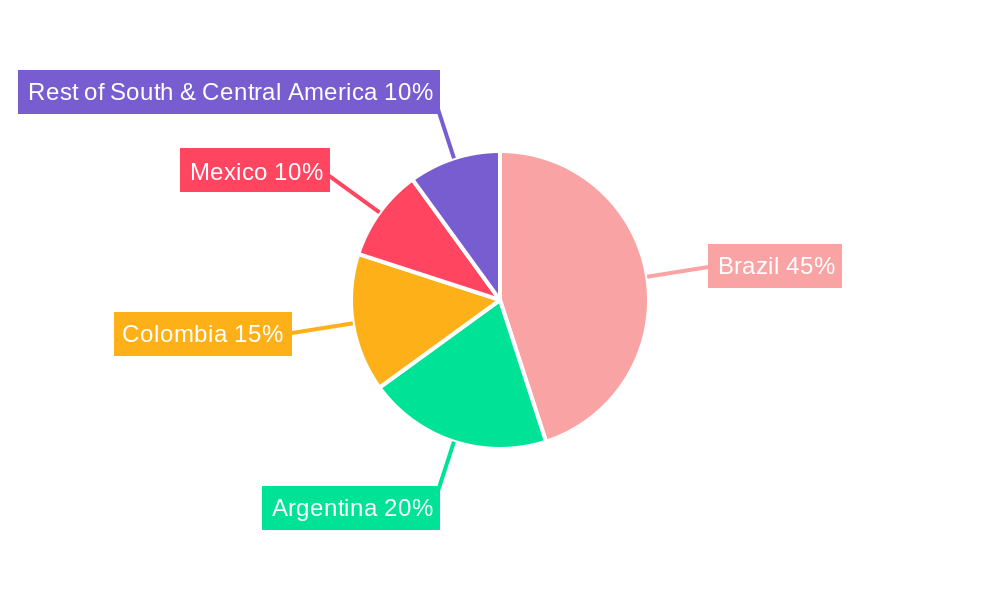
This section identifies the leading regions, countries, and segments within the South and Central America oil field services market driving overall growth. Brazil and Argentina are expected to be the dominant markets, contributing xx% and xx% of the total market value, respectively, in 2025. Analysis will focus on specific growth drivers such as robust oil and gas production activities, government investments in energy infrastructure, favorable economic policies, and supportive regulatory frameworks. The "Other Types" segment within the service type category is projected to experience significant growth due to increasing demand for specialized services and innovative solutions.
- Brazil: Strong oil and gas production, government investment in infrastructure.
- Argentina: Growing exploration and production activities, government support for the energy sector.
- Other Types Segment: Demand for specialized services and innovative technologies is driving growth.
South and Central America Oil Field Services Industry Product Landscape
The oil field services market showcases continuous innovation in equipment and technologies, driven by the need for enhanced efficiency, safety, and cost-effectiveness. This section highlights notable product innovations, focusing on their applications and performance metrics. Unique selling propositions and technological advancements are emphasized, along with an overview of the key product categories and their respective market shares.
Key Drivers, Barriers & Challenges in South and Central America Oil Field Services Industry
Key Drivers: The market is propelled by factors such as rising oil and gas production, government initiatives supporting energy infrastructure development, and the increasing adoption of advanced technologies to enhance efficiency and reduce operational costs. Specific examples include investments in offshore drilling and the growing demand for enhanced oil recovery techniques.
Key Barriers and Challenges: The industry faces challenges such as volatile oil prices, geopolitical instability in certain regions, regulatory hurdles related to environmental compliance and safety standards, and intense competition among service providers. Supply chain disruptions and skilled labor shortages also pose significant challenges to the market. These challenges could lead to potential cost overruns and project delays.
Emerging Opportunities in South and Central America Oil Field Services Industry
Emerging opportunities lie in untapped markets with growing energy demands, as well as the expansion of offshore drilling and the increasing adoption of digital technologies. There are also opportunities in specialized services, including well intervention and completion services.
Growth Accelerators in the South and Central America Oil Field Services Industry
Long-term growth is driven by technological breakthroughs, such as advancements in automation and data analytics, enabling enhanced efficiency and cost optimization. Strategic partnerships between service providers and oil and gas companies are also crucial for market expansion. Government support for energy infrastructure and initiatives aimed at promoting sustainable energy practices create further opportunities.
Key Players Shaping the South and Central America Oil Field Services Industry Market
Notable Milestones in South and Central America Oil Field Services Industry Sector
- November 2022: Petrobras awarded Diamond Offshore's Ocean Courage a four-year project (USD 429 Million) in Brazil, commencing in Q4 2023.
- February 2022: Archer awarded a two-year contract extension (USD 400 Million) for drilling services in Argentina, running until Q2 2025.
In-Depth South and Central America Oil Field Services Industry Market Outlook
The South and Central America oil field services market exhibits substantial growth potential driven by increasing oil and gas exploration and production activities. Strategic investments in infrastructure development, along with the adoption of advanced technologies, will further fuel market expansion. The market is poised for sustained growth, presenting significant opportunities for both established and emerging players.
South and Central America Oil Field Services Industry Segmentation
- 1. Production Analysis
- 2. Consumption Analysis
- 3. Import Market Analysis (Value & Volume)
- 4. Export Market Analysis (Value & Volume)
- 5. Price Trend Analysis
South and Central America Oil Field Services Industry Segmentation By Geography
- 1. Mexico
- 2. Brazil
- 3. Argentina
- 4. Rest of The South and Central America
South and Central America Oil Field Services Industry REPORT HIGHLIGHTS
| Aspects | Details |
|---|---|
| Study Period | 2019-2033 |
| Base Year | 2024 |
| Estimated Year | 2025 |
| Forecast Period | 2025-2033 |
| Historical Period | 2019-2024 |
| Growth Rate | CAGR of 4.61% from 2019-2033 |
| Segmentation |
|
Table of Contents
- 1. Introduction
- 1.1. Research Scope
- 1.2. Market Segmentation
- 1.3. Research Methodology
- 1.4. Definitions and Assumptions
- 2. Executive Summary
- 2.1. Introduction
- 3. Market Dynamics
- 3.1. Introduction
- 3.2. Market Drivers
- 3.2.1. 4.; Increasing Number of Offshore Operations 4.; Demand Coming for Unconventional Energy Sources
- 3.3. Market Restrains
- 3.3.1. 4.; Demand for Renewable Energy
- 3.4. Market Trends
- 3.4.1. Drilling Services Expected to dominate the market
- 4. Market Factor Analysis
- 4.1. Porters Five Forces
- 4.2. Supply/Value Chain
- 4.3. PESTEL analysis
- 4.4. Market Entropy
- 4.5. Patent/Trademark Analysis
- 5. Global South and Central America Oil Field Services Industry Analysis, Insights and Forecast, 2019-2031
- 5.1. Market Analysis, Insights and Forecast - by Production Analysis
- 5.2. Market Analysis, Insights and Forecast - by Consumption Analysis
- 5.3. Market Analysis, Insights and Forecast - by Import Market Analysis (Value & Volume)
- 5.4. Market Analysis, Insights and Forecast - by Export Market Analysis (Value & Volume)
- 5.5. Market Analysis, Insights and Forecast - by Price Trend Analysis
- 5.6. Market Analysis, Insights and Forecast - by Region
- 5.6.1. Mexico
- 5.6.2. Brazil
- 5.6.3. Argentina
- 5.6.4. Rest of The South and Central America
- 5.1. Market Analysis, Insights and Forecast - by Production Analysis
- 6. Mexico South and Central America Oil Field Services Industry Analysis, Insights and Forecast, 2019-2031
- 6.1. Market Analysis, Insights and Forecast - by Production Analysis
- 6.2. Market Analysis, Insights and Forecast - by Consumption Analysis
- 6.3. Market Analysis, Insights and Forecast - by Import Market Analysis (Value & Volume)
- 6.4. Market Analysis, Insights and Forecast - by Export Market Analysis (Value & Volume)
- 6.5. Market Analysis, Insights and Forecast - by Price Trend Analysis
- 6.1. Market Analysis, Insights and Forecast - by Production Analysis
- 7. Brazil South and Central America Oil Field Services Industry Analysis, Insights and Forecast, 2019-2031
- 7.1. Market Analysis, Insights and Forecast - by Production Analysis
- 7.2. Market Analysis, Insights and Forecast - by Consumption Analysis
- 7.3. Market Analysis, Insights and Forecast - by Import Market Analysis (Value & Volume)
- 7.4. Market Analysis, Insights and Forecast - by Export Market Analysis (Value & Volume)
- 7.5. Market Analysis, Insights and Forecast - by Price Trend Analysis
- 7.1. Market Analysis, Insights and Forecast - by Production Analysis
- 8. Argentina South and Central America Oil Field Services Industry Analysis, Insights and Forecast, 2019-2031
- 8.1. Market Analysis, Insights and Forecast - by Production Analysis
- 8.2. Market Analysis, Insights and Forecast - by Consumption Analysis
- 8.3. Market Analysis, Insights and Forecast - by Import Market Analysis (Value & Volume)
- 8.4. Market Analysis, Insights and Forecast - by Export Market Analysis (Value & Volume)
- 8.5. Market Analysis, Insights and Forecast - by Price Trend Analysis
- 8.1. Market Analysis, Insights and Forecast - by Production Analysis
- 9. Rest of The South and Central America South and Central America Oil Field Services Industry Analysis, Insights and Forecast, 2019-2031
- 9.1. Market Analysis, Insights and Forecast - by Production Analysis
- 9.2. Market Analysis, Insights and Forecast - by Consumption Analysis
- 9.3. Market Analysis, Insights and Forecast - by Import Market Analysis (Value & Volume)
- 9.4. Market Analysis, Insights and Forecast - by Export Market Analysis (Value & Volume)
- 9.5. Market Analysis, Insights and Forecast - by Price Trend Analysis
- 9.1. Market Analysis, Insights and Forecast - by Production Analysis
- 10. North America South and Central America Oil Field Services Industry Analysis, Insights and Forecast, 2019-2031
- 10.1. Market Analysis, Insights and Forecast - By Country/Sub-region
- 10.1.1 United States
- 10.1.2 Canada
- 10.1.3 Mexico
- 11. Europe South and Central America Oil Field Services Industry Analysis, Insights and Forecast, 2019-2031
- 11.1. Market Analysis, Insights and Forecast - By Country/Sub-region
- 11.1.1 Germany
- 11.1.2 United Kingdom
- 11.1.3 France
- 11.1.4 Spain
- 11.1.5 Italy
- 11.1.6 Spain
- 11.1.7 Belgium
- 11.1.8 Netherland
- 11.1.9 Nordics
- 11.1.10 Rest of Europe
- 12. Asia Pacific South and Central America Oil Field Services Industry Analysis, Insights and Forecast, 2019-2031
- 12.1. Market Analysis, Insights and Forecast - By Country/Sub-region
- 12.1.1 China
- 12.1.2 Japan
- 12.1.3 India
- 12.1.4 South Korea
- 12.1.5 Southeast Asia
- 12.1.6 Australia
- 12.1.7 Indonesia
- 12.1.8 Phillipes
- 12.1.9 Singapore
- 12.1.10 Thailandc
- 12.1.11 Rest of Asia Pacific
- 13. South America South and Central America Oil Field Services Industry Analysis, Insights and Forecast, 2019-2031
- 13.1. Market Analysis, Insights and Forecast - By Country/Sub-region
- 13.1.1 Brazil
- 13.1.2 Argentina
- 13.1.3 Peru
- 13.1.4 Chile
- 13.1.5 Colombia
- 13.1.6 Ecuador
- 13.1.7 Venezuela
- 13.1.8 Rest of South America
- 14. North America South and Central America Oil Field Services Industry Analysis, Insights and Forecast, 2019-2031
- 14.1. Market Analysis, Insights and Forecast - By Country/Sub-region
- 14.1.1 United States
- 14.1.2 Canada
- 14.1.3 Mexico
- 15. MEA South and Central America Oil Field Services Industry Analysis, Insights and Forecast, 2019-2031
- 15.1. Market Analysis, Insights and Forecast - By Country/Sub-region
- 15.1.1 United Arab Emirates
- 15.1.2 Saudi Arabia
- 15.1.3 South Africa
- 15.1.4 Rest of Middle East and Africa
- 16. Competitive Analysis
- 16.1. Global Market Share Analysis 2024
- 16.2. Company Profiles
- 16.2.1 Halliburton
- 16.2.1.1. Overview
- 16.2.1.2. Products
- 16.2.1.3. SWOT Analysis
- 16.2.1.4. Recent Developments
- 16.2.1.5. Financials (Based on Availability)
- 16.2.2 Schlumberger
- 16.2.2.1. Overview
- 16.2.2.2. Products
- 16.2.2.3. SWOT Analysis
- 16.2.2.4. Recent Developments
- 16.2.2.5. Financials (Based on Availability)
- 16.2.3 Baker Hughes
- 16.2.3.1. Overview
- 16.2.3.2. Products
- 16.2.3.3. SWOT Analysis
- 16.2.3.4. Recent Developments
- 16.2.3.5. Financials (Based on Availability)
- 16.2.4 Weatherford International
- 16.2.4.1. Overview
- 16.2.4.2. Products
- 16.2.4.3. SWOT Analysis
- 16.2.4.4. Recent Developments
- 16.2.4.5. Financials (Based on Availability)
- 16.2.5 Expro International
- 16.2.5.1. Overview
- 16.2.5.2. Products
- 16.2.5.3. SWOT Analysis
- 16.2.5.4. Recent Developments
- 16.2.5.5. Financials (Based on Availability)
- 16.2.1 Halliburton
List of Figures
- Figure 1: Global South and Central America Oil Field Services Industry Revenue Breakdown (Million, %) by Region 2024 & 2032
- Figure 2: North America South and Central America Oil Field Services Industry Revenue (Million), by Country 2024 & 2032
- Figure 3: North America South and Central America Oil Field Services Industry Revenue Share (%), by Country 2024 & 2032
- Figure 4: Europe South and Central America Oil Field Services Industry Revenue (Million), by Country 2024 & 2032
- Figure 5: Europe South and Central America Oil Field Services Industry Revenue Share (%), by Country 2024 & 2032
- Figure 6: Asia Pacific South and Central America Oil Field Services Industry Revenue (Million), by Country 2024 & 2032
- Figure 7: Asia Pacific South and Central America Oil Field Services Industry Revenue Share (%), by Country 2024 & 2032
- Figure 8: South America South and Central America Oil Field Services Industry Revenue (Million), by Country 2024 & 2032
- Figure 9: South America South and Central America Oil Field Services Industry Revenue Share (%), by Country 2024 & 2032
- Figure 10: North America South and Central America Oil Field Services Industry Revenue (Million), by Country 2024 & 2032
- Figure 11: North America South and Central America Oil Field Services Industry Revenue Share (%), by Country 2024 & 2032
- Figure 12: MEA South and Central America Oil Field Services Industry Revenue (Million), by Country 2024 & 2032
- Figure 13: MEA South and Central America Oil Field Services Industry Revenue Share (%), by Country 2024 & 2032
- Figure 14: Mexico South and Central America Oil Field Services Industry Revenue (Million), by Production Analysis 2024 & 2032
- Figure 15: Mexico South and Central America Oil Field Services Industry Revenue Share (%), by Production Analysis 2024 & 2032
- Figure 16: Mexico South and Central America Oil Field Services Industry Revenue (Million), by Consumption Analysis 2024 & 2032
- Figure 17: Mexico South and Central America Oil Field Services Industry Revenue Share (%), by Consumption Analysis 2024 & 2032
- Figure 18: Mexico South and Central America Oil Field Services Industry Revenue (Million), by Import Market Analysis (Value & Volume) 2024 & 2032
- Figure 19: Mexico South and Central America Oil Field Services Industry Revenue Share (%), by Import Market Analysis (Value & Volume) 2024 & 2032
- Figure 20: Mexico South and Central America Oil Field Services Industry Revenue (Million), by Export Market Analysis (Value & Volume) 2024 & 2032
- Figure 21: Mexico South and Central America Oil Field Services Industry Revenue Share (%), by Export Market Analysis (Value & Volume) 2024 & 2032
- Figure 22: Mexico South and Central America Oil Field Services Industry Revenue (Million), by Price Trend Analysis 2024 & 2032
- Figure 23: Mexico South and Central America Oil Field Services Industry Revenue Share (%), by Price Trend Analysis 2024 & 2032
- Figure 24: Mexico South and Central America Oil Field Services Industry Revenue (Million), by Country 2024 & 2032
- Figure 25: Mexico South and Central America Oil Field Services Industry Revenue Share (%), by Country 2024 & 2032
- Figure 26: Brazil South and Central America Oil Field Services Industry Revenue (Million), by Production Analysis 2024 & 2032
- Figure 27: Brazil South and Central America Oil Field Services Industry Revenue Share (%), by Production Analysis 2024 & 2032
- Figure 28: Brazil South and Central America Oil Field Services Industry Revenue (Million), by Consumption Analysis 2024 & 2032
- Figure 29: Brazil South and Central America Oil Field Services Industry Revenue Share (%), by Consumption Analysis 2024 & 2032
- Figure 30: Brazil South and Central America Oil Field Services Industry Revenue (Million), by Import Market Analysis (Value & Volume) 2024 & 2032
- Figure 31: Brazil South and Central America Oil Field Services Industry Revenue Share (%), by Import Market Analysis (Value & Volume) 2024 & 2032
- Figure 32: Brazil South and Central America Oil Field Services Industry Revenue (Million), by Export Market Analysis (Value & Volume) 2024 & 2032
- Figure 33: Brazil South and Central America Oil Field Services Industry Revenue Share (%), by Export Market Analysis (Value & Volume) 2024 & 2032
- Figure 34: Brazil South and Central America Oil Field Services Industry Revenue (Million), by Price Trend Analysis 2024 & 2032
- Figure 35: Brazil South and Central America Oil Field Services Industry Revenue Share (%), by Price Trend Analysis 2024 & 2032
- Figure 36: Brazil South and Central America Oil Field Services Industry Revenue (Million), by Country 2024 & 2032
- Figure 37: Brazil South and Central America Oil Field Services Industry Revenue Share (%), by Country 2024 & 2032
- Figure 38: Argentina South and Central America Oil Field Services Industry Revenue (Million), by Production Analysis 2024 & 2032
- Figure 39: Argentina South and Central America Oil Field Services Industry Revenue Share (%), by Production Analysis 2024 & 2032
- Figure 40: Argentina South and Central America Oil Field Services Industry Revenue (Million), by Consumption Analysis 2024 & 2032
- Figure 41: Argentina South and Central America Oil Field Services Industry Revenue Share (%), by Consumption Analysis 2024 & 2032
- Figure 42: Argentina South and Central America Oil Field Services Industry Revenue (Million), by Import Market Analysis (Value & Volume) 2024 & 2032
- Figure 43: Argentina South and Central America Oil Field Services Industry Revenue Share (%), by Import Market Analysis (Value & Volume) 2024 & 2032
- Figure 44: Argentina South and Central America Oil Field Services Industry Revenue (Million), by Export Market Analysis (Value & Volume) 2024 & 2032
- Figure 45: Argentina South and Central America Oil Field Services Industry Revenue Share (%), by Export Market Analysis (Value & Volume) 2024 & 2032
- Figure 46: Argentina South and Central America Oil Field Services Industry Revenue (Million), by Price Trend Analysis 2024 & 2032
- Figure 47: Argentina South and Central America Oil Field Services Industry Revenue Share (%), by Price Trend Analysis 2024 & 2032
- Figure 48: Argentina South and Central America Oil Field Services Industry Revenue (Million), by Country 2024 & 2032
- Figure 49: Argentina South and Central America Oil Field Services Industry Revenue Share (%), by Country 2024 & 2032
- Figure 50: Rest of The South and Central America South and Central America Oil Field Services Industry Revenue (Million), by Production Analysis 2024 & 2032
- Figure 51: Rest of The South and Central America South and Central America Oil Field Services Industry Revenue Share (%), by Production Analysis 2024 & 2032
- Figure 52: Rest of The South and Central America South and Central America Oil Field Services Industry Revenue (Million), by Consumption Analysis 2024 & 2032
- Figure 53: Rest of The South and Central America South and Central America Oil Field Services Industry Revenue Share (%), by Consumption Analysis 2024 & 2032
- Figure 54: Rest of The South and Central America South and Central America Oil Field Services Industry Revenue (Million), by Import Market Analysis (Value & Volume) 2024 & 2032
- Figure 55: Rest of The South and Central America South and Central America Oil Field Services Industry Revenue Share (%), by Import Market Analysis (Value & Volume) 2024 & 2032
- Figure 56: Rest of The South and Central America South and Central America Oil Field Services Industry Revenue (Million), by Export Market Analysis (Value & Volume) 2024 & 2032
- Figure 57: Rest of The South and Central America South and Central America Oil Field Services Industry Revenue Share (%), by Export Market Analysis (Value & Volume) 2024 & 2032
- Figure 58: Rest of The South and Central America South and Central America Oil Field Services Industry Revenue (Million), by Price Trend Analysis 2024 & 2032
- Figure 59: Rest of The South and Central America South and Central America Oil Field Services Industry Revenue Share (%), by Price Trend Analysis 2024 & 2032
- Figure 60: Rest of The South and Central America South and Central America Oil Field Services Industry Revenue (Million), by Country 2024 & 2032
- Figure 61: Rest of The South and Central America South and Central America Oil Field Services Industry Revenue Share (%), by Country 2024 & 2032
List of Tables
- Table 1: Global South and Central America Oil Field Services Industry Revenue Million Forecast, by Region 2019 & 2032
- Table 2: Global South and Central America Oil Field Services Industry Revenue Million Forecast, by Production Analysis 2019 & 2032
- Table 3: Global South and Central America Oil Field Services Industry Revenue Million Forecast, by Consumption Analysis 2019 & 2032
- Table 4: Global South and Central America Oil Field Services Industry Revenue Million Forecast, by Import Market Analysis (Value & Volume) 2019 & 2032
- Table 5: Global South and Central America Oil Field Services Industry Revenue Million Forecast, by Export Market Analysis (Value & Volume) 2019 & 2032
- Table 6: Global South and Central America Oil Field Services Industry Revenue Million Forecast, by Price Trend Analysis 2019 & 2032
- Table 7: Global South and Central America Oil Field Services Industry Revenue Million Forecast, by Region 2019 & 2032
- Table 8: Global South and Central America Oil Field Services Industry Revenue Million Forecast, by Country 2019 & 2032
- Table 9: United States South and Central America Oil Field Services Industry Revenue (Million) Forecast, by Application 2019 & 2032
- Table 10: Canada South and Central America Oil Field Services Industry Revenue (Million) Forecast, by Application 2019 & 2032
- Table 11: Mexico South and Central America Oil Field Services Industry Revenue (Million) Forecast, by Application 2019 & 2032
- Table 12: Global South and Central America Oil Field Services Industry Revenue Million Forecast, by Country 2019 & 2032
- Table 13: Germany South and Central America Oil Field Services Industry Revenue (Million) Forecast, by Application 2019 & 2032
- Table 14: United Kingdom South and Central America Oil Field Services Industry Revenue (Million) Forecast, by Application 2019 & 2032
- Table 15: France South and Central America Oil Field Services Industry Revenue (Million) Forecast, by Application 2019 & 2032
- Table 16: Spain South and Central America Oil Field Services Industry Revenue (Million) Forecast, by Application 2019 & 2032
- Table 17: Italy South and Central America Oil Field Services Industry Revenue (Million) Forecast, by Application 2019 & 2032
- Table 18: Spain South and Central America Oil Field Services Industry Revenue (Million) Forecast, by Application 2019 & 2032
- Table 19: Belgium South and Central America Oil Field Services Industry Revenue (Million) Forecast, by Application 2019 & 2032
- Table 20: Netherland South and Central America Oil Field Services Industry Revenue (Million) Forecast, by Application 2019 & 2032
- Table 21: Nordics South and Central America Oil Field Services Industry Revenue (Million) Forecast, by Application 2019 & 2032
- Table 22: Rest of Europe South and Central America Oil Field Services Industry Revenue (Million) Forecast, by Application 2019 & 2032
- Table 23: Global South and Central America Oil Field Services Industry Revenue Million Forecast, by Country 2019 & 2032
- Table 24: China South and Central America Oil Field Services Industry Revenue (Million) Forecast, by Application 2019 & 2032
- Table 25: Japan South and Central America Oil Field Services Industry Revenue (Million) Forecast, by Application 2019 & 2032
- Table 26: India South and Central America Oil Field Services Industry Revenue (Million) Forecast, by Application 2019 & 2032
- Table 27: South Korea South and Central America Oil Field Services Industry Revenue (Million) Forecast, by Application 2019 & 2032
- Table 28: Southeast Asia South and Central America Oil Field Services Industry Revenue (Million) Forecast, by Application 2019 & 2032
- Table 29: Australia South and Central America Oil Field Services Industry Revenue (Million) Forecast, by Application 2019 & 2032
- Table 30: Indonesia South and Central America Oil Field Services Industry Revenue (Million) Forecast, by Application 2019 & 2032
- Table 31: Phillipes South and Central America Oil Field Services Industry Revenue (Million) Forecast, by Application 2019 & 2032
- Table 32: Singapore South and Central America Oil Field Services Industry Revenue (Million) Forecast, by Application 2019 & 2032
- Table 33: Thailandc South and Central America Oil Field Services Industry Revenue (Million) Forecast, by Application 2019 & 2032
- Table 34: Rest of Asia Pacific South and Central America Oil Field Services Industry Revenue (Million) Forecast, by Application 2019 & 2032
- Table 35: Global South and Central America Oil Field Services Industry Revenue Million Forecast, by Country 2019 & 2032
- Table 36: Brazil South and Central America Oil Field Services Industry Revenue (Million) Forecast, by Application 2019 & 2032
- Table 37: Argentina South and Central America Oil Field Services Industry Revenue (Million) Forecast, by Application 2019 & 2032
- Table 38: Peru South and Central America Oil Field Services Industry Revenue (Million) Forecast, by Application 2019 & 2032
- Table 39: Chile South and Central America Oil Field Services Industry Revenue (Million) Forecast, by Application 2019 & 2032
- Table 40: Colombia South and Central America Oil Field Services Industry Revenue (Million) Forecast, by Application 2019 & 2032
- Table 41: Ecuador South and Central America Oil Field Services Industry Revenue (Million) Forecast, by Application 2019 & 2032
- Table 42: Venezuela South and Central America Oil Field Services Industry Revenue (Million) Forecast, by Application 2019 & 2032
- Table 43: Rest of South America South and Central America Oil Field Services Industry Revenue (Million) Forecast, by Application 2019 & 2032
- Table 44: Global South and Central America Oil Field Services Industry Revenue Million Forecast, by Country 2019 & 2032
- Table 45: United States South and Central America Oil Field Services Industry Revenue (Million) Forecast, by Application 2019 & 2032
- Table 46: Canada South and Central America Oil Field Services Industry Revenue (Million) Forecast, by Application 2019 & 2032
- Table 47: Mexico South and Central America Oil Field Services Industry Revenue (Million) Forecast, by Application 2019 & 2032
- Table 48: Global South and Central America Oil Field Services Industry Revenue Million Forecast, by Country 2019 & 2032
- Table 49: United Arab Emirates South and Central America Oil Field Services Industry Revenue (Million) Forecast, by Application 2019 & 2032
- Table 50: Saudi Arabia South and Central America Oil Field Services Industry Revenue (Million) Forecast, by Application 2019 & 2032
- Table 51: South Africa South and Central America Oil Field Services Industry Revenue (Million) Forecast, by Application 2019 & 2032
- Table 52: Rest of Middle East and Africa South and Central America Oil Field Services Industry Revenue (Million) Forecast, by Application 2019 & 2032
- Table 53: Global South and Central America Oil Field Services Industry Revenue Million Forecast, by Production Analysis 2019 & 2032
- Table 54: Global South and Central America Oil Field Services Industry Revenue Million Forecast, by Consumption Analysis 2019 & 2032
- Table 55: Global South and Central America Oil Field Services Industry Revenue Million Forecast, by Import Market Analysis (Value & Volume) 2019 & 2032
- Table 56: Global South and Central America Oil Field Services Industry Revenue Million Forecast, by Export Market Analysis (Value & Volume) 2019 & 2032
- Table 57: Global South and Central America Oil Field Services Industry Revenue Million Forecast, by Price Trend Analysis 2019 & 2032
- Table 58: Global South and Central America Oil Field Services Industry Revenue Million Forecast, by Country 2019 & 2032
- Table 59: Global South and Central America Oil Field Services Industry Revenue Million Forecast, by Production Analysis 2019 & 2032
- Table 60: Global South and Central America Oil Field Services Industry Revenue Million Forecast, by Consumption Analysis 2019 & 2032
- Table 61: Global South and Central America Oil Field Services Industry Revenue Million Forecast, by Import Market Analysis (Value & Volume) 2019 & 2032
- Table 62: Global South and Central America Oil Field Services Industry Revenue Million Forecast, by Export Market Analysis (Value & Volume) 2019 & 2032
- Table 63: Global South and Central America Oil Field Services Industry Revenue Million Forecast, by Price Trend Analysis 2019 & 2032
- Table 64: Global South and Central America Oil Field Services Industry Revenue Million Forecast, by Country 2019 & 2032
- Table 65: Global South and Central America Oil Field Services Industry Revenue Million Forecast, by Production Analysis 2019 & 2032
- Table 66: Global South and Central America Oil Field Services Industry Revenue Million Forecast, by Consumption Analysis 2019 & 2032
- Table 67: Global South and Central America Oil Field Services Industry Revenue Million Forecast, by Import Market Analysis (Value & Volume) 2019 & 2032
- Table 68: Global South and Central America Oil Field Services Industry Revenue Million Forecast, by Export Market Analysis (Value & Volume) 2019 & 2032
- Table 69: Global South and Central America Oil Field Services Industry Revenue Million Forecast, by Price Trend Analysis 2019 & 2032
- Table 70: Global South and Central America Oil Field Services Industry Revenue Million Forecast, by Country 2019 & 2032
- Table 71: Global South and Central America Oil Field Services Industry Revenue Million Forecast, by Production Analysis 2019 & 2032
- Table 72: Global South and Central America Oil Field Services Industry Revenue Million Forecast, by Consumption Analysis 2019 & 2032
- Table 73: Global South and Central America Oil Field Services Industry Revenue Million Forecast, by Import Market Analysis (Value & Volume) 2019 & 2032
- Table 74: Global South and Central America Oil Field Services Industry Revenue Million Forecast, by Export Market Analysis (Value & Volume) 2019 & 2032
- Table 75: Global South and Central America Oil Field Services Industry Revenue Million Forecast, by Price Trend Analysis 2019 & 2032
- Table 76: Global South and Central America Oil Field Services Industry Revenue Million Forecast, by Country 2019 & 2032
Frequently Asked Questions
1. What is the projected Compound Annual Growth Rate (CAGR) of the South and Central America Oil Field Services Industry?
The projected CAGR is approximately 4.61%.
2. Which companies are prominent players in the South and Central America Oil Field Services Industry?
Key companies in the market include Halliburton , Schlumberger , Baker Hughes , Weatherford International , Expro International.
3. What are the main segments of the South and Central America Oil Field Services Industry?
The market segments include Production Analysis, Consumption Analysis, Import Market Analysis (Value & Volume), Export Market Analysis (Value & Volume), Price Trend Analysis.
4. Can you provide details about the market size?
The market size is estimated to be USD XX Million as of 2022.
5. What are some drivers contributing to market growth?
4.; Increasing Number of Offshore Operations 4.; Demand Coming for Unconventional Energy Sources.
6. What are the notable trends driving market growth?
Drilling Services Expected to dominate the market.
7. Are there any restraints impacting market growth?
4.; Demand for Renewable Energy.
8. Can you provide examples of recent developments in the market?
November 2022: Petrobras awarded Diamond Offshore's Ocean Courage a four-year project with an unpriced option for an additional four years in Brazil. The estimated total value of the firm term of the award, which includes a mobilization fee and the provision of some extra services, is about USD 429 million.The contract is expected to commence in Q4 2023.
9. What pricing options are available for accessing the report?
Pricing options include single-user, multi-user, and enterprise licenses priced at USD 4750, USD 5250, and USD 8750 respectively.
10. Is the market size provided in terms of value or volume?
The market size is provided in terms of value, measured in Million.
11. Are there any specific market keywords associated with the report?
Yes, the market keyword associated with the report is "South and Central America Oil Field Services Industry," which aids in identifying and referencing the specific market segment covered.
12. How do I determine which pricing option suits my needs best?
The pricing options vary based on user requirements and access needs. Individual users may opt for single-user licenses, while businesses requiring broader access may choose multi-user or enterprise licenses for cost-effective access to the report.
13. Are there any additional resources or data provided in the South and Central America Oil Field Services Industry report?
While the report offers comprehensive insights, it's advisable to review the specific contents or supplementary materials provided to ascertain if additional resources or data are available.
14. How can I stay updated on further developments or reports in the South and Central America Oil Field Services Industry?
To stay informed about further developments, trends, and reports in the South and Central America Oil Field Services Industry, consider subscribing to industry newsletters, following relevant companies and organizations, or regularly checking reputable industry news sources and publications.
Methodology
Step 1 - Identification of Relevant Samples Size from Population Database


Step 2 - Approaches for Defining Global Market Size (Value, Volume* & Price*)

Note*: In applicable scenarios
Step 3 - Data Sources
Primary Research
- Web Analytics
- Survey Reports
- Research Institute
- Latest Research Reports
- Opinion Leaders
Secondary Research
- Annual Reports
- White Paper
- Latest Press Release
- Industry Association
- Paid Database
- Investor Presentations

Step 4 - Data Triangulation
Involves using different sources of information in order to increase the validity of a study
These sources are likely to be stakeholders in a program - participants, other researchers, program staff, other community members, and so on.
Then we put all data in single framework & apply various statistical tools to find out the dynamic on the market.
During the analysis stage, feedback from the stakeholder groups would be compared to determine areas of agreement as well as areas of divergence


