
Key Insights
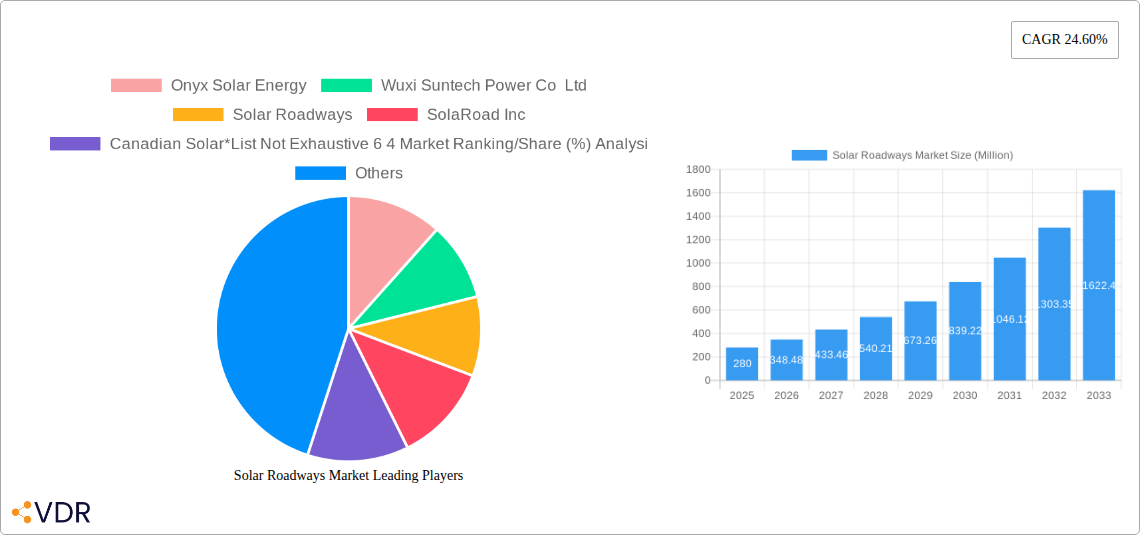
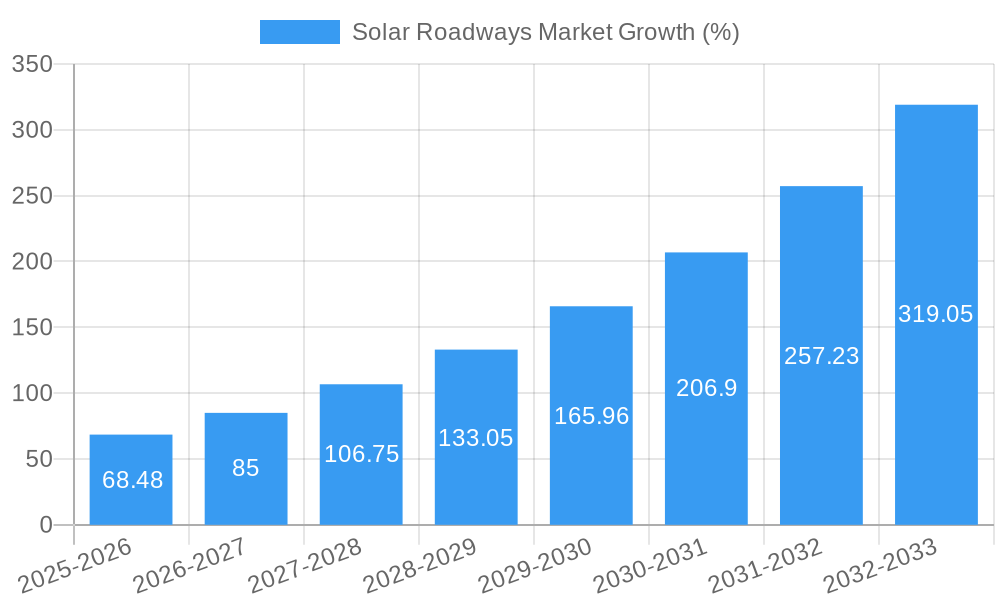
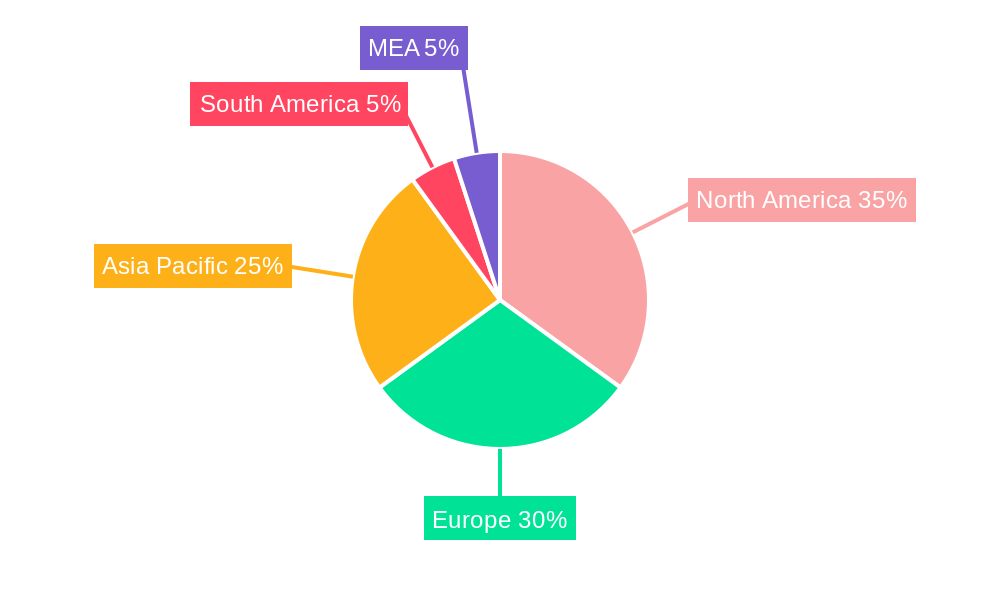
The global solar roadways market is experiencing robust growth, projected to reach a market size of $280 million in 2025, exhibiting a remarkable Compound Annual Growth Rate (CAGR) of 24.60%. This expansion is fueled by several key drivers. Increasing government initiatives promoting renewable energy sources and sustainable infrastructure development are significantly boosting market adoption. The rising demand for environmentally friendly solutions in urban planning and transportation infrastructure is further propelling market growth. Technological advancements leading to improved efficiency, durability, and cost-effectiveness of solar roadways are also playing a vital role. The shift towards smart cities and the integration of solar technology into existing infrastructure present significant opportunities. Market segmentation reveals a strong preference for monocrystalline silicon materials due to their higher energy conversion efficiency compared to polycrystalline silicon. Applications are primarily focused on driveways and parking lots, but future expansion into larger-scale projects like roads and bike paths is anticipated. Key players like Onyx Solar Energy, Wuxi Suntech Power Co Ltd, and Solar Roadways are driving innovation and market competition, continually improving product offerings and expanding market reach. Geographic analysis suggests North America and Europe hold significant market share currently, while the Asia-Pacific region is poised for substantial growth in the coming years driven by increasing infrastructure investment and government support in countries like China and India.
The market's growth trajectory is expected to continue through 2033, driven by ongoing technological advancements and the increasing urgency to address climate change and reduce carbon emissions. However, challenges remain, including high initial investment costs, potential maintenance complexities, and the need for robust grid integration solutions. Overcoming these restraints through further technological breakthroughs and supportive policy frameworks will be crucial for sustained market expansion. The market will witness a diversification of applications beyond initial focuses, including integration with charging stations for electric vehicles and smart city initiatives, creating new revenue streams and further boosting market expansion. The competitive landscape is likely to become more intense, with both established players and new entrants vying for market share, leading to increased innovation and product differentiation.
Solar Roadways Market: A Comprehensive Market Report (2019-2033)
This in-depth report provides a comprehensive analysis of the Solar Roadways Market, encompassing market dynamics, growth trends, regional dominance, product landscape, key players, and future outlook. The study period covers 2019-2033, with 2025 as the base and estimated year. The report delves into both parent and child markets, offering granular insights for informed decision-making. The global market size is predicted to reach xx Million units by 2033.
Keywords: Solar Roadways, Solar Panels, PV System, Renewable Energy, Sustainable Infrastructure, Monocrystalline Silicon, Polycrystalline Silicon, Driveways, Parking Lots, Onyx Solar Energy, Wuxi Suntech Power Co Ltd, Solar Roadways, SolaRoad Inc, Canadian Solar, Wattway, Colas Group, PLATIO Solar, Market Share, Market Size, Market Growth, Market Analysis, Market Forecast.
Solar Roadways Market Dynamics & Structure
The Solar Roadways market is characterized by moderate concentration, with key players like Onyx Solar Energy, Wuxi Suntech Power Co Ltd, and Solar Roadways holding significant market shares. Technological innovation, particularly in enhancing panel durability and efficiency, is a major driver. Regulatory frameworks, including government incentives and building codes, play a crucial role in market penetration. Competitive substitutes, such as traditional asphalt and other renewable energy sources, pose challenges. End-user demographics, primarily focused on government entities and private developers, influence market demand. M&A activity remains relatively low, with xx deals recorded between 2019 and 2024.
- Market Concentration: Moderately concentrated, with top 5 players holding approximately xx% market share in 2024.
- Technological Innovation: Focus on increasing panel durability, efficiency, and cost-effectiveness.
- Regulatory Framework: Government incentives and building codes significantly impact market adoption.
- Competitive Substitutes: Traditional asphalt and other renewable energy solutions.
- End-User Demographics: Primarily government bodies, private developers, and large infrastructure projects.
- M&A Activity: xx deals recorded between 2019 and 2024, indicating a relatively low level of consolidation.
Solar Roadways Market Growth Trends & Insights
The Solar Roadways market exhibits robust growth, driven by increasing awareness of environmental sustainability and the need for decentralized energy generation. The market size experienced a CAGR of xx% during the historical period (2019-2024) and is projected to grow at a CAGR of xx% during the forecast period (2025-2033). Market penetration remains relatively low, with only xx% of potential applications currently utilizing solar roadways technology. Technological disruptions, such as advancements in flexible solar cells and energy storage solutions, are accelerating adoption. Consumer behavior shifts toward environmentally conscious choices are fueling demand.
Dominant Regions, Countries, or Segments in Solar Roadways Market
The North American region currently dominates the Solar Roadways market, followed by Europe. Within these regions, countries with strong government support for renewable energy initiatives and well-developed infrastructure are leading the way. The "Driveways" application segment currently holds the largest market share, primarily due to its relatively smaller scale and easier implementation compared to larger projects like parking lots. Monocrystalline silicon currently dominates the materials segment due to its higher efficiency, although polycrystalline silicon offers a more cost-effective alternative.
- Key Drivers in North America: Strong government support for renewable energy, robust infrastructure development, and early adoption of innovative technologies.
- Key Drivers in Europe: Growing environmental awareness, stringent emission reduction targets, and increasing investment in sustainable infrastructure.
- Driveways Segment Dominance: Easier implementation and smaller scale compared to large parking lots.
- Monocrystalline Silicon Material Leadership: Higher efficiency despite higher cost compared to polycrystalline silicon.
Solar Roadways Market Product Landscape
Solar roadways technology is constantly evolving, with advancements focused on enhancing panel durability, efficiency, and aesthetic integration. Products range from rigid panels suitable for high-traffic areas to flexible panels adaptable to various surfaces. Key selling propositions include reduced reliance on fossil fuels, self-powered lighting, and integration with smart city technologies. Technological advancements include improved heat resistance, enhanced anti-slip properties, and increased energy generation capacity.
Key Drivers, Barriers & Challenges in Solar Roadways Market
Key Drivers:
- Increasing demand for renewable energy sources.
- Government incentives and subsidies for sustainable infrastructure.
- Technological advancements improving efficiency and durability.
- Growing awareness of climate change and environmental sustainability.
Key Challenges:
- High initial investment costs.
- Durability concerns related to weather and traffic conditions.
- Limited standardization and interoperability of systems.
- Potential for damage from heavy vehicles.
- xx% of projects face delays due to permitting and regulatory hurdles.
Emerging Opportunities in Solar Roadways Market
- Expansion into developing countries with growing infrastructure needs.
- Integration with electric vehicle charging stations.
- Development of customized solutions for specific applications (e.g., pedestrian walkways, bicycle paths).
- Exploration of innovative materials and manufacturing processes to reduce costs.
Growth Accelerators in the Solar Roadways Market Industry
Technological breakthroughs in flexible and efficient solar cells, along with strategic partnerships between technology developers, construction firms, and government agencies, are set to accelerate market growth. Expansion strategies focusing on emerging markets and innovative applications will further propel market expansion.
Key Players Shaping the Solar Roadways Market Market
- Onyx Solar Energy
- Wuxi Suntech Power Co Ltd
- Solar Roadways
- SolaRoad Inc
- Canadian Solar
- Wattway
- Colas Group
- PLATIO Solar
Notable Milestones in Solar Roadways Market Sector
- May 2023: The Dutch province of North Brabant initiated construction of a 500-meter solar cycle path, demonstrating the growing interest in integrating solar technology into various infrastructure elements. This pilot project will assess panel durability, maintenance costs, and energy yield over five years, providing valuable data for future deployments.
In-Depth Solar Roadways Market Market Outlook
The Solar Roadways market is poised for significant growth, driven by sustained demand for renewable energy, ongoing technological advancements, and supportive government policies. Strategic partnerships and innovative application expansion into new markets will unlock further growth potential. The market is expected to witness increased consolidation as key players focus on enhancing their product offerings and expanding their geographical reach.
Solar Roadways Market Segmentation
-
1. Materials
- 1.1. Monocrystalline Silicon
- 1.2. Polycrystalline Silicon
-
2. Applications
- 2.1. Driveways
- 2.2. Parking Lots
Solar Roadways Market Segmentation By Geography
-
1. North America
- 1.1. United States
- 1.2. Canada
- 1.3. Rest of North America
-
2. Europe
- 2.1. Germany
- 2.2. France
- 2.3. United Kingdom
- 2.4. Italy
- 2.5. Spain
- 2.6. NORDIC
- 2.7. Turkey
- 2.8. Russia
- 2.9. Rest of Europe
-
3. Asia Pacific
- 3.1. China
- 3.2. India
- 3.3. Japan
- 3.4. Malaysia
- 3.5. Thailand
- 3.6. Indonesia
- 3.7. Vietnam
- 3.8. Rest of Asia Pacific
-
4. Middle East and Africa
- 4.1. Saudi Arabia
- 4.2. United Arab Emirates
- 4.3. South Africa
- 4.4. Qatar
- 4.5. Egypt
- 4.6. Nigeria
- 4.7. Rest of Middle East and Africa
-
5. South America
- 5.1. Brazil
- 5.2. Argentina
- 5.3. Colombia
- 5.4. Rest of South America
Solar Roadways Market REPORT HIGHLIGHTS
| Aspects | Details |
|---|---|
| Study Period | 2019-2033 |
| Base Year | 2024 |
| Estimated Year | 2025 |
| Forecast Period | 2025-2033 |
| Historical Period | 2019-2024 |
| Growth Rate | CAGR of 24.60% from 2019-2033 |
| Segmentation |
|
Table of Contents
- 1. Introduction
- 1.1. Research Scope
- 1.2. Market Segmentation
- 1.3. Research Methodology
- 1.4. Definitions and Assumptions
- 2. Executive Summary
- 2.1. Introduction
- 3. Market Dynamics
- 3.1. Introduction
- 3.2. Market Drivers
- 3.2.1. 4.; Growing Adoption of Renewable Energy4.; Efforts in Sustainable Infrastructure to Reduce Carbon Footprints
- 3.3. Market Restrains
- 3.3.1. 4.; High Initial Cost Associated With Developing the Infrastructure
- 3.4. Market Trends
- 3.4.1. The Driveways Segment is Expected to Witness Significant Growth
- 4. Market Factor Analysis
- 4.1. Porters Five Forces
- 4.2. Supply/Value Chain
- 4.3. PESTEL analysis
- 4.4. Market Entropy
- 4.5. Patent/Trademark Analysis
- 5. Global Solar Roadways Market Analysis, Insights and Forecast, 2019-2031
- 5.1. Market Analysis, Insights and Forecast - by Materials
- 5.1.1. Monocrystalline Silicon
- 5.1.2. Polycrystalline Silicon
- 5.2. Market Analysis, Insights and Forecast - by Applications
- 5.2.1. Driveways
- 5.2.2. Parking Lots
- 5.3. Market Analysis, Insights and Forecast - by Region
- 5.3.1. North America
- 5.3.2. Europe
- 5.3.3. Asia Pacific
- 5.3.4. Middle East and Africa
- 5.3.5. South America
- 5.1. Market Analysis, Insights and Forecast - by Materials
- 6. North America Solar Roadways Market Analysis, Insights and Forecast, 2019-2031
- 6.1. Market Analysis, Insights and Forecast - by Materials
- 6.1.1. Monocrystalline Silicon
- 6.1.2. Polycrystalline Silicon
- 6.2. Market Analysis, Insights and Forecast - by Applications
- 6.2.1. Driveways
- 6.2.2. Parking Lots
- 6.1. Market Analysis, Insights and Forecast - by Materials
- 7. Europe Solar Roadways Market Analysis, Insights and Forecast, 2019-2031
- 7.1. Market Analysis, Insights and Forecast - by Materials
- 7.1.1. Monocrystalline Silicon
- 7.1.2. Polycrystalline Silicon
- 7.2. Market Analysis, Insights and Forecast - by Applications
- 7.2.1. Driveways
- 7.2.2. Parking Lots
- 7.1. Market Analysis, Insights and Forecast - by Materials
- 8. Asia Pacific Solar Roadways Market Analysis, Insights and Forecast, 2019-2031
- 8.1. Market Analysis, Insights and Forecast - by Materials
- 8.1.1. Monocrystalline Silicon
- 8.1.2. Polycrystalline Silicon
- 8.2. Market Analysis, Insights and Forecast - by Applications
- 8.2.1. Driveways
- 8.2.2. Parking Lots
- 8.1. Market Analysis, Insights and Forecast - by Materials
- 9. Middle East and Africa Solar Roadways Market Analysis, Insights and Forecast, 2019-2031
- 9.1. Market Analysis, Insights and Forecast - by Materials
- 9.1.1. Monocrystalline Silicon
- 9.1.2. Polycrystalline Silicon
- 9.2. Market Analysis, Insights and Forecast - by Applications
- 9.2.1. Driveways
- 9.2.2. Parking Lots
- 9.1. Market Analysis, Insights and Forecast - by Materials
- 10. South America Solar Roadways Market Analysis, Insights and Forecast, 2019-2031
- 10.1. Market Analysis, Insights and Forecast - by Materials
- 10.1.1. Monocrystalline Silicon
- 10.1.2. Polycrystalline Silicon
- 10.2. Market Analysis, Insights and Forecast - by Applications
- 10.2.1. Driveways
- 10.2.2. Parking Lots
- 10.1. Market Analysis, Insights and Forecast - by Materials
- 11. North America Solar Roadways Market Analysis, Insights and Forecast, 2019-2031
- 11.1. Market Analysis, Insights and Forecast - By Country/Sub-region
- 11.1.1 United States
- 11.1.2 Canada
- 11.1.3 Mexico
- 12. Europe Solar Roadways Market Analysis, Insights and Forecast, 2019-2031
- 12.1. Market Analysis, Insights and Forecast - By Country/Sub-region
- 12.1.1 Germany
- 12.1.2 United Kingdom
- 12.1.3 France
- 12.1.4 Spain
- 12.1.5 Italy
- 12.1.6 Spain
- 12.1.7 Belgium
- 12.1.8 Netherland
- 12.1.9 Nordics
- 12.1.10 Rest of Europe
- 13. Asia Pacific Solar Roadways Market Analysis, Insights and Forecast, 2019-2031
- 13.1. Market Analysis, Insights and Forecast - By Country/Sub-region
- 13.1.1 China
- 13.1.2 Japan
- 13.1.3 India
- 13.1.4 South Korea
- 13.1.5 Southeast Asia
- 13.1.6 Australia
- 13.1.7 Indonesia
- 13.1.8 Phillipes
- 13.1.9 Singapore
- 13.1.10 Thailandc
- 13.1.11 Rest of Asia Pacific
- 14. South America Solar Roadways Market Analysis, Insights and Forecast, 2019-2031
- 14.1. Market Analysis, Insights and Forecast - By Country/Sub-region
- 14.1.1 Brazil
- 14.1.2 Argentina
- 14.1.3 Peru
- 14.1.4 Chile
- 14.1.5 Colombia
- 14.1.6 Ecuador
- 14.1.7 Venezuela
- 14.1.8 Rest of South America
- 15. North America Solar Roadways Market Analysis, Insights and Forecast, 2019-2031
- 15.1. Market Analysis, Insights and Forecast - By Country/Sub-region
- 15.1.1 United States
- 15.1.2 Canada
- 15.1.3 Mexico
- 16. MEA Solar Roadways Market Analysis, Insights and Forecast, 2019-2031
- 16.1. Market Analysis, Insights and Forecast - By Country/Sub-region
- 16.1.1 United Arab Emirates
- 16.1.2 Saudi Arabia
- 16.1.3 South Africa
- 16.1.4 Rest of Middle East and Africa
- 17. Competitive Analysis
- 17.1. Global Market Share Analysis 2024
- 17.2. Company Profiles
- 17.2.1 Onyx Solar Energy
- 17.2.1.1. Overview
- 17.2.1.2. Products
- 17.2.1.3. SWOT Analysis
- 17.2.1.4. Recent Developments
- 17.2.1.5. Financials (Based on Availability)
- 17.2.2 Wuxi Suntech Power Co Ltd
- 17.2.2.1. Overview
- 17.2.2.2. Products
- 17.2.2.3. SWOT Analysis
- 17.2.2.4. Recent Developments
- 17.2.2.5. Financials (Based on Availability)
- 17.2.3 Solar Roadways
- 17.2.3.1. Overview
- 17.2.3.2. Products
- 17.2.3.3. SWOT Analysis
- 17.2.3.4. Recent Developments
- 17.2.3.5. Financials (Based on Availability)
- 17.2.4 SolaRoad Inc
- 17.2.4.1. Overview
- 17.2.4.2. Products
- 17.2.4.3. SWOT Analysis
- 17.2.4.4. Recent Developments
- 17.2.4.5. Financials (Based on Availability)
- 17.2.5 Canadian Solar*List Not Exhaustive 6 4 Market Ranking/Share (%) Analysi
- 17.2.5.1. Overview
- 17.2.5.2. Products
- 17.2.5.3. SWOT Analysis
- 17.2.5.4. Recent Developments
- 17.2.5.5. Financials (Based on Availability)
- 17.2.6 Wattway
- 17.2.6.1. Overview
- 17.2.6.2. Products
- 17.2.6.3. SWOT Analysis
- 17.2.6.4. Recent Developments
- 17.2.6.5. Financials (Based on Availability)
- 17.2.7 Colas Group
- 17.2.7.1. Overview
- 17.2.7.2. Products
- 17.2.7.3. SWOT Analysis
- 17.2.7.4. Recent Developments
- 17.2.7.5. Financials (Based on Availability)
- 17.2.8 PLATIO Solar
- 17.2.8.1. Overview
- 17.2.8.2. Products
- 17.2.8.3. SWOT Analysis
- 17.2.8.4. Recent Developments
- 17.2.8.5. Financials (Based on Availability)
- 17.2.1 Onyx Solar Energy
List of Figures
- Figure 1: Global Solar Roadways Market Revenue Breakdown (Million, %) by Region 2024 & 2032
- Figure 2: North America Solar Roadways Market Revenue (Million), by Country 2024 & 2032
- Figure 3: North America Solar Roadways Market Revenue Share (%), by Country 2024 & 2032
- Figure 4: Europe Solar Roadways Market Revenue (Million), by Country 2024 & 2032
- Figure 5: Europe Solar Roadways Market Revenue Share (%), by Country 2024 & 2032
- Figure 6: Asia Pacific Solar Roadways Market Revenue (Million), by Country 2024 & 2032
- Figure 7: Asia Pacific Solar Roadways Market Revenue Share (%), by Country 2024 & 2032
- Figure 8: South America Solar Roadways Market Revenue (Million), by Country 2024 & 2032
- Figure 9: South America Solar Roadways Market Revenue Share (%), by Country 2024 & 2032
- Figure 10: North America Solar Roadways Market Revenue (Million), by Country 2024 & 2032
- Figure 11: North America Solar Roadways Market Revenue Share (%), by Country 2024 & 2032
- Figure 12: MEA Solar Roadways Market Revenue (Million), by Country 2024 & 2032
- Figure 13: MEA Solar Roadways Market Revenue Share (%), by Country 2024 & 2032
- Figure 14: North America Solar Roadways Market Revenue (Million), by Materials 2024 & 2032
- Figure 15: North America Solar Roadways Market Revenue Share (%), by Materials 2024 & 2032
- Figure 16: North America Solar Roadways Market Revenue (Million), by Applications 2024 & 2032
- Figure 17: North America Solar Roadways Market Revenue Share (%), by Applications 2024 & 2032
- Figure 18: North America Solar Roadways Market Revenue (Million), by Country 2024 & 2032
- Figure 19: North America Solar Roadways Market Revenue Share (%), by Country 2024 & 2032
- Figure 20: Europe Solar Roadways Market Revenue (Million), by Materials 2024 & 2032
- Figure 21: Europe Solar Roadways Market Revenue Share (%), by Materials 2024 & 2032
- Figure 22: Europe Solar Roadways Market Revenue (Million), by Applications 2024 & 2032
- Figure 23: Europe Solar Roadways Market Revenue Share (%), by Applications 2024 & 2032
- Figure 24: Europe Solar Roadways Market Revenue (Million), by Country 2024 & 2032
- Figure 25: Europe Solar Roadways Market Revenue Share (%), by Country 2024 & 2032
- Figure 26: Asia Pacific Solar Roadways Market Revenue (Million), by Materials 2024 & 2032
- Figure 27: Asia Pacific Solar Roadways Market Revenue Share (%), by Materials 2024 & 2032
- Figure 28: Asia Pacific Solar Roadways Market Revenue (Million), by Applications 2024 & 2032
- Figure 29: Asia Pacific Solar Roadways Market Revenue Share (%), by Applications 2024 & 2032
- Figure 30: Asia Pacific Solar Roadways Market Revenue (Million), by Country 2024 & 2032
- Figure 31: Asia Pacific Solar Roadways Market Revenue Share (%), by Country 2024 & 2032
- Figure 32: Middle East and Africa Solar Roadways Market Revenue (Million), by Materials 2024 & 2032
- Figure 33: Middle East and Africa Solar Roadways Market Revenue Share (%), by Materials 2024 & 2032
- Figure 34: Middle East and Africa Solar Roadways Market Revenue (Million), by Applications 2024 & 2032
- Figure 35: Middle East and Africa Solar Roadways Market Revenue Share (%), by Applications 2024 & 2032
- Figure 36: Middle East and Africa Solar Roadways Market Revenue (Million), by Country 2024 & 2032
- Figure 37: Middle East and Africa Solar Roadways Market Revenue Share (%), by Country 2024 & 2032
- Figure 38: South America Solar Roadways Market Revenue (Million), by Materials 2024 & 2032
- Figure 39: South America Solar Roadways Market Revenue Share (%), by Materials 2024 & 2032
- Figure 40: South America Solar Roadways Market Revenue (Million), by Applications 2024 & 2032
- Figure 41: South America Solar Roadways Market Revenue Share (%), by Applications 2024 & 2032
- Figure 42: South America Solar Roadways Market Revenue (Million), by Country 2024 & 2032
- Figure 43: South America Solar Roadways Market Revenue Share (%), by Country 2024 & 2032
List of Tables
- Table 1: Global Solar Roadways Market Revenue Million Forecast, by Region 2019 & 2032
- Table 2: Global Solar Roadways Market Revenue Million Forecast, by Materials 2019 & 2032
- Table 3: Global Solar Roadways Market Revenue Million Forecast, by Applications 2019 & 2032
- Table 4: Global Solar Roadways Market Revenue Million Forecast, by Region 2019 & 2032
- Table 5: Global Solar Roadways Market Revenue Million Forecast, by Country 2019 & 2032
- Table 6: United States Solar Roadways Market Revenue (Million) Forecast, by Application 2019 & 2032
- Table 7: Canada Solar Roadways Market Revenue (Million) Forecast, by Application 2019 & 2032
- Table 8: Mexico Solar Roadways Market Revenue (Million) Forecast, by Application 2019 & 2032
- Table 9: Global Solar Roadways Market Revenue Million Forecast, by Country 2019 & 2032
- Table 10: Germany Solar Roadways Market Revenue (Million) Forecast, by Application 2019 & 2032
- Table 11: United Kingdom Solar Roadways Market Revenue (Million) Forecast, by Application 2019 & 2032
- Table 12: France Solar Roadways Market Revenue (Million) Forecast, by Application 2019 & 2032
- Table 13: Spain Solar Roadways Market Revenue (Million) Forecast, by Application 2019 & 2032
- Table 14: Italy Solar Roadways Market Revenue (Million) Forecast, by Application 2019 & 2032
- Table 15: Spain Solar Roadways Market Revenue (Million) Forecast, by Application 2019 & 2032
- Table 16: Belgium Solar Roadways Market Revenue (Million) Forecast, by Application 2019 & 2032
- Table 17: Netherland Solar Roadways Market Revenue (Million) Forecast, by Application 2019 & 2032
- Table 18: Nordics Solar Roadways Market Revenue (Million) Forecast, by Application 2019 & 2032
- Table 19: Rest of Europe Solar Roadways Market Revenue (Million) Forecast, by Application 2019 & 2032
- Table 20: Global Solar Roadways Market Revenue Million Forecast, by Country 2019 & 2032
- Table 21: China Solar Roadways Market Revenue (Million) Forecast, by Application 2019 & 2032
- Table 22: Japan Solar Roadways Market Revenue (Million) Forecast, by Application 2019 & 2032
- Table 23: India Solar Roadways Market Revenue (Million) Forecast, by Application 2019 & 2032
- Table 24: South Korea Solar Roadways Market Revenue (Million) Forecast, by Application 2019 & 2032
- Table 25: Southeast Asia Solar Roadways Market Revenue (Million) Forecast, by Application 2019 & 2032
- Table 26: Australia Solar Roadways Market Revenue (Million) Forecast, by Application 2019 & 2032
- Table 27: Indonesia Solar Roadways Market Revenue (Million) Forecast, by Application 2019 & 2032
- Table 28: Phillipes Solar Roadways Market Revenue (Million) Forecast, by Application 2019 & 2032
- Table 29: Singapore Solar Roadways Market Revenue (Million) Forecast, by Application 2019 & 2032
- Table 30: Thailandc Solar Roadways Market Revenue (Million) Forecast, by Application 2019 & 2032
- Table 31: Rest of Asia Pacific Solar Roadways Market Revenue (Million) Forecast, by Application 2019 & 2032
- Table 32: Global Solar Roadways Market Revenue Million Forecast, by Country 2019 & 2032
- Table 33: Brazil Solar Roadways Market Revenue (Million) Forecast, by Application 2019 & 2032
- Table 34: Argentina Solar Roadways Market Revenue (Million) Forecast, by Application 2019 & 2032
- Table 35: Peru Solar Roadways Market Revenue (Million) Forecast, by Application 2019 & 2032
- Table 36: Chile Solar Roadways Market Revenue (Million) Forecast, by Application 2019 & 2032
- Table 37: Colombia Solar Roadways Market Revenue (Million) Forecast, by Application 2019 & 2032
- Table 38: Ecuador Solar Roadways Market Revenue (Million) Forecast, by Application 2019 & 2032
- Table 39: Venezuela Solar Roadways Market Revenue (Million) Forecast, by Application 2019 & 2032
- Table 40: Rest of South America Solar Roadways Market Revenue (Million) Forecast, by Application 2019 & 2032
- Table 41: Global Solar Roadways Market Revenue Million Forecast, by Country 2019 & 2032
- Table 42: United States Solar Roadways Market Revenue (Million) Forecast, by Application 2019 & 2032
- Table 43: Canada Solar Roadways Market Revenue (Million) Forecast, by Application 2019 & 2032
- Table 44: Mexico Solar Roadways Market Revenue (Million) Forecast, by Application 2019 & 2032
- Table 45: Global Solar Roadways Market Revenue Million Forecast, by Country 2019 & 2032
- Table 46: United Arab Emirates Solar Roadways Market Revenue (Million) Forecast, by Application 2019 & 2032
- Table 47: Saudi Arabia Solar Roadways Market Revenue (Million) Forecast, by Application 2019 & 2032
- Table 48: South Africa Solar Roadways Market Revenue (Million) Forecast, by Application 2019 & 2032
- Table 49: Rest of Middle East and Africa Solar Roadways Market Revenue (Million) Forecast, by Application 2019 & 2032
- Table 50: Global Solar Roadways Market Revenue Million Forecast, by Materials 2019 & 2032
- Table 51: Global Solar Roadways Market Revenue Million Forecast, by Applications 2019 & 2032
- Table 52: Global Solar Roadways Market Revenue Million Forecast, by Country 2019 & 2032
- Table 53: United States Solar Roadways Market Revenue (Million) Forecast, by Application 2019 & 2032
- Table 54: Canada Solar Roadways Market Revenue (Million) Forecast, by Application 2019 & 2032
- Table 55: Rest of North America Solar Roadways Market Revenue (Million) Forecast, by Application 2019 & 2032
- Table 56: Global Solar Roadways Market Revenue Million Forecast, by Materials 2019 & 2032
- Table 57: Global Solar Roadways Market Revenue Million Forecast, by Applications 2019 & 2032
- Table 58: Global Solar Roadways Market Revenue Million Forecast, by Country 2019 & 2032
- Table 59: Germany Solar Roadways Market Revenue (Million) Forecast, by Application 2019 & 2032
- Table 60: France Solar Roadways Market Revenue (Million) Forecast, by Application 2019 & 2032
- Table 61: United Kingdom Solar Roadways Market Revenue (Million) Forecast, by Application 2019 & 2032
- Table 62: Italy Solar Roadways Market Revenue (Million) Forecast, by Application 2019 & 2032
- Table 63: Spain Solar Roadways Market Revenue (Million) Forecast, by Application 2019 & 2032
- Table 64: NORDIC Solar Roadways Market Revenue (Million) Forecast, by Application 2019 & 2032
- Table 65: Turkey Solar Roadways Market Revenue (Million) Forecast, by Application 2019 & 2032
- Table 66: Russia Solar Roadways Market Revenue (Million) Forecast, by Application 2019 & 2032
- Table 67: Rest of Europe Solar Roadways Market Revenue (Million) Forecast, by Application 2019 & 2032
- Table 68: Global Solar Roadways Market Revenue Million Forecast, by Materials 2019 & 2032
- Table 69: Global Solar Roadways Market Revenue Million Forecast, by Applications 2019 & 2032
- Table 70: Global Solar Roadways Market Revenue Million Forecast, by Country 2019 & 2032
- Table 71: China Solar Roadways Market Revenue (Million) Forecast, by Application 2019 & 2032
- Table 72: India Solar Roadways Market Revenue (Million) Forecast, by Application 2019 & 2032
- Table 73: Japan Solar Roadways Market Revenue (Million) Forecast, by Application 2019 & 2032
- Table 74: Malaysia Solar Roadways Market Revenue (Million) Forecast, by Application 2019 & 2032
- Table 75: Thailand Solar Roadways Market Revenue (Million) Forecast, by Application 2019 & 2032
- Table 76: Indonesia Solar Roadways Market Revenue (Million) Forecast, by Application 2019 & 2032
- Table 77: Vietnam Solar Roadways Market Revenue (Million) Forecast, by Application 2019 & 2032
- Table 78: Rest of Asia Pacific Solar Roadways Market Revenue (Million) Forecast, by Application 2019 & 2032
- Table 79: Global Solar Roadways Market Revenue Million Forecast, by Materials 2019 & 2032
- Table 80: Global Solar Roadways Market Revenue Million Forecast, by Applications 2019 & 2032
- Table 81: Global Solar Roadways Market Revenue Million Forecast, by Country 2019 & 2032
- Table 82: Saudi Arabia Solar Roadways Market Revenue (Million) Forecast, by Application 2019 & 2032
- Table 83: United Arab Emirates Solar Roadways Market Revenue (Million) Forecast, by Application 2019 & 2032
- Table 84: South Africa Solar Roadways Market Revenue (Million) Forecast, by Application 2019 & 2032
- Table 85: Qatar Solar Roadways Market Revenue (Million) Forecast, by Application 2019 & 2032
- Table 86: Egypt Solar Roadways Market Revenue (Million) Forecast, by Application 2019 & 2032
- Table 87: Nigeria Solar Roadways Market Revenue (Million) Forecast, by Application 2019 & 2032
- Table 88: Rest of Middle East and Africa Solar Roadways Market Revenue (Million) Forecast, by Application 2019 & 2032
- Table 89: Global Solar Roadways Market Revenue Million Forecast, by Materials 2019 & 2032
- Table 90: Global Solar Roadways Market Revenue Million Forecast, by Applications 2019 & 2032
- Table 91: Global Solar Roadways Market Revenue Million Forecast, by Country 2019 & 2032
- Table 92: Brazil Solar Roadways Market Revenue (Million) Forecast, by Application 2019 & 2032
- Table 93: Argentina Solar Roadways Market Revenue (Million) Forecast, by Application 2019 & 2032
- Table 94: Colombia Solar Roadways Market Revenue (Million) Forecast, by Application 2019 & 2032
- Table 95: Rest of South America Solar Roadways Market Revenue (Million) Forecast, by Application 2019 & 2032
Frequently Asked Questions
1. What is the projected Compound Annual Growth Rate (CAGR) of the Solar Roadways Market?
The projected CAGR is approximately 24.60%.
2. Which companies are prominent players in the Solar Roadways Market?
Key companies in the market include Onyx Solar Energy, Wuxi Suntech Power Co Ltd, Solar Roadways, SolaRoad Inc, Canadian Solar*List Not Exhaustive 6 4 Market Ranking/Share (%) Analysi, Wattway, Colas Group, PLATIO Solar.
3. What are the main segments of the Solar Roadways Market?
The market segments include Materials, Applications.
4. Can you provide details about the market size?
The market size is estimated to be USD 280 Million as of 2022.
5. What are some drivers contributing to market growth?
4.; Growing Adoption of Renewable Energy4.; Efforts in Sustainable Infrastructure to Reduce Carbon Footprints.
6. What are the notable trends driving market growth?
The Driveways Segment is Expected to Witness Significant Growth.
7. Are there any restraints impacting market growth?
4.; High Initial Cost Associated With Developing the Infrastructure.
8. Can you provide examples of recent developments in the market?
May 2023: The Dutch province of North Brabant started constructing a 500-meter-long ground-mounted solar cycle path along the provincial N285 road near Wagenberg. The PV system will be integrated into the asphalt top layer and comprise 600 unspecified solar panels. As per the government, the project is mainly intended to gain experience deploying solar cells on bicycle paths. During five years, government experts will assess the resistance of the solar modules to the mechanical stress applied by the presence of pedestrians and bikers, the costs for their maintenance, and the PV system energy yield.
9. What pricing options are available for accessing the report?
Pricing options include single-user, multi-user, and enterprise licenses priced at USD 4750, USD 5250, and USD 8750 respectively.
10. Is the market size provided in terms of value or volume?
The market size is provided in terms of value, measured in Million.
11. Are there any specific market keywords associated with the report?
Yes, the market keyword associated with the report is "Solar Roadways Market," which aids in identifying and referencing the specific market segment covered.
12. How do I determine which pricing option suits my needs best?
The pricing options vary based on user requirements and access needs. Individual users may opt for single-user licenses, while businesses requiring broader access may choose multi-user or enterprise licenses for cost-effective access to the report.
13. Are there any additional resources or data provided in the Solar Roadways Market report?
While the report offers comprehensive insights, it's advisable to review the specific contents or supplementary materials provided to ascertain if additional resources or data are available.
14. How can I stay updated on further developments or reports in the Solar Roadways Market?
To stay informed about further developments, trends, and reports in the Solar Roadways Market, consider subscribing to industry newsletters, following relevant companies and organizations, or regularly checking reputable industry news sources and publications.
Methodology
Step 1 - Identification of Relevant Samples Size from Population Database


Step 2 - Approaches for Defining Global Market Size (Value, Volume* & Price*)

Note*: In applicable scenarios
Step 3 - Data Sources
Primary Research
- Web Analytics
- Survey Reports
- Research Institute
- Latest Research Reports
- Opinion Leaders
Secondary Research
- Annual Reports
- White Paper
- Latest Press Release
- Industry Association
- Paid Database
- Investor Presentations

Step 4 - Data Triangulation
Involves using different sources of information in order to increase the validity of a study
These sources are likely to be stakeholders in a program - participants, other researchers, program staff, other community members, and so on.
Then we put all data in single framework & apply various statistical tools to find out the dynamic on the market.
During the analysis stage, feedback from the stakeholder groups would be compared to determine areas of agreement as well as areas of divergence


