
Key Insights
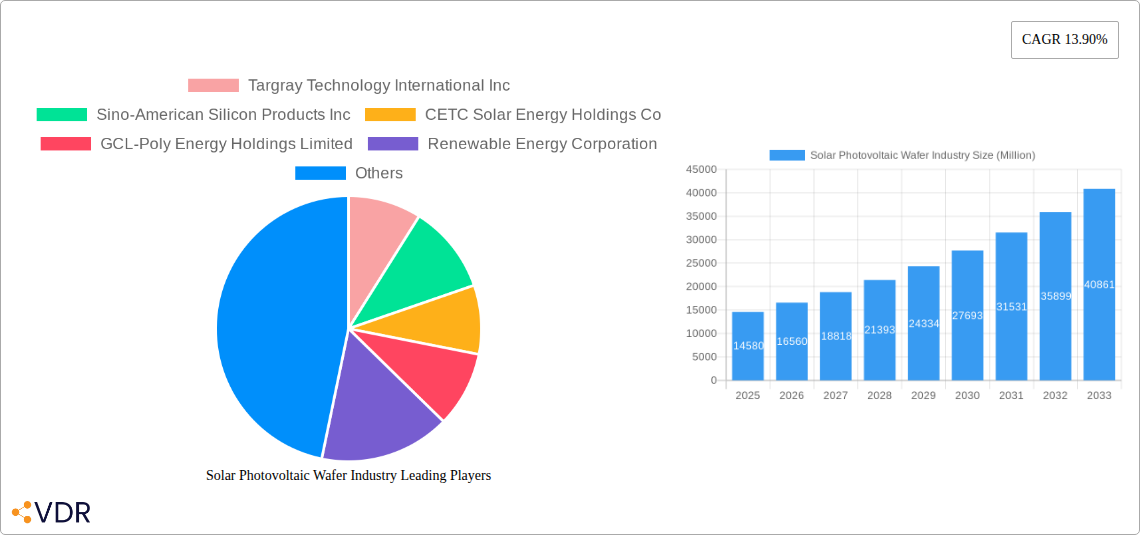
The global solar photovoltaic (PV) wafer market, valued at $14.58 billion in 2025, is projected to experience robust growth, driven by the increasing demand for renewable energy sources and supportive government policies worldwide. A compound annual growth rate (CAGR) of 13.90% is anticipated from 2025 to 2033, indicating a significant expansion of the market. This growth is fueled by several key factors. The decreasing cost of solar energy technology continues to make it a more competitive and attractive option compared to traditional fossil fuels. Furthermore, the rising concerns regarding climate change and the global push towards carbon neutrality are significantly boosting investments in solar energy infrastructure. Technological advancements in wafer production, leading to higher efficiency and improved durability, are also contributing to market expansion. The shift towards monocrystalline wafers, offering superior energy conversion efficiency compared to polycrystalline counterparts, is a notable trend shaping market dynamics. Geographic growth is expected to be widespread, with Asia-Pacific, particularly China, remaining a dominant player due to its large-scale manufacturing capabilities and significant solar energy deployment projects. However, North America and Europe are also anticipated to witness substantial growth driven by increasing government incentives and environmental awareness. Despite the positive outlook, challenges such as the volatility of raw material prices and supply chain disruptions could potentially impact market growth in the forecast period.
The market segmentation reveals a clear preference for monocrystalline wafers due to their higher efficiency. Regionally, Asia-Pacific holds a significant share, but North America and Europe are also key contributors. Leading companies such as Longi Green Energy Technology, JinkoSolar, JA Solar, and others are driving innovation and expansion in the sector, benefiting from economies of scale and strategic partnerships. The continued adoption of solar energy solutions globally, coupled with ongoing technological progress and favorable policy support, positions the solar PV wafer market for sustained growth throughout the forecast period, although potential risks from raw material costs and geopolitical factors must be considered. Future growth will likely be determined by factors such as advancements in solar cell technology, energy storage solutions, and governmental regulations.
Solar Photovoltaic Wafer Industry Market Report: 2019-2033
This comprehensive report provides an in-depth analysis of the global solar photovoltaic (PV) wafer market, encompassing market dynamics, growth trends, regional segmentation, product landscape, and key players. With a study period spanning 2019-2033, a base year of 2025, and a forecast period of 2025-2033, this report offers invaluable insights for industry professionals, investors, and stakeholders seeking to navigate this rapidly evolving sector. The report covers both parent markets (Solar Energy) and child markets (Monocrystalline & Polycrystalline Wafers) for a holistic view. Market values are presented in Million units.
Solar Photovoltaic Wafer Industry Market Dynamics & Structure
The global solar photovoltaic wafer market is characterized by intense competition, driven by technological advancements and increasing demand for renewable energy. Market concentration is moderate, with a few dominant players holding significant market share, while numerous smaller companies compete in niche segments. Technological innovation, primarily focused on enhancing efficiency and reducing production costs, is a key driver. Stringent environmental regulations and government incentives supporting renewable energy adoption significantly influence market growth. Monocrystalline wafers currently hold a larger market share than polycrystalline wafers due to higher efficiency, but polycrystalline wafers maintain a presence due to lower costs. Substitutes, such as thin-film solar cells, pose a competitive threat, while mergers and acquisitions (M&A) activity remains relatively high, indicating consolidation and expansion strategies within the industry. The overall market size in 2024 is estimated at xx Million units.
- Market Concentration: Moderate, with top 5 players holding approximately xx% market share in 2024.
- Technological Innovation: Focus on efficiency improvements (e.g., higher conversion rates), cost reduction through improved manufacturing processes, and new materials research.
- Regulatory Landscape: Favorable government policies and subsidies promoting solar energy adoption in various regions.
- Competitive Substitutes: Thin-film solar cells offer competition, but monocrystalline wafers maintain a strong edge in efficiency.
- End-User Demographics: Primarily utility-scale solar power plants, commercial and industrial installations, and residential rooftop systems.
- M&A Activity: Significant M&A activity observed in the historical period, with xx major deals recorded between 2019 and 2024.
Solar Photovoltaic Wafer Industry Growth Trends & Insights
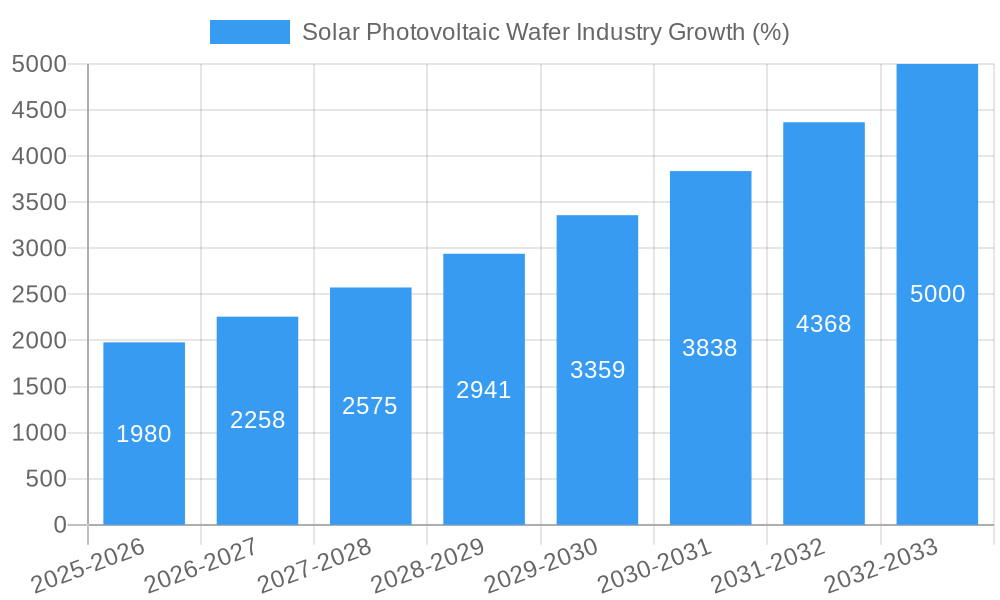
The global solar PV wafer market is experiencing robust growth, driven by the increasing global demand for renewable energy sources and decreasing solar energy costs. The market witnessed a CAGR of xx% during the historical period (2019-2024), and this growth trajectory is expected to continue during the forecast period (2025-2033). Market penetration is steadily increasing, particularly in regions with supportive government policies and abundant sunlight. Technological disruptions, such as advancements in wafer manufacturing processes and the development of more efficient solar cells, are further accelerating market growth. Consumer behavior is shifting towards greater adoption of renewable energy solutions, driven by environmental concerns and cost savings. The market size is projected to reach xx Million units by 2033.
Dominant Regions, Countries, or Segments in Solar Photovoltaic Wafer Industry
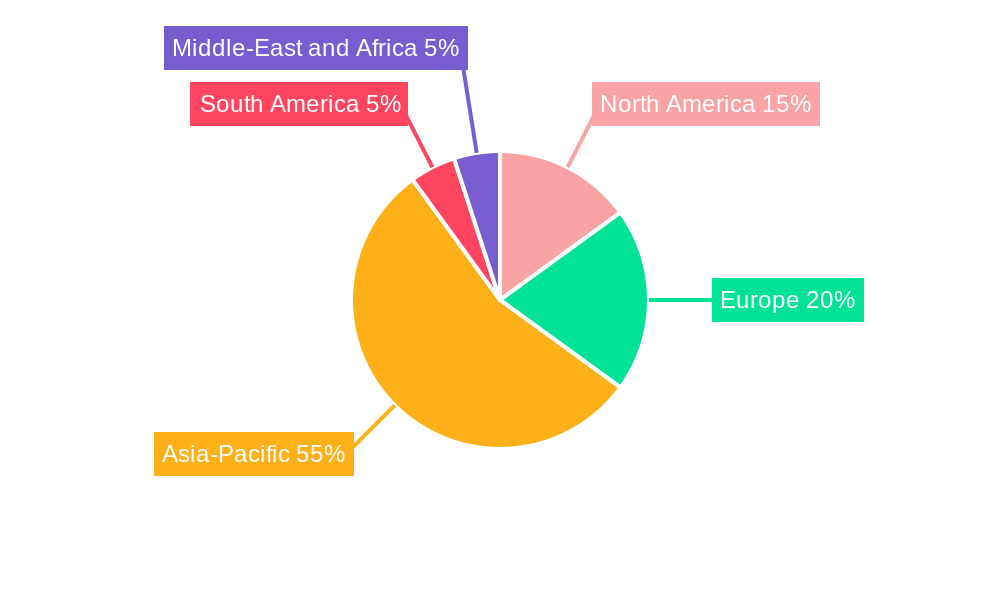
Asia-Pacific, particularly China, is the dominant region in the solar PV wafer market, accounting for a significant portion of global production and consumption. This dominance is attributed to large-scale investments in solar energy infrastructure, supportive government policies, and a robust manufacturing base. Other key regions include Europe and North America, exhibiting substantial growth potential driven by increasing renewable energy targets and a growing awareness of environmental sustainability. Monocrystalline wafers currently dominate the product segment due to higher efficiency, although polycrystalline wafers retain a market share due to their lower cost.
- Asia-Pacific: Dominated by China, with significant growth in India, Japan, and other Southeast Asian countries. Key drivers include government incentives, large-scale solar projects, and a mature manufacturing sector.
- Europe: Strong growth driven by renewable energy targets, supportive policies, and increasing environmental awareness. Germany, France, and the UK are major markets.
- North America: Steady growth, with the US and Canada as key markets. Growth is propelled by increasing renewable energy adoption, government incentives, and corporate sustainability initiatives.
- Monocrystalline Wafers: Holds the largest market share due to higher efficiency and improved performance.
- Polycrystalline Wafers: Retains a significant market share due to lower cost, making it suitable for price-sensitive projects.
Solar Photovoltaic Wafer Industry Product Landscape
The solar PV wafer market offers two primary product types: monocrystalline and polycrystalline wafers. Monocrystalline wafers boast higher efficiency, leading to greater power output from solar panels. Polycrystalline wafers offer a cost-effective alternative, albeit with slightly lower efficiency. Continuous innovation focuses on improving both efficiency and reducing production costs through process optimization, material advancements, and automation. Unique selling propositions revolve around higher power output per unit area, enhanced durability, and improved temperature performance.
Key Drivers, Barriers & Challenges in Solar Photovoltaic Wafer Industry
Key Drivers: Increasing global demand for renewable energy, supportive government policies and subsidies, decreasing solar energy costs, technological advancements resulting in higher efficiency and lower production costs, and growing environmental awareness among consumers and businesses.
Key Challenges: Fluctuations in raw material prices (silicon), geopolitical uncertainties impacting supply chains, intense competition among manufacturers, potential overcapacity in certain regions, and technological advancements in competing solar technologies (e.g., thin-film). Supply chain disruptions can significantly impact production and lead to increased costs, affecting the overall market stability.
Emerging Opportunities in Solar Photovoltaic Wafer Industry
Emerging markets in developing countries present significant growth opportunities, along with innovative applications such as floating solar farms and building-integrated photovoltaics (BIPV). Further advancements in wafer technology, such as the development of next-generation materials and improved manufacturing techniques, could substantially enhance efficiency and reduce costs, creating new market opportunities. The growing adoption of smart grids and energy storage solutions also presents new avenues for growth.
Growth Accelerators in the Solar Photovoltaic Wafer Industry Industry
Technological breakthroughs in wafer manufacturing, including advancements in materials science and process optimization, are key growth catalysts. Strategic partnerships between wafer manufacturers, solar cell producers, and system integrators will accelerate market penetration. Expansion into emerging markets through strategic collaborations and investments will drive long-term growth.
Key Players Shaping the Solar Photovoltaic Wafer Industry Market
- Targray Technology International Inc
- Sino-American Silicon Products Inc
- CETC Solar Energy Holdings Co
- GCL-Poly Energy Holdings Limited
- Renewable Energy Corporation
- Jinko Solar Holding Co Ltd
- JA Solar Holdings Co Ltd
- LONGi Green Energy Technology Co Ltd
Notable Milestones in Solar Photovoltaic Wafer Industry Sector
- June 2023: NexdWafe GmbH secured a USD 32 million contract to build a green solar wafer production facility in Germany.
- June 2023: CubicPV received USD 103 million in equity financing to expand its US silicon wafer production base.
In-Depth Solar Photovoltaic Wafer Industry Market Outlook
The future of the solar PV wafer market is promising, driven by strong growth in renewable energy adoption globally. Continued technological advancements, strategic partnerships, and expansion into emerging markets will unlock significant growth potential. The market is expected to witness a continued increase in demand for high-efficiency monocrystalline wafers, while polycrystalline wafers will remain a cost-effective option. Companies focused on innovation, cost optimization, and sustainable manufacturing practices will be best positioned for success in this dynamic market.
Solar Photovoltaic Wafer Industry Segmentation
-
1. Type
- 1.1. Monocrystalline Wafer
- 1.2. Polycrystalline Wafer
-
2. Geogrpahy
-
2.1. North America
- 2.1.1. United States
- 2.1.2. Canada
- 2.1.3. Rest of North America
-
2.2. Europe
- 2.2.1. Germany
- 2.2.2. France
- 2.2.3. United Kingdom
- 2.2.4. Italy
- 2.2.5. Spain
- 2.2.6. NORDIC
- 2.2.7. Turkey
- 2.2.8. Russia
- 2.2.9. Rest of Europe
-
2.3. Asia-Pacific
- 2.3.1. China
- 2.3.2. India
- 2.3.3. Australia
- 2.3.4. Japan
- 2.3.5. Malaysia
- 2.3.6. Vietnam
- 2.3.7. Thailand
- 2.3.8. Indonesia
- 2.3.9. Rest of Asia-Pacific
-
2.4. South America
- 2.4.1. Brazil
- 2.4.2. Argentina
- 2.4.3. Chile
- 2.4.4. Colombia
- 2.4.5. Rest of South America
-
2.5. Middle-East and Africa
- 2.5.1. United Arab Emirates
- 2.5.2. Saudi Arabia
- 2.5.3. South Africa
- 2.5.4. Qatar
- 2.5.5. Nigeria
- 2.5.6. Egypt
-
2.1. North America
- 3. Market Player Ranking
Solar Photovoltaic Wafer Industry Segmentation By Geography
-
1. North America
- 1.1. United States
- 1.2. Canada
- 1.3. Mexico
-
2. South America
- 2.1. Brazil
- 2.2. Argentina
- 2.3. Rest of South America
-
3. Europe
- 3.1. United Kingdom
- 3.2. Germany
- 3.3. France
- 3.4. Italy
- 3.5. Spain
- 3.6. Russia
- 3.7. Benelux
- 3.8. Nordics
- 3.9. Rest of Europe
-
4. Middle East & Africa
- 4.1. Turkey
- 4.2. Israel
- 4.3. GCC
- 4.4. North Africa
- 4.5. South Africa
- 4.6. Rest of Middle East & Africa
-
5. Asia Pacific
- 5.1. China
- 5.2. India
- 5.3. Japan
- 5.4. South Korea
- 5.5. ASEAN
- 5.6. Oceania
- 5.7. Rest of Asia Pacific
Solar Photovoltaic Wafer Industry REPORT HIGHLIGHTS
| Aspects | Details |
|---|---|
| Study Period | 2019-2033 |
| Base Year | 2024 |
| Estimated Year | 2025 |
| Forecast Period | 2025-2033 |
| Historical Period | 2019-2024 |
| Growth Rate | CAGR of 13.90% from 2019-2033 |
| Segmentation |
|
Table of Contents
- 1. Introduction
- 1.1. Research Scope
- 1.2. Market Segmentation
- 1.3. Research Methodology
- 1.4. Definitions and Assumptions
- 2. Executive Summary
- 2.1. Introduction
- 3. Market Dynamics
- 3.1. Introduction
- 3.2. Market Drivers
- 3.2.1. 4.; Increasing Demand for Renewable Energy4.; Supportive Government Policies
- 3.3. Market Restrains
- 3.3.1. 4.; High Cost Compared to Alternatives like Thin Films
- 3.4. Market Trends
- 3.4.1. Monocrystalline Solar Photovoltaic Wafer is Expected to Dominate the Market
- 4. Market Factor Analysis
- 4.1. Porters Five Forces
- 4.2. Supply/Value Chain
- 4.3. PESTEL analysis
- 4.4. Market Entropy
- 4.5. Patent/Trademark Analysis
- 5. Global Solar Photovoltaic Wafer Industry Analysis, Insights and Forecast, 2019-2031
- 5.1. Market Analysis, Insights and Forecast - by Type
- 5.1.1. Monocrystalline Wafer
- 5.1.2. Polycrystalline Wafer
- 5.2. Market Analysis, Insights and Forecast - by Geogrpahy
- 5.2.1. North America
- 5.2.1.1. United States
- 5.2.1.2. Canada
- 5.2.1.3. Rest of North America
- 5.2.2. Europe
- 5.2.2.1. Germany
- 5.2.2.2. France
- 5.2.2.3. United Kingdom
- 5.2.2.4. Italy
- 5.2.2.5. Spain
- 5.2.2.6. NORDIC
- 5.2.2.7. Turkey
- 5.2.2.8. Russia
- 5.2.2.9. Rest of Europe
- 5.2.3. Asia-Pacific
- 5.2.3.1. China
- 5.2.3.2. India
- 5.2.3.3. Australia
- 5.2.3.4. Japan
- 5.2.3.5. Malaysia
- 5.2.3.6. Vietnam
- 5.2.3.7. Thailand
- 5.2.3.8. Indonesia
- 5.2.3.9. Rest of Asia-Pacific
- 5.2.4. South America
- 5.2.4.1. Brazil
- 5.2.4.2. Argentina
- 5.2.4.3. Chile
- 5.2.4.4. Colombia
- 5.2.4.5. Rest of South America
- 5.2.5. Middle-East and Africa
- 5.2.5.1. United Arab Emirates
- 5.2.5.2. Saudi Arabia
- 5.2.5.3. South Africa
- 5.2.5.4. Qatar
- 5.2.5.5. Nigeria
- 5.2.5.6. Egypt
- 5.2.1. North America
- 5.3. Market Analysis, Insights and Forecast - by Market Player Ranking
- 5.4. Market Analysis, Insights and Forecast - by Region
- 5.4.1. North America
- 5.4.2. South America
- 5.4.3. Europe
- 5.4.4. Middle East & Africa
- 5.4.5. Asia Pacific
- 5.1. Market Analysis, Insights and Forecast - by Type
- 6. North America Solar Photovoltaic Wafer Industry Analysis, Insights and Forecast, 2019-2031
- 6.1. Market Analysis, Insights and Forecast - by Type
- 6.1.1. Monocrystalline Wafer
- 6.1.2. Polycrystalline Wafer
- 6.2. Market Analysis, Insights and Forecast - by Geogrpahy
- 6.2.1. North America
- 6.2.1.1. United States
- 6.2.1.2. Canada
- 6.2.1.3. Rest of North America
- 6.2.2. Europe
- 6.2.2.1. Germany
- 6.2.2.2. France
- 6.2.2.3. United Kingdom
- 6.2.2.4. Italy
- 6.2.2.5. Spain
- 6.2.2.6. NORDIC
- 6.2.2.7. Turkey
- 6.2.2.8. Russia
- 6.2.2.9. Rest of Europe
- 6.2.3. Asia-Pacific
- 6.2.3.1. China
- 6.2.3.2. India
- 6.2.3.3. Australia
- 6.2.3.4. Japan
- 6.2.3.5. Malaysia
- 6.2.3.6. Vietnam
- 6.2.3.7. Thailand
- 6.2.3.8. Indonesia
- 6.2.3.9. Rest of Asia-Pacific
- 6.2.4. South America
- 6.2.4.1. Brazil
- 6.2.4.2. Argentina
- 6.2.4.3. Chile
- 6.2.4.4. Colombia
- 6.2.4.5. Rest of South America
- 6.2.5. Middle-East and Africa
- 6.2.5.1. United Arab Emirates
- 6.2.5.2. Saudi Arabia
- 6.2.5.3. South Africa
- 6.2.5.4. Qatar
- 6.2.5.5. Nigeria
- 6.2.5.6. Egypt
- 6.2.1. North America
- 6.3. Market Analysis, Insights and Forecast - by Market Player Ranking
- 6.1. Market Analysis, Insights and Forecast - by Type
- 7. South America Solar Photovoltaic Wafer Industry Analysis, Insights and Forecast, 2019-2031
- 7.1. Market Analysis, Insights and Forecast - by Type
- 7.1.1. Monocrystalline Wafer
- 7.1.2. Polycrystalline Wafer
- 7.2. Market Analysis, Insights and Forecast - by Geogrpahy
- 7.2.1. North America
- 7.2.1.1. United States
- 7.2.1.2. Canada
- 7.2.1.3. Rest of North America
- 7.2.2. Europe
- 7.2.2.1. Germany
- 7.2.2.2. France
- 7.2.2.3. United Kingdom
- 7.2.2.4. Italy
- 7.2.2.5. Spain
- 7.2.2.6. NORDIC
- 7.2.2.7. Turkey
- 7.2.2.8. Russia
- 7.2.2.9. Rest of Europe
- 7.2.3. Asia-Pacific
- 7.2.3.1. China
- 7.2.3.2. India
- 7.2.3.3. Australia
- 7.2.3.4. Japan
- 7.2.3.5. Malaysia
- 7.2.3.6. Vietnam
- 7.2.3.7. Thailand
- 7.2.3.8. Indonesia
- 7.2.3.9. Rest of Asia-Pacific
- 7.2.4. South America
- 7.2.4.1. Brazil
- 7.2.4.2. Argentina
- 7.2.4.3. Chile
- 7.2.4.4. Colombia
- 7.2.4.5. Rest of South America
- 7.2.5. Middle-East and Africa
- 7.2.5.1. United Arab Emirates
- 7.2.5.2. Saudi Arabia
- 7.2.5.3. South Africa
- 7.2.5.4. Qatar
- 7.2.5.5. Nigeria
- 7.2.5.6. Egypt
- 7.2.1. North America
- 7.3. Market Analysis, Insights and Forecast - by Market Player Ranking
- 7.1. Market Analysis, Insights and Forecast - by Type
- 8. Europe Solar Photovoltaic Wafer Industry Analysis, Insights and Forecast, 2019-2031
- 8.1. Market Analysis, Insights and Forecast - by Type
- 8.1.1. Monocrystalline Wafer
- 8.1.2. Polycrystalline Wafer
- 8.2. Market Analysis, Insights and Forecast - by Geogrpahy
- 8.2.1. North America
- 8.2.1.1. United States
- 8.2.1.2. Canada
- 8.2.1.3. Rest of North America
- 8.2.2. Europe
- 8.2.2.1. Germany
- 8.2.2.2. France
- 8.2.2.3. United Kingdom
- 8.2.2.4. Italy
- 8.2.2.5. Spain
- 8.2.2.6. NORDIC
- 8.2.2.7. Turkey
- 8.2.2.8. Russia
- 8.2.2.9. Rest of Europe
- 8.2.3. Asia-Pacific
- 8.2.3.1. China
- 8.2.3.2. India
- 8.2.3.3. Australia
- 8.2.3.4. Japan
- 8.2.3.5. Malaysia
- 8.2.3.6. Vietnam
- 8.2.3.7. Thailand
- 8.2.3.8. Indonesia
- 8.2.3.9. Rest of Asia-Pacific
- 8.2.4. South America
- 8.2.4.1. Brazil
- 8.2.4.2. Argentina
- 8.2.4.3. Chile
- 8.2.4.4. Colombia
- 8.2.4.5. Rest of South America
- 8.2.5. Middle-East and Africa
- 8.2.5.1. United Arab Emirates
- 8.2.5.2. Saudi Arabia
- 8.2.5.3. South Africa
- 8.2.5.4. Qatar
- 8.2.5.5. Nigeria
- 8.2.5.6. Egypt
- 8.2.1. North America
- 8.3. Market Analysis, Insights and Forecast - by Market Player Ranking
- 8.1. Market Analysis, Insights and Forecast - by Type
- 9. Middle East & Africa Solar Photovoltaic Wafer Industry Analysis, Insights and Forecast, 2019-2031
- 9.1. Market Analysis, Insights and Forecast - by Type
- 9.1.1. Monocrystalline Wafer
- 9.1.2. Polycrystalline Wafer
- 9.2. Market Analysis, Insights and Forecast - by Geogrpahy
- 9.2.1. North America
- 9.2.1.1. United States
- 9.2.1.2. Canada
- 9.2.1.3. Rest of North America
- 9.2.2. Europe
- 9.2.2.1. Germany
- 9.2.2.2. France
- 9.2.2.3. United Kingdom
- 9.2.2.4. Italy
- 9.2.2.5. Spain
- 9.2.2.6. NORDIC
- 9.2.2.7. Turkey
- 9.2.2.8. Russia
- 9.2.2.9. Rest of Europe
- 9.2.3. Asia-Pacific
- 9.2.3.1. China
- 9.2.3.2. India
- 9.2.3.3. Australia
- 9.2.3.4. Japan
- 9.2.3.5. Malaysia
- 9.2.3.6. Vietnam
- 9.2.3.7. Thailand
- 9.2.3.8. Indonesia
- 9.2.3.9. Rest of Asia-Pacific
- 9.2.4. South America
- 9.2.4.1. Brazil
- 9.2.4.2. Argentina
- 9.2.4.3. Chile
- 9.2.4.4. Colombia
- 9.2.4.5. Rest of South America
- 9.2.5. Middle-East and Africa
- 9.2.5.1. United Arab Emirates
- 9.2.5.2. Saudi Arabia
- 9.2.5.3. South Africa
- 9.2.5.4. Qatar
- 9.2.5.5. Nigeria
- 9.2.5.6. Egypt
- 9.2.1. North America
- 9.3. Market Analysis, Insights and Forecast - by Market Player Ranking
- 9.1. Market Analysis, Insights and Forecast - by Type
- 10. Asia Pacific Solar Photovoltaic Wafer Industry Analysis, Insights and Forecast, 2019-2031
- 10.1. Market Analysis, Insights and Forecast - by Type
- 10.1.1. Monocrystalline Wafer
- 10.1.2. Polycrystalline Wafer
- 10.2. Market Analysis, Insights and Forecast - by Geogrpahy
- 10.2.1. North America
- 10.2.1.1. United States
- 10.2.1.2. Canada
- 10.2.1.3. Rest of North America
- 10.2.2. Europe
- 10.2.2.1. Germany
- 10.2.2.2. France
- 10.2.2.3. United Kingdom
- 10.2.2.4. Italy
- 10.2.2.5. Spain
- 10.2.2.6. NORDIC
- 10.2.2.7. Turkey
- 10.2.2.8. Russia
- 10.2.2.9. Rest of Europe
- 10.2.3. Asia-Pacific
- 10.2.3.1. China
- 10.2.3.2. India
- 10.2.3.3. Australia
- 10.2.3.4. Japan
- 10.2.3.5. Malaysia
- 10.2.3.6. Vietnam
- 10.2.3.7. Thailand
- 10.2.3.8. Indonesia
- 10.2.3.9. Rest of Asia-Pacific
- 10.2.4. South America
- 10.2.4.1. Brazil
- 10.2.4.2. Argentina
- 10.2.4.3. Chile
- 10.2.4.4. Colombia
- 10.2.4.5. Rest of South America
- 10.2.5. Middle-East and Africa
- 10.2.5.1. United Arab Emirates
- 10.2.5.2. Saudi Arabia
- 10.2.5.3. South Africa
- 10.2.5.4. Qatar
- 10.2.5.5. Nigeria
- 10.2.5.6. Egypt
- 10.2.1. North America
- 10.3. Market Analysis, Insights and Forecast - by Market Player Ranking
- 10.1. Market Analysis, Insights and Forecast - by Type
- 11. North America Solar Photovoltaic Wafer Industry Analysis, Insights and Forecast, 2019-2031
- 11.1. Market Analysis, Insights and Forecast - By Country/Sub-region
- 11.1.1 United States
- 11.1.2 Canada
- 11.1.3 Mexico
- 12. Europe Solar Photovoltaic Wafer Industry Analysis, Insights and Forecast, 2019-2031
- 12.1. Market Analysis, Insights and Forecast - By Country/Sub-region
- 12.1.1 Germany
- 12.1.2 United Kingdom
- 12.1.3 France
- 12.1.4 Spain
- 12.1.5 Italy
- 12.1.6 Spain
- 12.1.7 Belgium
- 12.1.8 Netherland
- 12.1.9 Nordics
- 12.1.10 Rest of Europe
- 13. Asia Pacific Solar Photovoltaic Wafer Industry Analysis, Insights and Forecast, 2019-2031
- 13.1. Market Analysis, Insights and Forecast - By Country/Sub-region
- 13.1.1 China
- 13.1.2 Japan
- 13.1.3 India
- 13.1.4 South Korea
- 13.1.5 Southeast Asia
- 13.1.6 Australia
- 13.1.7 Indonesia
- 13.1.8 Phillipes
- 13.1.9 Singapore
- 13.1.10 Thailandc
- 13.1.11 Rest of Asia Pacific
- 14. South America Solar Photovoltaic Wafer Industry Analysis, Insights and Forecast, 2019-2031
- 14.1. Market Analysis, Insights and Forecast - By Country/Sub-region
- 14.1.1 Brazil
- 14.1.2 Argentina
- 14.1.3 Peru
- 14.1.4 Chile
- 14.1.5 Colombia
- 14.1.6 Ecuador
- 14.1.7 Venezuela
- 14.1.8 Rest of South America
- 15. MEA Solar Photovoltaic Wafer Industry Analysis, Insights and Forecast, 2019-2031
- 15.1. Market Analysis, Insights and Forecast - By Country/Sub-region
- 15.1.1 United Arab Emirates
- 15.1.2 Saudi Arabia
- 15.1.3 South Africa
- 15.1.4 Rest of Middle East and Africa
- 16. Competitive Analysis
- 16.1. Global Market Share Analysis 2024
- 16.2. Company Profiles
- 16.2.1 Targray Technology International Inc
- 16.2.1.1. Overview
- 16.2.1.2. Products
- 16.2.1.3. SWOT Analysis
- 16.2.1.4. Recent Developments
- 16.2.1.5. Financials (Based on Availability)
- 16.2.2 Sino-American Silicon Products Inc
- 16.2.2.1. Overview
- 16.2.2.2. Products
- 16.2.2.3. SWOT Analysis
- 16.2.2.4. Recent Developments
- 16.2.2.5. Financials (Based on Availability)
- 16.2.3 CETC Solar Energy Holdings Co
- 16.2.3.1. Overview
- 16.2.3.2. Products
- 16.2.3.3. SWOT Analysis
- 16.2.3.4. Recent Developments
- 16.2.3.5. Financials (Based on Availability)
- 16.2.4 GCL-Poly Energy Holdings Limited
- 16.2.4.1. Overview
- 16.2.4.2. Products
- 16.2.4.3. SWOT Analysis
- 16.2.4.4. Recent Developments
- 16.2.4.5. Financials (Based on Availability)
- 16.2.5 Renewable Energy Corporation
- 16.2.5.1. Overview
- 16.2.5.2. Products
- 16.2.5.3. SWOT Analysis
- 16.2.5.4. Recent Developments
- 16.2.5.5. Financials (Based on Availability)
- 16.2.6 Jinko Solar Holding Co Ltd
- 16.2.6.1. Overview
- 16.2.6.2. Products
- 16.2.6.3. SWOT Analysis
- 16.2.6.4. Recent Developments
- 16.2.6.5. Financials (Based on Availability)
- 16.2.7 JA Solar Holdings Co Ltd
- 16.2.7.1. Overview
- 16.2.7.2. Products
- 16.2.7.3. SWOT Analysis
- 16.2.7.4. Recent Developments
- 16.2.7.5. Financials (Based on Availability)
- 16.2.8 LONGi Green Energy Technology Co Ltd
- 16.2.8.1. Overview
- 16.2.8.2. Products
- 16.2.8.3. SWOT Analysis
- 16.2.8.4. Recent Developments
- 16.2.8.5. Financials (Based on Availability)
- 16.2.1 Targray Technology International Inc
List of Figures
- Figure 1: Global Solar Photovoltaic Wafer Industry Revenue Breakdown (Million, %) by Region 2024 & 2032
- Figure 2: North America Solar Photovoltaic Wafer Industry Revenue (Million), by Country 2024 & 2032
- Figure 3: North America Solar Photovoltaic Wafer Industry Revenue Share (%), by Country 2024 & 2032
- Figure 4: Europe Solar Photovoltaic Wafer Industry Revenue (Million), by Country 2024 & 2032
- Figure 5: Europe Solar Photovoltaic Wafer Industry Revenue Share (%), by Country 2024 & 2032
- Figure 6: Asia Pacific Solar Photovoltaic Wafer Industry Revenue (Million), by Country 2024 & 2032
- Figure 7: Asia Pacific Solar Photovoltaic Wafer Industry Revenue Share (%), by Country 2024 & 2032
- Figure 8: South America Solar Photovoltaic Wafer Industry Revenue (Million), by Country 2024 & 2032
- Figure 9: South America Solar Photovoltaic Wafer Industry Revenue Share (%), by Country 2024 & 2032
- Figure 10: MEA Solar Photovoltaic Wafer Industry Revenue (Million), by Country 2024 & 2032
- Figure 11: MEA Solar Photovoltaic Wafer Industry Revenue Share (%), by Country 2024 & 2032
- Figure 12: North America Solar Photovoltaic Wafer Industry Revenue (Million), by Type 2024 & 2032
- Figure 13: North America Solar Photovoltaic Wafer Industry Revenue Share (%), by Type 2024 & 2032
- Figure 14: North America Solar Photovoltaic Wafer Industry Revenue (Million), by Geogrpahy 2024 & 2032
- Figure 15: North America Solar Photovoltaic Wafer Industry Revenue Share (%), by Geogrpahy 2024 & 2032
- Figure 16: North America Solar Photovoltaic Wafer Industry Revenue (Million), by Market Player Ranking 2024 & 2032
- Figure 17: North America Solar Photovoltaic Wafer Industry Revenue Share (%), by Market Player Ranking 2024 & 2032
- Figure 18: North America Solar Photovoltaic Wafer Industry Revenue (Million), by Country 2024 & 2032
- Figure 19: North America Solar Photovoltaic Wafer Industry Revenue Share (%), by Country 2024 & 2032
- Figure 20: South America Solar Photovoltaic Wafer Industry Revenue (Million), by Type 2024 & 2032
- Figure 21: South America Solar Photovoltaic Wafer Industry Revenue Share (%), by Type 2024 & 2032
- Figure 22: South America Solar Photovoltaic Wafer Industry Revenue (Million), by Geogrpahy 2024 & 2032
- Figure 23: South America Solar Photovoltaic Wafer Industry Revenue Share (%), by Geogrpahy 2024 & 2032
- Figure 24: South America Solar Photovoltaic Wafer Industry Revenue (Million), by Market Player Ranking 2024 & 2032
- Figure 25: South America Solar Photovoltaic Wafer Industry Revenue Share (%), by Market Player Ranking 2024 & 2032
- Figure 26: South America Solar Photovoltaic Wafer Industry Revenue (Million), by Country 2024 & 2032
- Figure 27: South America Solar Photovoltaic Wafer Industry Revenue Share (%), by Country 2024 & 2032
- Figure 28: Europe Solar Photovoltaic Wafer Industry Revenue (Million), by Type 2024 & 2032
- Figure 29: Europe Solar Photovoltaic Wafer Industry Revenue Share (%), by Type 2024 & 2032
- Figure 30: Europe Solar Photovoltaic Wafer Industry Revenue (Million), by Geogrpahy 2024 & 2032
- Figure 31: Europe Solar Photovoltaic Wafer Industry Revenue Share (%), by Geogrpahy 2024 & 2032
- Figure 32: Europe Solar Photovoltaic Wafer Industry Revenue (Million), by Market Player Ranking 2024 & 2032
- Figure 33: Europe Solar Photovoltaic Wafer Industry Revenue Share (%), by Market Player Ranking 2024 & 2032
- Figure 34: Europe Solar Photovoltaic Wafer Industry Revenue (Million), by Country 2024 & 2032
- Figure 35: Europe Solar Photovoltaic Wafer Industry Revenue Share (%), by Country 2024 & 2032
- Figure 36: Middle East & Africa Solar Photovoltaic Wafer Industry Revenue (Million), by Type 2024 & 2032
- Figure 37: Middle East & Africa Solar Photovoltaic Wafer Industry Revenue Share (%), by Type 2024 & 2032
- Figure 38: Middle East & Africa Solar Photovoltaic Wafer Industry Revenue (Million), by Geogrpahy 2024 & 2032
- Figure 39: Middle East & Africa Solar Photovoltaic Wafer Industry Revenue Share (%), by Geogrpahy 2024 & 2032
- Figure 40: Middle East & Africa Solar Photovoltaic Wafer Industry Revenue (Million), by Market Player Ranking 2024 & 2032
- Figure 41: Middle East & Africa Solar Photovoltaic Wafer Industry Revenue Share (%), by Market Player Ranking 2024 & 2032
- Figure 42: Middle East & Africa Solar Photovoltaic Wafer Industry Revenue (Million), by Country 2024 & 2032
- Figure 43: Middle East & Africa Solar Photovoltaic Wafer Industry Revenue Share (%), by Country 2024 & 2032
- Figure 44: Asia Pacific Solar Photovoltaic Wafer Industry Revenue (Million), by Type 2024 & 2032
- Figure 45: Asia Pacific Solar Photovoltaic Wafer Industry Revenue Share (%), by Type 2024 & 2032
- Figure 46: Asia Pacific Solar Photovoltaic Wafer Industry Revenue (Million), by Geogrpahy 2024 & 2032
- Figure 47: Asia Pacific Solar Photovoltaic Wafer Industry Revenue Share (%), by Geogrpahy 2024 & 2032
- Figure 48: Asia Pacific Solar Photovoltaic Wafer Industry Revenue (Million), by Market Player Ranking 2024 & 2032
- Figure 49: Asia Pacific Solar Photovoltaic Wafer Industry Revenue Share (%), by Market Player Ranking 2024 & 2032
- Figure 50: Asia Pacific Solar Photovoltaic Wafer Industry Revenue (Million), by Country 2024 & 2032
- Figure 51: Asia Pacific Solar Photovoltaic Wafer Industry Revenue Share (%), by Country 2024 & 2032
List of Tables
- Table 1: Global Solar Photovoltaic Wafer Industry Revenue Million Forecast, by Region 2019 & 2032
- Table 2: Global Solar Photovoltaic Wafer Industry Revenue Million Forecast, by Type 2019 & 2032
- Table 3: Global Solar Photovoltaic Wafer Industry Revenue Million Forecast, by Geogrpahy 2019 & 2032
- Table 4: Global Solar Photovoltaic Wafer Industry Revenue Million Forecast, by Market Player Ranking 2019 & 2032
- Table 5: Global Solar Photovoltaic Wafer Industry Revenue Million Forecast, by Region 2019 & 2032
- Table 6: Global Solar Photovoltaic Wafer Industry Revenue Million Forecast, by Country 2019 & 2032
- Table 7: United States Solar Photovoltaic Wafer Industry Revenue (Million) Forecast, by Application 2019 & 2032
- Table 8: Canada Solar Photovoltaic Wafer Industry Revenue (Million) Forecast, by Application 2019 & 2032
- Table 9: Mexico Solar Photovoltaic Wafer Industry Revenue (Million) Forecast, by Application 2019 & 2032
- Table 10: Global Solar Photovoltaic Wafer Industry Revenue Million Forecast, by Country 2019 & 2032
- Table 11: Germany Solar Photovoltaic Wafer Industry Revenue (Million) Forecast, by Application 2019 & 2032
- Table 12: United Kingdom Solar Photovoltaic Wafer Industry Revenue (Million) Forecast, by Application 2019 & 2032
- Table 13: France Solar Photovoltaic Wafer Industry Revenue (Million) Forecast, by Application 2019 & 2032
- Table 14: Spain Solar Photovoltaic Wafer Industry Revenue (Million) Forecast, by Application 2019 & 2032
- Table 15: Italy Solar Photovoltaic Wafer Industry Revenue (Million) Forecast, by Application 2019 & 2032
- Table 16: Spain Solar Photovoltaic Wafer Industry Revenue (Million) Forecast, by Application 2019 & 2032
- Table 17: Belgium Solar Photovoltaic Wafer Industry Revenue (Million) Forecast, by Application 2019 & 2032
- Table 18: Netherland Solar Photovoltaic Wafer Industry Revenue (Million) Forecast, by Application 2019 & 2032
- Table 19: Nordics Solar Photovoltaic Wafer Industry Revenue (Million) Forecast, by Application 2019 & 2032
- Table 20: Rest of Europe Solar Photovoltaic Wafer Industry Revenue (Million) Forecast, by Application 2019 & 2032
- Table 21: Global Solar Photovoltaic Wafer Industry Revenue Million Forecast, by Country 2019 & 2032
- Table 22: China Solar Photovoltaic Wafer Industry Revenue (Million) Forecast, by Application 2019 & 2032
- Table 23: Japan Solar Photovoltaic Wafer Industry Revenue (Million) Forecast, by Application 2019 & 2032
- Table 24: India Solar Photovoltaic Wafer Industry Revenue (Million) Forecast, by Application 2019 & 2032
- Table 25: South Korea Solar Photovoltaic Wafer Industry Revenue (Million) Forecast, by Application 2019 & 2032
- Table 26: Southeast Asia Solar Photovoltaic Wafer Industry Revenue (Million) Forecast, by Application 2019 & 2032
- Table 27: Australia Solar Photovoltaic Wafer Industry Revenue (Million) Forecast, by Application 2019 & 2032
- Table 28: Indonesia Solar Photovoltaic Wafer Industry Revenue (Million) Forecast, by Application 2019 & 2032
- Table 29: Phillipes Solar Photovoltaic Wafer Industry Revenue (Million) Forecast, by Application 2019 & 2032
- Table 30: Singapore Solar Photovoltaic Wafer Industry Revenue (Million) Forecast, by Application 2019 & 2032
- Table 31: Thailandc Solar Photovoltaic Wafer Industry Revenue (Million) Forecast, by Application 2019 & 2032
- Table 32: Rest of Asia Pacific Solar Photovoltaic Wafer Industry Revenue (Million) Forecast, by Application 2019 & 2032
- Table 33: Global Solar Photovoltaic Wafer Industry Revenue Million Forecast, by Country 2019 & 2032
- Table 34: Brazil Solar Photovoltaic Wafer Industry Revenue (Million) Forecast, by Application 2019 & 2032
- Table 35: Argentina Solar Photovoltaic Wafer Industry Revenue (Million) Forecast, by Application 2019 & 2032
- Table 36: Peru Solar Photovoltaic Wafer Industry Revenue (Million) Forecast, by Application 2019 & 2032
- Table 37: Chile Solar Photovoltaic Wafer Industry Revenue (Million) Forecast, by Application 2019 & 2032
- Table 38: Colombia Solar Photovoltaic Wafer Industry Revenue (Million) Forecast, by Application 2019 & 2032
- Table 39: Ecuador Solar Photovoltaic Wafer Industry Revenue (Million) Forecast, by Application 2019 & 2032
- Table 40: Venezuela Solar Photovoltaic Wafer Industry Revenue (Million) Forecast, by Application 2019 & 2032
- Table 41: Rest of South America Solar Photovoltaic Wafer Industry Revenue (Million) Forecast, by Application 2019 & 2032
- Table 42: Global Solar Photovoltaic Wafer Industry Revenue Million Forecast, by Country 2019 & 2032
- Table 43: United Arab Emirates Solar Photovoltaic Wafer Industry Revenue (Million) Forecast, by Application 2019 & 2032
- Table 44: Saudi Arabia Solar Photovoltaic Wafer Industry Revenue (Million) Forecast, by Application 2019 & 2032
- Table 45: South Africa Solar Photovoltaic Wafer Industry Revenue (Million) Forecast, by Application 2019 & 2032
- Table 46: Rest of Middle East and Africa Solar Photovoltaic Wafer Industry Revenue (Million) Forecast, by Application 2019 & 2032
- Table 47: Global Solar Photovoltaic Wafer Industry Revenue Million Forecast, by Type 2019 & 2032
- Table 48: Global Solar Photovoltaic Wafer Industry Revenue Million Forecast, by Geogrpahy 2019 & 2032
- Table 49: Global Solar Photovoltaic Wafer Industry Revenue Million Forecast, by Market Player Ranking 2019 & 2032
- Table 50: Global Solar Photovoltaic Wafer Industry Revenue Million Forecast, by Country 2019 & 2032
- Table 51: United States Solar Photovoltaic Wafer Industry Revenue (Million) Forecast, by Application 2019 & 2032
- Table 52: Canada Solar Photovoltaic Wafer Industry Revenue (Million) Forecast, by Application 2019 & 2032
- Table 53: Mexico Solar Photovoltaic Wafer Industry Revenue (Million) Forecast, by Application 2019 & 2032
- Table 54: Global Solar Photovoltaic Wafer Industry Revenue Million Forecast, by Type 2019 & 2032
- Table 55: Global Solar Photovoltaic Wafer Industry Revenue Million Forecast, by Geogrpahy 2019 & 2032
- Table 56: Global Solar Photovoltaic Wafer Industry Revenue Million Forecast, by Market Player Ranking 2019 & 2032
- Table 57: Global Solar Photovoltaic Wafer Industry Revenue Million Forecast, by Country 2019 & 2032
- Table 58: Brazil Solar Photovoltaic Wafer Industry Revenue (Million) Forecast, by Application 2019 & 2032
- Table 59: Argentina Solar Photovoltaic Wafer Industry Revenue (Million) Forecast, by Application 2019 & 2032
- Table 60: Rest of South America Solar Photovoltaic Wafer Industry Revenue (Million) Forecast, by Application 2019 & 2032
- Table 61: Global Solar Photovoltaic Wafer Industry Revenue Million Forecast, by Type 2019 & 2032
- Table 62: Global Solar Photovoltaic Wafer Industry Revenue Million Forecast, by Geogrpahy 2019 & 2032
- Table 63: Global Solar Photovoltaic Wafer Industry Revenue Million Forecast, by Market Player Ranking 2019 & 2032
- Table 64: Global Solar Photovoltaic Wafer Industry Revenue Million Forecast, by Country 2019 & 2032
- Table 65: United Kingdom Solar Photovoltaic Wafer Industry Revenue (Million) Forecast, by Application 2019 & 2032
- Table 66: Germany Solar Photovoltaic Wafer Industry Revenue (Million) Forecast, by Application 2019 & 2032
- Table 67: France Solar Photovoltaic Wafer Industry Revenue (Million) Forecast, by Application 2019 & 2032
- Table 68: Italy Solar Photovoltaic Wafer Industry Revenue (Million) Forecast, by Application 2019 & 2032
- Table 69: Spain Solar Photovoltaic Wafer Industry Revenue (Million) Forecast, by Application 2019 & 2032
- Table 70: Russia Solar Photovoltaic Wafer Industry Revenue (Million) Forecast, by Application 2019 & 2032
- Table 71: Benelux Solar Photovoltaic Wafer Industry Revenue (Million) Forecast, by Application 2019 & 2032
- Table 72: Nordics Solar Photovoltaic Wafer Industry Revenue (Million) Forecast, by Application 2019 & 2032
- Table 73: Rest of Europe Solar Photovoltaic Wafer Industry Revenue (Million) Forecast, by Application 2019 & 2032
- Table 74: Global Solar Photovoltaic Wafer Industry Revenue Million Forecast, by Type 2019 & 2032
- Table 75: Global Solar Photovoltaic Wafer Industry Revenue Million Forecast, by Geogrpahy 2019 & 2032
- Table 76: Global Solar Photovoltaic Wafer Industry Revenue Million Forecast, by Market Player Ranking 2019 & 2032
- Table 77: Global Solar Photovoltaic Wafer Industry Revenue Million Forecast, by Country 2019 & 2032
- Table 78: Turkey Solar Photovoltaic Wafer Industry Revenue (Million) Forecast, by Application 2019 & 2032
- Table 79: Israel Solar Photovoltaic Wafer Industry Revenue (Million) Forecast, by Application 2019 & 2032
- Table 80: GCC Solar Photovoltaic Wafer Industry Revenue (Million) Forecast, by Application 2019 & 2032
- Table 81: North Africa Solar Photovoltaic Wafer Industry Revenue (Million) Forecast, by Application 2019 & 2032
- Table 82: South Africa Solar Photovoltaic Wafer Industry Revenue (Million) Forecast, by Application 2019 & 2032
- Table 83: Rest of Middle East & Africa Solar Photovoltaic Wafer Industry Revenue (Million) Forecast, by Application 2019 & 2032
- Table 84: Global Solar Photovoltaic Wafer Industry Revenue Million Forecast, by Type 2019 & 2032
- Table 85: Global Solar Photovoltaic Wafer Industry Revenue Million Forecast, by Geogrpahy 2019 & 2032
- Table 86: Global Solar Photovoltaic Wafer Industry Revenue Million Forecast, by Market Player Ranking 2019 & 2032
- Table 87: Global Solar Photovoltaic Wafer Industry Revenue Million Forecast, by Country 2019 & 2032
- Table 88: China Solar Photovoltaic Wafer Industry Revenue (Million) Forecast, by Application 2019 & 2032
- Table 89: India Solar Photovoltaic Wafer Industry Revenue (Million) Forecast, by Application 2019 & 2032
- Table 90: Japan Solar Photovoltaic Wafer Industry Revenue (Million) Forecast, by Application 2019 & 2032
- Table 91: South Korea Solar Photovoltaic Wafer Industry Revenue (Million) Forecast, by Application 2019 & 2032
- Table 92: ASEAN Solar Photovoltaic Wafer Industry Revenue (Million) Forecast, by Application 2019 & 2032
- Table 93: Oceania Solar Photovoltaic Wafer Industry Revenue (Million) Forecast, by Application 2019 & 2032
- Table 94: Rest of Asia Pacific Solar Photovoltaic Wafer Industry Revenue (Million) Forecast, by Application 2019 & 2032
Frequently Asked Questions
1. What is the projected Compound Annual Growth Rate (CAGR) of the Solar Photovoltaic Wafer Industry?
The projected CAGR is approximately 13.90%.
2. Which companies are prominent players in the Solar Photovoltaic Wafer Industry?
Key companies in the market include Targray Technology International Inc, Sino-American Silicon Products Inc, CETC Solar Energy Holdings Co, GCL-Poly Energy Holdings Limited, Renewable Energy Corporation, Jinko Solar Holding Co Ltd, JA Solar Holdings Co Ltd, LONGi Green Energy Technology Co Ltd.
3. What are the main segments of the Solar Photovoltaic Wafer Industry?
The market segments include Type, Geogrpahy, Market Player Ranking.
4. Can you provide details about the market size?
The market size is estimated to be USD 14.58 Million as of 2022.
5. What are some drivers contributing to market growth?
4.; Increasing Demand for Renewable Energy4.; Supportive Government Policies.
6. What are the notable trends driving market growth?
Monocrystalline Solar Photovoltaic Wafer is Expected to Dominate the Market.
7. Are there any restraints impacting market growth?
4.; High Cost Compared to Alternatives like Thin Films.
8. Can you provide examples of recent developments in the market?
In June 2023, Solar Wafer manufacturer NexdWafe GmbH secured USD 32 million contract from a group of investors including Reliance New Energy to accelerate the construction of its first commercial scla green solar wafers production facility in Germany Bitterfield.
9. What pricing options are available for accessing the report?
Pricing options include single-user, multi-user, and enterprise licenses priced at USD 4750, USD 5250, and USD 8750 respectively.
10. Is the market size provided in terms of value or volume?
The market size is provided in terms of value, measured in Million.
11. Are there any specific market keywords associated with the report?
Yes, the market keyword associated with the report is "Solar Photovoltaic Wafer Industry," which aids in identifying and referencing the specific market segment covered.
12. How do I determine which pricing option suits my needs best?
The pricing options vary based on user requirements and access needs. Individual users may opt for single-user licenses, while businesses requiring broader access may choose multi-user or enterprise licenses for cost-effective access to the report.
13. Are there any additional resources or data provided in the Solar Photovoltaic Wafer Industry report?
While the report offers comprehensive insights, it's advisable to review the specific contents or supplementary materials provided to ascertain if additional resources or data are available.
14. How can I stay updated on further developments or reports in the Solar Photovoltaic Wafer Industry?
To stay informed about further developments, trends, and reports in the Solar Photovoltaic Wafer Industry, consider subscribing to industry newsletters, following relevant companies and organizations, or regularly checking reputable industry news sources and publications.
Methodology
Step 1 - Identification of Relevant Samples Size from Population Database


Step 2 - Approaches for Defining Global Market Size (Value, Volume* & Price*)

Note*: In applicable scenarios
Step 3 - Data Sources
Primary Research
- Web Analytics
- Survey Reports
- Research Institute
- Latest Research Reports
- Opinion Leaders
Secondary Research
- Annual Reports
- White Paper
- Latest Press Release
- Industry Association
- Paid Database
- Investor Presentations

Step 4 - Data Triangulation
Involves using different sources of information in order to increase the validity of a study
These sources are likely to be stakeholders in a program - participants, other researchers, program staff, other community members, and so on.
Then we put all data in single framework & apply various statistical tools to find out the dynamic on the market.
During the analysis stage, feedback from the stakeholder groups would be compared to determine areas of agreement as well as areas of divergence


