
Key Insights
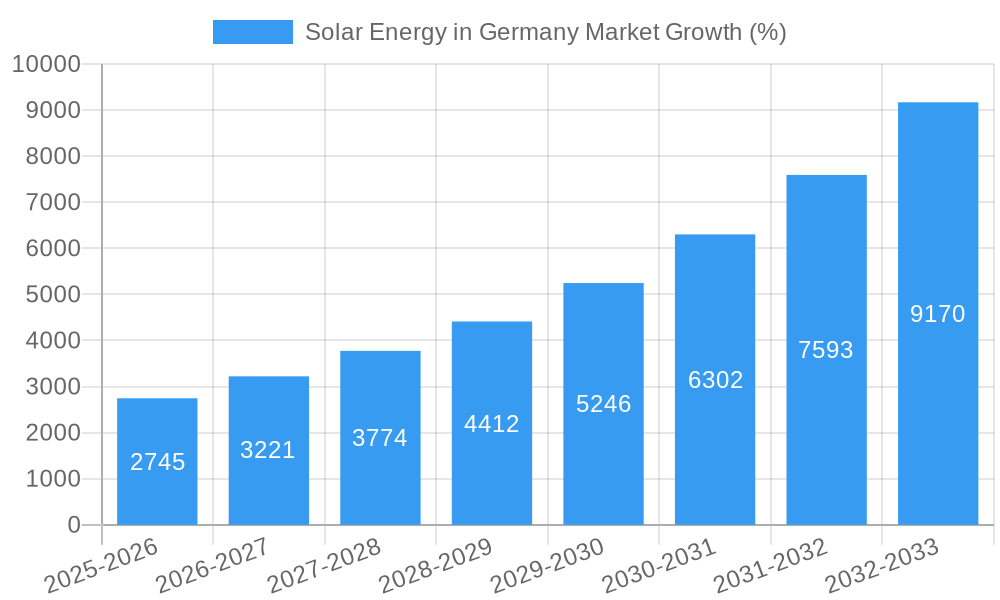
The German solar energy market, a significant contributor to the nation's renewable energy transition, is experiencing robust growth. Driven by ambitious government targets for renewable energy integration, supportive policies like feed-in tariffs and the increasing affordability of solar photovoltaic (PV) systems, the market is projected to maintain a strong Compound Annual Growth Rate (CAGR) of 18.30% from 2025 to 2033. This expansion is fueled primarily by the burgeoning demand for solar power across various sectors. The utility-scale segment remains dominant, accounting for a significant portion of the market share, but the residential and commercial & industrial sectors are witnessing substantial growth as awareness and affordability improve. Leading players such as Vattenfall AB, BayWa r.e. AG, and IBC SOLAR AG are actively shaping the market landscape through technological innovations, strategic partnerships, and project development. Germany's decentralized energy structure, with a focus on distributed generation, further enhances the attractiveness of solar PV installations, particularly in states like North Rhine-Westphalia, Bavaria, and Baden-Württemberg, which benefit from high solar irradiance. While constraints such as land availability and grid infrastructure limitations may present challenges, continuous technological advancements and government initiatives aimed at grid modernization are mitigating these factors. The integration of energy storage solutions is also a key trend, enhancing grid stability and increasing the value proposition of solar energy systems. Concentrated Solar Power (CSP) technologies, although currently a smaller segment, hold promising potential for future expansion, particularly in leveraging Germany's advancements in energy storage.
The forecast for the German solar energy market indicates substantial expansion across all application segments. The consistent CAGR suggests the market will more than double in size within the forecast period. The strong presence of established international and domestic companies ensures a competitive market, driving down costs and fostering innovation. The focus on sustainability and climate change mitigation, coupled with government support for renewable energy sources, creates a positive outlook for continued growth and market penetration within Germany. Challenges remain, but the overall trend points towards a continuously expanding and increasingly influential solar energy sector within the German energy landscape. By 2033, the market size is likely to reach a value significantly exceeding the 2025 estimation based on this high CAGR.
Solar Energy in Germany Market: A Comprehensive Report (2019-2033)
This comprehensive report provides an in-depth analysis of the German solar energy market, encompassing market dynamics, growth trends, regional analysis, product landscape, key players, and future outlook. The report covers the period from 2019 to 2033, with a focus on the base year 2025 and a forecast period extending to 2033. This analysis delves into both parent market (Renewable Energy) and child markets (Solar Photovoltaic, Concentrated Solar Power) within the German context, providing invaluable insights for industry professionals, investors, and policymakers. The market is valued in Million units.
Solar Energy in Germany Market Dynamics & Structure
The German solar energy market is characterized by a dynamic interplay of technological advancements, supportive regulatory frameworks, and intense competition. Market concentration is moderate, with several large players like Vattenfall AB and BayWa re AG holding significant shares, alongside numerous smaller, specialized companies. Technological innovation, driven by efficiency improvements in solar PV and CSP technologies, is a key driver. The regulatory landscape, including feed-in tariffs and renewable energy targets, significantly influences market growth. While the market faces competition from other renewable energy sources (wind, hydro), the increasing cost-competitiveness of solar is driving its expansion. Mergers and acquisitions (M&A) activity remains active, particularly among smaller companies seeking scale and access to new technologies.
- Market Concentration: Moderate, with top 5 players holding approximately xx% market share (2025).
- Technological Innovation: Significant advancements in PV efficiency (xx% increase since 2019) and CSP technology are driving costs down and boosting adoption.
- Regulatory Framework: Supportive policies, including renewable energy targets and feed-in tariffs, are key growth drivers.
- Competitive Substitutes: Wind energy, hydroelectricity, and biomass are major competitors.
- End-User Demographics: Primarily utilities, commercial and industrial sectors, and residential consumers.
- M&A Trends: xx M&A deals in the solar sector recorded from 2019 to 2024, with an expected xx deals in the forecast period.
Solar Energy in Germany Market Growth Trends & Insights
The German solar energy market has experienced substantial growth over the past years, driven by increasing electricity demand, ambitious renewable energy targets, and decreasing solar energy costs. The market size expanded from xx Million units in 2019 to xx Million units in 2024, demonstrating a Compound Annual Growth Rate (CAGR) of xx%. This growth is expected to continue throughout the forecast period (2025-2033), with a projected CAGR of xx%, reaching xx Million units by 2033. Market penetration is increasing steadily, with solar PV technology dominating the market. Technological disruptions, such as advancements in energy storage solutions and smart grid technologies, are accelerating market adoption. Consumer behavior is shifting towards environmentally friendly energy sources, further fueling the growth of the solar energy sector.
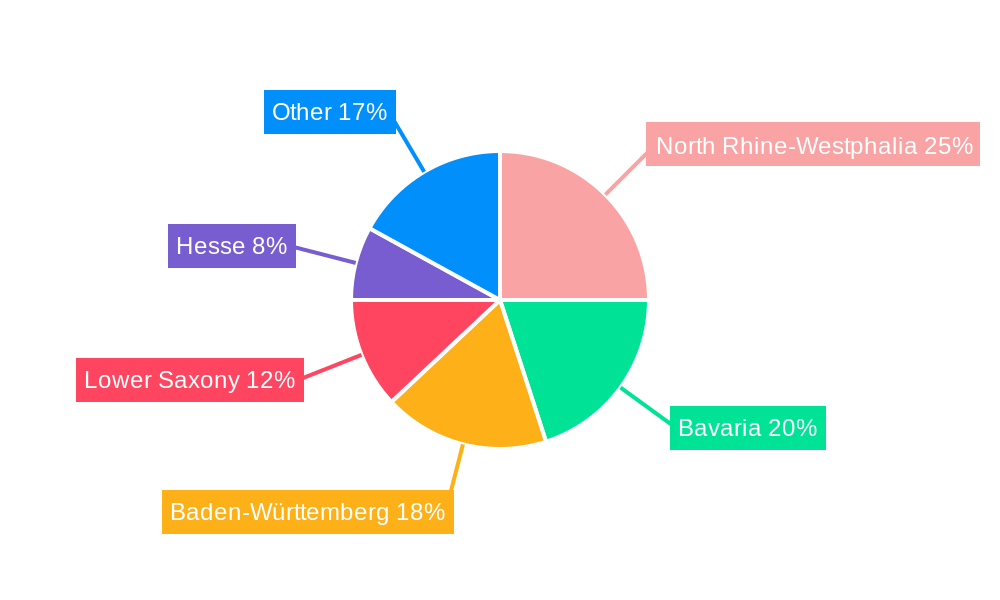
Dominant Regions, Countries, or Segments in Solar Energy in Germany Market
Within Germany, the solar energy market exhibits regional variations in growth and adoption rates. Southern Germany, with its higher solar irradiance, leads in solar energy deployment. However, other regions are witnessing significant growth due to government incentives and supportive policies. By application, the utility-scale sector dominates the market, followed by commercial and industrial segments. The residential sector, although growing, lags behind due to higher upfront costs and technical complexities.
- Leading Region: Southern Germany (xx% market share in 2025).
- Dominant Segment (By Type): Solar Photovoltaic (xx% market share in 2025), benefiting from continuous technological advancements and decreasing costs.
- Dominant Segment (By Application): Utility-scale projects (xx% market share in 2025) due to economies of scale and government support.
- Key Drivers: Government subsidies, favorable policies, and decreasing technology costs.
Solar Energy in Germany Market Product Landscape
The German solar energy market showcases a diverse product landscape, featuring high-efficiency solar PV modules, advanced solar trackers, and innovative energy storage solutions. The industry emphasizes high-performance modules with increased efficiency and durability, along with integrated monitoring systems and smart grid compatibility. Technological advancements focus on improving energy conversion efficiency, reducing production costs, and enhancing system reliability. New materials and manufacturing processes are contributing to the development of more cost-effective and sustainable products.
Key Drivers, Barriers & Challenges in Solar Energy in Germany Market
Key Drivers:
- Government Policies: Feed-in tariffs and renewable energy targets stimulate market growth.
- Decreasing Costs: Technological advancements have significantly reduced the cost of solar energy systems.
- Environmental Concerns: Growing awareness of climate change is driving adoption of renewable energy sources.
Key Challenges:
- Grid Integration: Integrating large-scale solar power plants into the existing electricity grid can be technically challenging and expensive. (Estimated additional cost of xx Million units for grid upgrades by 2030).
- Land Availability: Finding suitable land for large-scale solar projects can be a constraint, particularly in densely populated areas.
- Intermittency: Solar energy is intermittent, necessitating energy storage solutions and grid management strategies.
Emerging Opportunities in Solar Energy in Germany Market
Emerging opportunities include increased adoption of floating solar PV systems, agrivoltaics (combining agriculture and solar energy generation), and integration of solar energy with building-integrated photovoltaics (BIPV). The development of advanced energy storage solutions and smart grid technologies is crucial for addressing the intermittency of solar energy. Furthermore, expanding into untapped markets, such as rural areas and smaller towns, offers significant potential for growth.
Growth Accelerators in the Solar Energy in Germany Market Industry
Technological advancements, especially in high-efficiency solar cells and energy storage, are key growth catalysts. Strategic partnerships between energy companies, technology providers, and research institutions are fostering innovation. Government support for research and development, along with tax incentives and streamlined permitting processes, further accelerate market expansion. The increasing competitiveness of solar energy compared to traditional fossil fuel-based energy sources is a major factor driving growth.
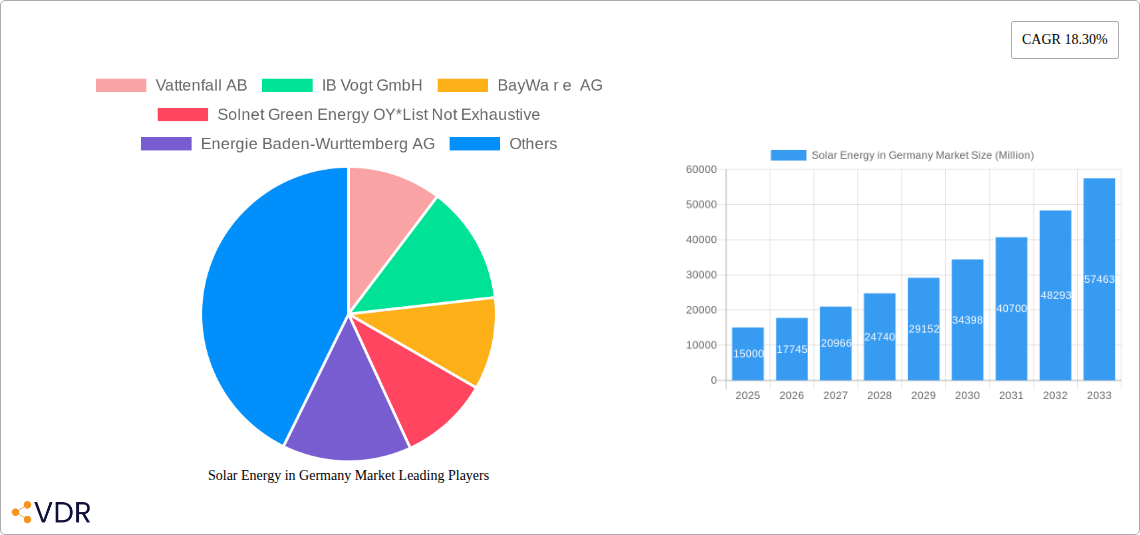
Key Players Shaping the Solar Energy in Germany Market Market
- Vattenfall AB
- IB Vogt GmbH
- BayWa re AG
- Solnet Green Energy OY
- Energie Baden-Württemberg AG
- AE Alternative Energy GMBH
- IBC SOLAR AG
- Centrotherm International AG
- SunPower Corporation
- Hanwha Corporation
Notable Milestones in Solar Energy in Germany Market Sector
- April 2024: SINN Power GmbH announces plans for a 1.8 MW floating PV system in Bavaria.
- January 2024: RWE starts supplying green electricity from a 3.2 MW agri-photovoltaic plant in North Rhine-Westphalia.
- September 2023: Shell Energy signs a 15-year power purchase agreement for 600 MW of solar energy from the Witznitz Energy Park.
In-Depth Solar Energy in Germany Market Market Outlook
The German solar energy market is poised for continued strong growth, driven by increasing energy demand, ambitious renewable energy targets, and technological advancements. Strategic opportunities include focusing on large-scale projects, optimizing grid integration, and developing innovative solutions for energy storage and smart grid management. The market's future success depends on continued government support, technological innovation, and addressing the challenges associated with grid integration and land availability. The long-term outlook is positive, with significant potential for further market expansion and contribution to Germany's energy transition goals.
Solar Energy in Germany Market Segmentation
-
1. Type
- 1.1. Solar Photovoltaic
- 1.2. Concentrated Solar Power
-
2. Application
- 2.1. Utility
- 2.2. Commercial/Industrial
- 2.3. Residential
Solar Energy in Germany Market Segmentation By Geography
-
1. North America
- 1.1. United States
- 1.2. Canada
- 1.3. Mexico
-
2. South America
- 2.1. Brazil
- 2.2. Argentina
- 2.3. Rest of South America
-
3. Europe
- 3.1. United Kingdom
- 3.2. Germany
- 3.3. France
- 3.4. Italy
- 3.5. Spain
- 3.6. Russia
- 3.7. Benelux
- 3.8. Nordics
- 3.9. Rest of Europe
-
4. Middle East & Africa
- 4.1. Turkey
- 4.2. Israel
- 4.3. GCC
- 4.4. North Africa
- 4.5. South Africa
- 4.6. Rest of Middle East & Africa
-
5. Asia Pacific
- 5.1. China
- 5.2. India
- 5.3. Japan
- 5.4. South Korea
- 5.5. ASEAN
- 5.6. Oceania
- 5.7. Rest of Asia Pacific
Solar Energy in Germany Market REPORT HIGHLIGHTS
| Aspects | Details |
|---|---|
| Study Period | 2019-2033 |
| Base Year | 2024 |
| Estimated Year | 2025 |
| Forecast Period | 2025-2033 |
| Historical Period | 2019-2024 |
| Growth Rate | CAGR of 18.30% from 2019-2033 |
| Segmentation |
|
Table of Contents
- 1. Introduction
- 1.1. Research Scope
- 1.2. Market Segmentation
- 1.3. Research Methodology
- 1.4. Definitions and Assumptions
- 2. Executive Summary
- 2.1. Introduction
- 3. Market Dynamics
- 3.1. Introduction
- 3.2. Market Drivers
- 3.2.1. 4.; Increase in Prices of Electricity Procured from Conventional Mechanisms 4.; Decline in Cost of Solar Energy Infrastructure
- 3.3. Market Restrains
- 3.3.1. 4.; Competition from Other Alternative Energy Sources
- 3.4. Market Trends
- 3.4.1. Solar Photovoltaic (PV) Expected to Dominate the Market
- 4. Market Factor Analysis
- 4.1. Porters Five Forces
- 4.2. Supply/Value Chain
- 4.3. PESTEL analysis
- 4.4. Market Entropy
- 4.5. Patent/Trademark Analysis
- 5. Global Solar Energy in Germany Market Analysis, Insights and Forecast, 2019-2031
- 5.1. Market Analysis, Insights and Forecast - by Type
- 5.1.1. Solar Photovoltaic
- 5.1.2. Concentrated Solar Power
- 5.2. Market Analysis, Insights and Forecast - by Application
- 5.2.1. Utility
- 5.2.2. Commercial/Industrial
- 5.2.3. Residential
- 5.3. Market Analysis, Insights and Forecast - by Region
- 5.3.1. North America
- 5.3.2. South America
- 5.3.3. Europe
- 5.3.4. Middle East & Africa
- 5.3.5. Asia Pacific
- 5.1. Market Analysis, Insights and Forecast - by Type
- 6. North America Solar Energy in Germany Market Analysis, Insights and Forecast, 2019-2031
- 6.1. Market Analysis, Insights and Forecast - by Type
- 6.1.1. Solar Photovoltaic
- 6.1.2. Concentrated Solar Power
- 6.2. Market Analysis, Insights and Forecast - by Application
- 6.2.1. Utility
- 6.2.2. Commercial/Industrial
- 6.2.3. Residential
- 6.1. Market Analysis, Insights and Forecast - by Type
- 7. South America Solar Energy in Germany Market Analysis, Insights and Forecast, 2019-2031
- 7.1. Market Analysis, Insights and Forecast - by Type
- 7.1.1. Solar Photovoltaic
- 7.1.2. Concentrated Solar Power
- 7.2. Market Analysis, Insights and Forecast - by Application
- 7.2.1. Utility
- 7.2.2. Commercial/Industrial
- 7.2.3. Residential
- 7.1. Market Analysis, Insights and Forecast - by Type
- 8. Europe Solar Energy in Germany Market Analysis, Insights and Forecast, 2019-2031
- 8.1. Market Analysis, Insights and Forecast - by Type
- 8.1.1. Solar Photovoltaic
- 8.1.2. Concentrated Solar Power
- 8.2. Market Analysis, Insights and Forecast - by Application
- 8.2.1. Utility
- 8.2.2. Commercial/Industrial
- 8.2.3. Residential
- 8.1. Market Analysis, Insights and Forecast - by Type
- 9. Middle East & Africa Solar Energy in Germany Market Analysis, Insights and Forecast, 2019-2031
- 9.1. Market Analysis, Insights and Forecast - by Type
- 9.1.1. Solar Photovoltaic
- 9.1.2. Concentrated Solar Power
- 9.2. Market Analysis, Insights and Forecast - by Application
- 9.2.1. Utility
- 9.2.2. Commercial/Industrial
- 9.2.3. Residential
- 9.1. Market Analysis, Insights and Forecast - by Type
- 10. Asia Pacific Solar Energy in Germany Market Analysis, Insights and Forecast, 2019-2031
- 10.1. Market Analysis, Insights and Forecast - by Type
- 10.1.1. Solar Photovoltaic
- 10.1.2. Concentrated Solar Power
- 10.2. Market Analysis, Insights and Forecast - by Application
- 10.2.1. Utility
- 10.2.2. Commercial/Industrial
- 10.2.3. Residential
- 10.1. Market Analysis, Insights and Forecast - by Type
- 11. North Rhine-Westphalia Solar Energy in Germany Market Analysis, Insights and Forecast, 2019-2031
- 12. Bavaria Solar Energy in Germany Market Analysis, Insights and Forecast, 2019-2031
- 13. Baden-Württemberg Solar Energy in Germany Market Analysis, Insights and Forecast, 2019-2031
- 14. Lower Saxony Solar Energy in Germany Market Analysis, Insights and Forecast, 2019-2031
- 15. Hesse Solar Energy in Germany Market Analysis, Insights and Forecast, 2019-2031
- 16. Competitive Analysis
- 16.1. Global Market Share Analysis 2024
- 16.2. Company Profiles
- 16.2.1 Vattenfall AB
- 16.2.1.1. Overview
- 16.2.1.2. Products
- 16.2.1.3. SWOT Analysis
- 16.2.1.4. Recent Developments
- 16.2.1.5. Financials (Based on Availability)
- 16.2.2 IB Vogt GmbH
- 16.2.2.1. Overview
- 16.2.2.2. Products
- 16.2.2.3. SWOT Analysis
- 16.2.2.4. Recent Developments
- 16.2.2.5. Financials (Based on Availability)
- 16.2.3 BayWa r e AG
- 16.2.3.1. Overview
- 16.2.3.2. Products
- 16.2.3.3. SWOT Analysis
- 16.2.3.4. Recent Developments
- 16.2.3.5. Financials (Based on Availability)
- 16.2.4 Solnet Green Energy OY*List Not Exhaustive
- 16.2.4.1. Overview
- 16.2.4.2. Products
- 16.2.4.3. SWOT Analysis
- 16.2.4.4. Recent Developments
- 16.2.4.5. Financials (Based on Availability)
- 16.2.5 Energie Baden-Wurttemberg AG
- 16.2.5.1. Overview
- 16.2.5.2. Products
- 16.2.5.3. SWOT Analysis
- 16.2.5.4. Recent Developments
- 16.2.5.5. Financials (Based on Availability)
- 16.2.6 AE Alternative Energy GMBH
- 16.2.6.1. Overview
- 16.2.6.2. Products
- 16.2.6.3. SWOT Analysis
- 16.2.6.4. Recent Developments
- 16.2.6.5. Financials (Based on Availability)
- 16.2.7 IBC SOLAR AG
- 16.2.7.1. Overview
- 16.2.7.2. Products
- 16.2.7.3. SWOT Analysis
- 16.2.7.4. Recent Developments
- 16.2.7.5. Financials (Based on Availability)
- 16.2.8 Centrotherm International AG
- 16.2.8.1. Overview
- 16.2.8.2. Products
- 16.2.8.3. SWOT Analysis
- 16.2.8.4. Recent Developments
- 16.2.8.5. Financials (Based on Availability)
- 16.2.9 Sun Power Corporation
- 16.2.9.1. Overview
- 16.2.9.2. Products
- 16.2.9.3. SWOT Analysis
- 16.2.9.4. Recent Developments
- 16.2.9.5. Financials (Based on Availability)
- 16.2.10 Hanwha Corporation
- 16.2.10.1. Overview
- 16.2.10.2. Products
- 16.2.10.3. SWOT Analysis
- 16.2.10.4. Recent Developments
- 16.2.10.5. Financials (Based on Availability)
- 16.2.1 Vattenfall AB
List of Figures
- Figure 1: Global Solar Energy in Germany Market Revenue Breakdown (Million, %) by Region 2024 & 2032
- Figure 2: Global Solar Energy in Germany Market Volume Breakdown (gigawatt, %) by Region 2024 & 2032
- Figure 3: Germany Solar Energy in Germany Market Revenue (Million), by Country 2024 & 2032
- Figure 4: Germany Solar Energy in Germany Market Volume (gigawatt), by Country 2024 & 2032
- Figure 5: Germany Solar Energy in Germany Market Revenue Share (%), by Country 2024 & 2032
- Figure 6: Germany Solar Energy in Germany Market Volume Share (%), by Country 2024 & 2032
- Figure 7: North America Solar Energy in Germany Market Revenue (Million), by Type 2024 & 2032
- Figure 8: North America Solar Energy in Germany Market Volume (gigawatt), by Type 2024 & 2032
- Figure 9: North America Solar Energy in Germany Market Revenue Share (%), by Type 2024 & 2032
- Figure 10: North America Solar Energy in Germany Market Volume Share (%), by Type 2024 & 2032
- Figure 11: North America Solar Energy in Germany Market Revenue (Million), by Application 2024 & 2032
- Figure 12: North America Solar Energy in Germany Market Volume (gigawatt), by Application 2024 & 2032
- Figure 13: North America Solar Energy in Germany Market Revenue Share (%), by Application 2024 & 2032
- Figure 14: North America Solar Energy in Germany Market Volume Share (%), by Application 2024 & 2032
- Figure 15: North America Solar Energy in Germany Market Revenue (Million), by Country 2024 & 2032
- Figure 16: North America Solar Energy in Germany Market Volume (gigawatt), by Country 2024 & 2032
- Figure 17: North America Solar Energy in Germany Market Revenue Share (%), by Country 2024 & 2032
- Figure 18: North America Solar Energy in Germany Market Volume Share (%), by Country 2024 & 2032
- Figure 19: South America Solar Energy in Germany Market Revenue (Million), by Type 2024 & 2032
- Figure 20: South America Solar Energy in Germany Market Volume (gigawatt), by Type 2024 & 2032
- Figure 21: South America Solar Energy in Germany Market Revenue Share (%), by Type 2024 & 2032
- Figure 22: South America Solar Energy in Germany Market Volume Share (%), by Type 2024 & 2032
- Figure 23: South America Solar Energy in Germany Market Revenue (Million), by Application 2024 & 2032
- Figure 24: South America Solar Energy in Germany Market Volume (gigawatt), by Application 2024 & 2032
- Figure 25: South America Solar Energy in Germany Market Revenue Share (%), by Application 2024 & 2032
- Figure 26: South America Solar Energy in Germany Market Volume Share (%), by Application 2024 & 2032
- Figure 27: South America Solar Energy in Germany Market Revenue (Million), by Country 2024 & 2032
- Figure 28: South America Solar Energy in Germany Market Volume (gigawatt), by Country 2024 & 2032
- Figure 29: South America Solar Energy in Germany Market Revenue Share (%), by Country 2024 & 2032
- Figure 30: South America Solar Energy in Germany Market Volume Share (%), by Country 2024 & 2032
- Figure 31: Europe Solar Energy in Germany Market Revenue (Million), by Type 2024 & 2032
- Figure 32: Europe Solar Energy in Germany Market Volume (gigawatt), by Type 2024 & 2032
- Figure 33: Europe Solar Energy in Germany Market Revenue Share (%), by Type 2024 & 2032
- Figure 34: Europe Solar Energy in Germany Market Volume Share (%), by Type 2024 & 2032
- Figure 35: Europe Solar Energy in Germany Market Revenue (Million), by Application 2024 & 2032
- Figure 36: Europe Solar Energy in Germany Market Volume (gigawatt), by Application 2024 & 2032
- Figure 37: Europe Solar Energy in Germany Market Revenue Share (%), by Application 2024 & 2032
- Figure 38: Europe Solar Energy in Germany Market Volume Share (%), by Application 2024 & 2032
- Figure 39: Europe Solar Energy in Germany Market Revenue (Million), by Country 2024 & 2032
- Figure 40: Europe Solar Energy in Germany Market Volume (gigawatt), by Country 2024 & 2032
- Figure 41: Europe Solar Energy in Germany Market Revenue Share (%), by Country 2024 & 2032
- Figure 42: Europe Solar Energy in Germany Market Volume Share (%), by Country 2024 & 2032
- Figure 43: Middle East & Africa Solar Energy in Germany Market Revenue (Million), by Type 2024 & 2032
- Figure 44: Middle East & Africa Solar Energy in Germany Market Volume (gigawatt), by Type 2024 & 2032
- Figure 45: Middle East & Africa Solar Energy in Germany Market Revenue Share (%), by Type 2024 & 2032
- Figure 46: Middle East & Africa Solar Energy in Germany Market Volume Share (%), by Type 2024 & 2032
- Figure 47: Middle East & Africa Solar Energy in Germany Market Revenue (Million), by Application 2024 & 2032
- Figure 48: Middle East & Africa Solar Energy in Germany Market Volume (gigawatt), by Application 2024 & 2032
- Figure 49: Middle East & Africa Solar Energy in Germany Market Revenue Share (%), by Application 2024 & 2032
- Figure 50: Middle East & Africa Solar Energy in Germany Market Volume Share (%), by Application 2024 & 2032
- Figure 51: Middle East & Africa Solar Energy in Germany Market Revenue (Million), by Country 2024 & 2032
- Figure 52: Middle East & Africa Solar Energy in Germany Market Volume (gigawatt), by Country 2024 & 2032
- Figure 53: Middle East & Africa Solar Energy in Germany Market Revenue Share (%), by Country 2024 & 2032
- Figure 54: Middle East & Africa Solar Energy in Germany Market Volume Share (%), by Country 2024 & 2032
- Figure 55: Asia Pacific Solar Energy in Germany Market Revenue (Million), by Type 2024 & 2032
- Figure 56: Asia Pacific Solar Energy in Germany Market Volume (gigawatt), by Type 2024 & 2032
- Figure 57: Asia Pacific Solar Energy in Germany Market Revenue Share (%), by Type 2024 & 2032
- Figure 58: Asia Pacific Solar Energy in Germany Market Volume Share (%), by Type 2024 & 2032
- Figure 59: Asia Pacific Solar Energy in Germany Market Revenue (Million), by Application 2024 & 2032
- Figure 60: Asia Pacific Solar Energy in Germany Market Volume (gigawatt), by Application 2024 & 2032
- Figure 61: Asia Pacific Solar Energy in Germany Market Revenue Share (%), by Application 2024 & 2032
- Figure 62: Asia Pacific Solar Energy in Germany Market Volume Share (%), by Application 2024 & 2032
- Figure 63: Asia Pacific Solar Energy in Germany Market Revenue (Million), by Country 2024 & 2032
- Figure 64: Asia Pacific Solar Energy in Germany Market Volume (gigawatt), by Country 2024 & 2032
- Figure 65: Asia Pacific Solar Energy in Germany Market Revenue Share (%), by Country 2024 & 2032
- Figure 66: Asia Pacific Solar Energy in Germany Market Volume Share (%), by Country 2024 & 2032
List of Tables
- Table 1: Global Solar Energy in Germany Market Revenue Million Forecast, by Region 2019 & 2032
- Table 2: Global Solar Energy in Germany Market Volume gigawatt Forecast, by Region 2019 & 2032
- Table 3: Global Solar Energy in Germany Market Revenue Million Forecast, by Type 2019 & 2032
- Table 4: Global Solar Energy in Germany Market Volume gigawatt Forecast, by Type 2019 & 2032
- Table 5: Global Solar Energy in Germany Market Revenue Million Forecast, by Application 2019 & 2032
- Table 6: Global Solar Energy in Germany Market Volume gigawatt Forecast, by Application 2019 & 2032
- Table 7: Global Solar Energy in Germany Market Revenue Million Forecast, by Region 2019 & 2032
- Table 8: Global Solar Energy in Germany Market Volume gigawatt Forecast, by Region 2019 & 2032
- Table 9: Global Solar Energy in Germany Market Revenue Million Forecast, by Country 2019 & 2032
- Table 10: Global Solar Energy in Germany Market Volume gigawatt Forecast, by Country 2019 & 2032
- Table 11: North Rhine-Westphalia Solar Energy in Germany Market Revenue (Million) Forecast, by Application 2019 & 2032
- Table 12: North Rhine-Westphalia Solar Energy in Germany Market Volume (gigawatt) Forecast, by Application 2019 & 2032
- Table 13: Bavaria Solar Energy in Germany Market Revenue (Million) Forecast, by Application 2019 & 2032
- Table 14: Bavaria Solar Energy in Germany Market Volume (gigawatt) Forecast, by Application 2019 & 2032
- Table 15: Baden-Württemberg Solar Energy in Germany Market Revenue (Million) Forecast, by Application 2019 & 2032
- Table 16: Baden-Württemberg Solar Energy in Germany Market Volume (gigawatt) Forecast, by Application 2019 & 2032
- Table 17: Lower Saxony Solar Energy in Germany Market Revenue (Million) Forecast, by Application 2019 & 2032
- Table 18: Lower Saxony Solar Energy in Germany Market Volume (gigawatt) Forecast, by Application 2019 & 2032
- Table 19: Hesse Solar Energy in Germany Market Revenue (Million) Forecast, by Application 2019 & 2032
- Table 20: Hesse Solar Energy in Germany Market Volume (gigawatt) Forecast, by Application 2019 & 2032
- Table 21: Global Solar Energy in Germany Market Revenue Million Forecast, by Type 2019 & 2032
- Table 22: Global Solar Energy in Germany Market Volume gigawatt Forecast, by Type 2019 & 2032
- Table 23: Global Solar Energy in Germany Market Revenue Million Forecast, by Application 2019 & 2032
- Table 24: Global Solar Energy in Germany Market Volume gigawatt Forecast, by Application 2019 & 2032
- Table 25: Global Solar Energy in Germany Market Revenue Million Forecast, by Country 2019 & 2032
- Table 26: Global Solar Energy in Germany Market Volume gigawatt Forecast, by Country 2019 & 2032
- Table 27: United States Solar Energy in Germany Market Revenue (Million) Forecast, by Application 2019 & 2032
- Table 28: United States Solar Energy in Germany Market Volume (gigawatt) Forecast, by Application 2019 & 2032
- Table 29: Canada Solar Energy in Germany Market Revenue (Million) Forecast, by Application 2019 & 2032
- Table 30: Canada Solar Energy in Germany Market Volume (gigawatt) Forecast, by Application 2019 & 2032
- Table 31: Mexico Solar Energy in Germany Market Revenue (Million) Forecast, by Application 2019 & 2032
- Table 32: Mexico Solar Energy in Germany Market Volume (gigawatt) Forecast, by Application 2019 & 2032
- Table 33: Global Solar Energy in Germany Market Revenue Million Forecast, by Type 2019 & 2032
- Table 34: Global Solar Energy in Germany Market Volume gigawatt Forecast, by Type 2019 & 2032
- Table 35: Global Solar Energy in Germany Market Revenue Million Forecast, by Application 2019 & 2032
- Table 36: Global Solar Energy in Germany Market Volume gigawatt Forecast, by Application 2019 & 2032
- Table 37: Global Solar Energy in Germany Market Revenue Million Forecast, by Country 2019 & 2032
- Table 38: Global Solar Energy in Germany Market Volume gigawatt Forecast, by Country 2019 & 2032
- Table 39: Brazil Solar Energy in Germany Market Revenue (Million) Forecast, by Application 2019 & 2032
- Table 40: Brazil Solar Energy in Germany Market Volume (gigawatt) Forecast, by Application 2019 & 2032
- Table 41: Argentina Solar Energy in Germany Market Revenue (Million) Forecast, by Application 2019 & 2032
- Table 42: Argentina Solar Energy in Germany Market Volume (gigawatt) Forecast, by Application 2019 & 2032
- Table 43: Rest of South America Solar Energy in Germany Market Revenue (Million) Forecast, by Application 2019 & 2032
- Table 44: Rest of South America Solar Energy in Germany Market Volume (gigawatt) Forecast, by Application 2019 & 2032
- Table 45: Global Solar Energy in Germany Market Revenue Million Forecast, by Type 2019 & 2032
- Table 46: Global Solar Energy in Germany Market Volume gigawatt Forecast, by Type 2019 & 2032
- Table 47: Global Solar Energy in Germany Market Revenue Million Forecast, by Application 2019 & 2032
- Table 48: Global Solar Energy in Germany Market Volume gigawatt Forecast, by Application 2019 & 2032
- Table 49: Global Solar Energy in Germany Market Revenue Million Forecast, by Country 2019 & 2032
- Table 50: Global Solar Energy in Germany Market Volume gigawatt Forecast, by Country 2019 & 2032
- Table 51: United Kingdom Solar Energy in Germany Market Revenue (Million) Forecast, by Application 2019 & 2032
- Table 52: United Kingdom Solar Energy in Germany Market Volume (gigawatt) Forecast, by Application 2019 & 2032
- Table 53: Germany Solar Energy in Germany Market Revenue (Million) Forecast, by Application 2019 & 2032
- Table 54: Germany Solar Energy in Germany Market Volume (gigawatt) Forecast, by Application 2019 & 2032
- Table 55: France Solar Energy in Germany Market Revenue (Million) Forecast, by Application 2019 & 2032
- Table 56: France Solar Energy in Germany Market Volume (gigawatt) Forecast, by Application 2019 & 2032
- Table 57: Italy Solar Energy in Germany Market Revenue (Million) Forecast, by Application 2019 & 2032
- Table 58: Italy Solar Energy in Germany Market Volume (gigawatt) Forecast, by Application 2019 & 2032
- Table 59: Spain Solar Energy in Germany Market Revenue (Million) Forecast, by Application 2019 & 2032
- Table 60: Spain Solar Energy in Germany Market Volume (gigawatt) Forecast, by Application 2019 & 2032
- Table 61: Russia Solar Energy in Germany Market Revenue (Million) Forecast, by Application 2019 & 2032
- Table 62: Russia Solar Energy in Germany Market Volume (gigawatt) Forecast, by Application 2019 & 2032
- Table 63: Benelux Solar Energy in Germany Market Revenue (Million) Forecast, by Application 2019 & 2032
- Table 64: Benelux Solar Energy in Germany Market Volume (gigawatt) Forecast, by Application 2019 & 2032
- Table 65: Nordics Solar Energy in Germany Market Revenue (Million) Forecast, by Application 2019 & 2032
- Table 66: Nordics Solar Energy in Germany Market Volume (gigawatt) Forecast, by Application 2019 & 2032
- Table 67: Rest of Europe Solar Energy in Germany Market Revenue (Million) Forecast, by Application 2019 & 2032
- Table 68: Rest of Europe Solar Energy in Germany Market Volume (gigawatt) Forecast, by Application 2019 & 2032
- Table 69: Global Solar Energy in Germany Market Revenue Million Forecast, by Type 2019 & 2032
- Table 70: Global Solar Energy in Germany Market Volume gigawatt Forecast, by Type 2019 & 2032
- Table 71: Global Solar Energy in Germany Market Revenue Million Forecast, by Application 2019 & 2032
- Table 72: Global Solar Energy in Germany Market Volume gigawatt Forecast, by Application 2019 & 2032
- Table 73: Global Solar Energy in Germany Market Revenue Million Forecast, by Country 2019 & 2032
- Table 74: Global Solar Energy in Germany Market Volume gigawatt Forecast, by Country 2019 & 2032
- Table 75: Turkey Solar Energy in Germany Market Revenue (Million) Forecast, by Application 2019 & 2032
- Table 76: Turkey Solar Energy in Germany Market Volume (gigawatt) Forecast, by Application 2019 & 2032
- Table 77: Israel Solar Energy in Germany Market Revenue (Million) Forecast, by Application 2019 & 2032
- Table 78: Israel Solar Energy in Germany Market Volume (gigawatt) Forecast, by Application 2019 & 2032
- Table 79: GCC Solar Energy in Germany Market Revenue (Million) Forecast, by Application 2019 & 2032
- Table 80: GCC Solar Energy in Germany Market Volume (gigawatt) Forecast, by Application 2019 & 2032
- Table 81: North Africa Solar Energy in Germany Market Revenue (Million) Forecast, by Application 2019 & 2032
- Table 82: North Africa Solar Energy in Germany Market Volume (gigawatt) Forecast, by Application 2019 & 2032
- Table 83: South Africa Solar Energy in Germany Market Revenue (Million) Forecast, by Application 2019 & 2032
- Table 84: South Africa Solar Energy in Germany Market Volume (gigawatt) Forecast, by Application 2019 & 2032
- Table 85: Rest of Middle East & Africa Solar Energy in Germany Market Revenue (Million) Forecast, by Application 2019 & 2032
- Table 86: Rest of Middle East & Africa Solar Energy in Germany Market Volume (gigawatt) Forecast, by Application 2019 & 2032
- Table 87: Global Solar Energy in Germany Market Revenue Million Forecast, by Type 2019 & 2032
- Table 88: Global Solar Energy in Germany Market Volume gigawatt Forecast, by Type 2019 & 2032
- Table 89: Global Solar Energy in Germany Market Revenue Million Forecast, by Application 2019 & 2032
- Table 90: Global Solar Energy in Germany Market Volume gigawatt Forecast, by Application 2019 & 2032
- Table 91: Global Solar Energy in Germany Market Revenue Million Forecast, by Country 2019 & 2032
- Table 92: Global Solar Energy in Germany Market Volume gigawatt Forecast, by Country 2019 & 2032
- Table 93: China Solar Energy in Germany Market Revenue (Million) Forecast, by Application 2019 & 2032
- Table 94: China Solar Energy in Germany Market Volume (gigawatt) Forecast, by Application 2019 & 2032
- Table 95: India Solar Energy in Germany Market Revenue (Million) Forecast, by Application 2019 & 2032
- Table 96: India Solar Energy in Germany Market Volume (gigawatt) Forecast, by Application 2019 & 2032
- Table 97: Japan Solar Energy in Germany Market Revenue (Million) Forecast, by Application 2019 & 2032
- Table 98: Japan Solar Energy in Germany Market Volume (gigawatt) Forecast, by Application 2019 & 2032
- Table 99: South Korea Solar Energy in Germany Market Revenue (Million) Forecast, by Application 2019 & 2032
- Table 100: South Korea Solar Energy in Germany Market Volume (gigawatt) Forecast, by Application 2019 & 2032
- Table 101: ASEAN Solar Energy in Germany Market Revenue (Million) Forecast, by Application 2019 & 2032
- Table 102: ASEAN Solar Energy in Germany Market Volume (gigawatt) Forecast, by Application 2019 & 2032
- Table 103: Oceania Solar Energy in Germany Market Revenue (Million) Forecast, by Application 2019 & 2032
- Table 104: Oceania Solar Energy in Germany Market Volume (gigawatt) Forecast, by Application 2019 & 2032
- Table 105: Rest of Asia Pacific Solar Energy in Germany Market Revenue (Million) Forecast, by Application 2019 & 2032
- Table 106: Rest of Asia Pacific Solar Energy in Germany Market Volume (gigawatt) Forecast, by Application 2019 & 2032
Frequently Asked Questions
1. What is the projected Compound Annual Growth Rate (CAGR) of the Solar Energy in Germany Market?
The projected CAGR is approximately 18.30%.
2. Which companies are prominent players in the Solar Energy in Germany Market?
Key companies in the market include Vattenfall AB, IB Vogt GmbH, BayWa r e AG, Solnet Green Energy OY*List Not Exhaustive, Energie Baden-Wurttemberg AG, AE Alternative Energy GMBH, IBC SOLAR AG, Centrotherm International AG, Sun Power Corporation, Hanwha Corporation.
3. What are the main segments of the Solar Energy in Germany Market?
The market segments include Type, Application.
4. Can you provide details about the market size?
The market size is estimated to be USD XX Million as of 2022.
5. What are some drivers contributing to market growth?
4.; Increase in Prices of Electricity Procured from Conventional Mechanisms 4.; Decline in Cost of Solar Energy Infrastructure.
6. What are the notable trends driving market growth?
Solar Photovoltaic (PV) Expected to Dominate the Market.
7. Are there any restraints impacting market growth?
4.; Competition from Other Alternative Energy Sources.
8. Can you provide examples of recent developments in the market?
April 2024: SINN Power GmbH, a Germany-based energy company, announced its plans to build a 1.8 MW floating PV system with vertically deployed solar modules on a lake at a gravel pit in Gilching, Bavaria. SINN Power GmbH will use its own patented 2,500 Nos Floating-SKipp mounting systems for the project.
9. What pricing options are available for accessing the report?
Pricing options include single-user, multi-user, and enterprise licenses priced at USD 3800, USD 4500, and USD 5800 respectively.
10. Is the market size provided in terms of value or volume?
The market size is provided in terms of value, measured in Million and volume, measured in gigawatt.
11. Are there any specific market keywords associated with the report?
Yes, the market keyword associated with the report is "Solar Energy in Germany Market," which aids in identifying and referencing the specific market segment covered.
12. How do I determine which pricing option suits my needs best?
The pricing options vary based on user requirements and access needs. Individual users may opt for single-user licenses, while businesses requiring broader access may choose multi-user or enterprise licenses for cost-effective access to the report.
13. Are there any additional resources or data provided in the Solar Energy in Germany Market report?
While the report offers comprehensive insights, it's advisable to review the specific contents or supplementary materials provided to ascertain if additional resources or data are available.
14. How can I stay updated on further developments or reports in the Solar Energy in Germany Market?
To stay informed about further developments, trends, and reports in the Solar Energy in Germany Market, consider subscribing to industry newsletters, following relevant companies and organizations, or regularly checking reputable industry news sources and publications.
Methodology
Step 1 - Identification of Relevant Samples Size from Population Database


Step 2 - Approaches for Defining Global Market Size (Value, Volume* & Price*)

Note*: In applicable scenarios
Step 3 - Data Sources
Primary Research
- Web Analytics
- Survey Reports
- Research Institute
- Latest Research Reports
- Opinion Leaders
Secondary Research
- Annual Reports
- White Paper
- Latest Press Release
- Industry Association
- Paid Database
- Investor Presentations

Step 4 - Data Triangulation
Involves using different sources of information in order to increase the validity of a study
These sources are likely to be stakeholders in a program - participants, other researchers, program staff, other community members, and so on.
Then we put all data in single framework & apply various statistical tools to find out the dynamic on the market.
During the analysis stage, feedback from the stakeholder groups would be compared to determine areas of agreement as well as areas of divergence


