
Key Insights
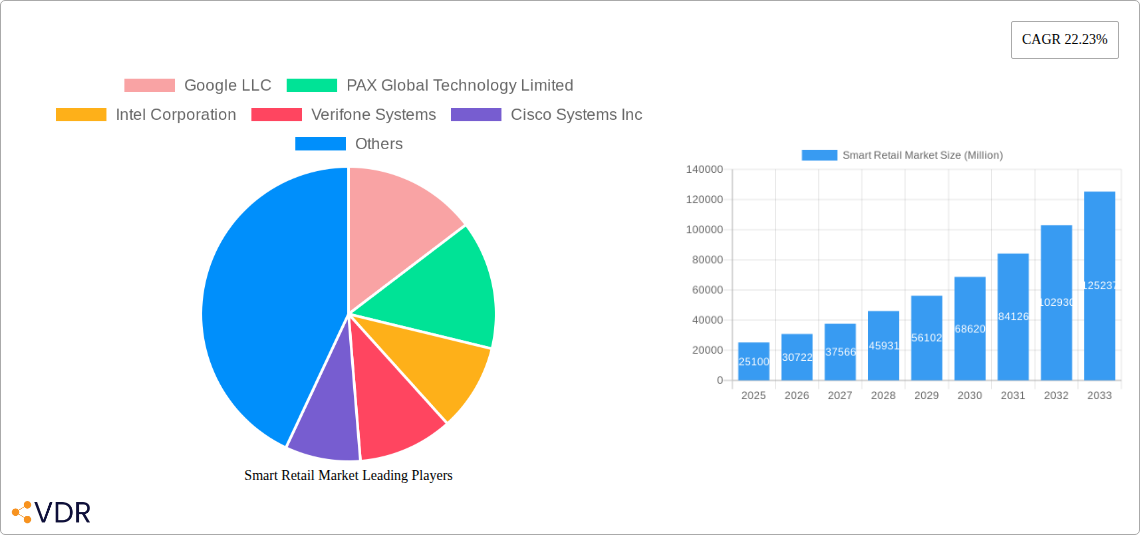
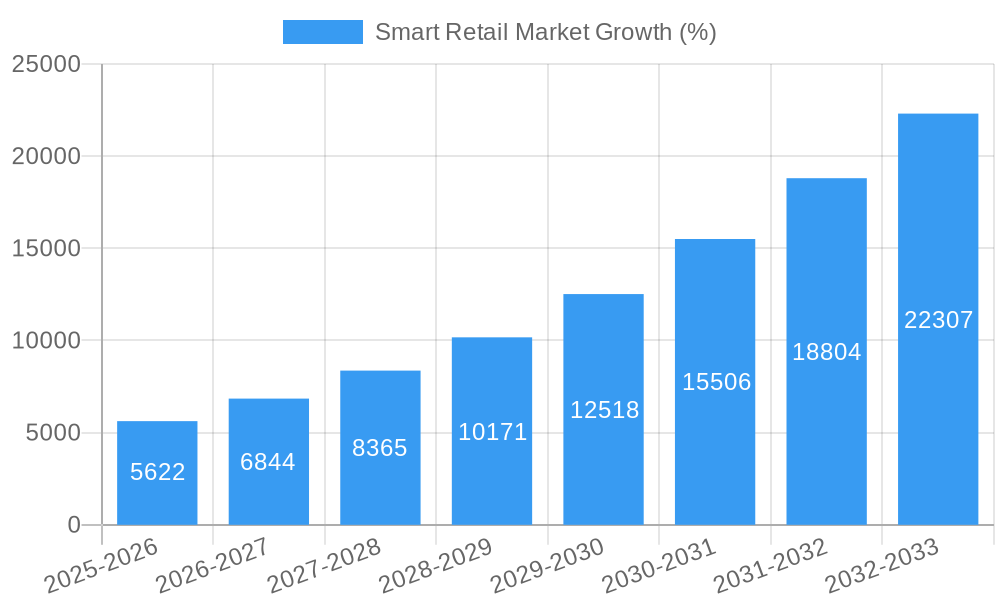
The smart retail market is experiencing robust growth, projected to reach \$25.1 billion in 2025 and maintain a Compound Annual Growth Rate (CAGR) of 22.23% from 2025 to 2033. This expansion is driven by several key factors. The increasing adoption of technologies like artificial intelligence (AI), the Internet of Things (IoT), and big data analytics is revolutionizing the retail landscape, enabling personalized customer experiences, optimized inventory management, and enhanced operational efficiency. Consumers are demanding seamless omnichannel experiences, pushing retailers to integrate online and offline channels effectively. This necessitates investments in smart technologies, including smart shelves, digital signage, and advanced point-of-sale (POS) systems, thereby fueling market growth. Furthermore, the rising need for improved security and fraud prevention in retail transactions is driving the adoption of sophisticated security solutions within the smart retail ecosystem.
Competition in the smart retail market is fierce, with major players like Google, Amazon, and Microsoft vying for market share alongside established players such as Verifone and NCR. However, the market also presents opportunities for smaller, specialized companies focusing on niche technologies or regional markets. Challenges remain, including the high initial investment costs associated with implementing smart retail solutions, concerns about data privacy and security, and the need for robust integration with existing retail infrastructure. Despite these challenges, the long-term outlook for the smart retail market remains positive, driven by continuous technological advancements and the ever-evolving demands of the modern consumer. The market's growth trajectory indicates significant potential for innovation and expansion in the coming years, particularly in areas like augmented reality (AR) and virtual reality (VR) applications for enhanced shopping experiences.
Smart Retail Market: A Comprehensive Report (2019-2033)
This in-depth report provides a comprehensive analysis of the Smart Retail Market, encompassing market dynamics, growth trends, regional dominance, product landscape, key players, and future outlook. The study period covers 2019-2033, with 2025 as the base and estimated year, and a forecast period of 2025-2033. The report utilizes data from the historical period (2019-2024) and integrates current industry developments for an accurate market prediction. This analysis is crucial for retailers, technology providers, investors, and anyone seeking to understand the transformative potential of smart retail technologies. The parent market is the broader retail sector, while the child market is specifically focused on the implementation of smart technologies within retail environments. Market values are presented in millions of units.
Smart Retail Market Market Dynamics & Structure
The Smart Retail Market is characterized by a moderately concentrated landscape, with a few major players holding significant market share, but also featuring a rapidly growing number of smaller, innovative companies. Technological innovation, particularly in areas like AI, IoT, and cloud computing, is the primary driver of market expansion. However, the implementation of smart retail solutions faces challenges, such as high initial investment costs and concerns around data privacy and security. Regulatory frameworks concerning data collection and consumer protection also influence market growth. Competitive product substitutes, like traditional brick-and-mortar retail models, continue to exist but are gradually losing ground. The market is largely driven by end-user demographics—consumers increasingly expect seamless, personalized shopping experiences—fueled by the desire for convenience and efficiency. Mergers and acquisitions (M&A) activity is relatively high, with larger companies acquiring smaller tech firms to enhance their offerings.
- Market Concentration: Moderately Concentrated (xx% held by top 5 players in 2024).
- Technological Drivers: AI, IoT, Cloud Computing, RFID, Big Data Analytics.
- Regulatory Frameworks: Data privacy regulations (GDPR, CCPA) impacting data usage strategies.
- Competitive Substitutes: Traditional retail, e-commerce (without smart retail features).
- End-User Demographics: Growing preference for personalized and convenient shopping experiences.
- M&A Trends: xx deals closed in 2024, primarily focused on acquiring specialized tech companies.
Smart Retail Market Growth Trends & Insights
The Smart Retail Market is experiencing robust growth, driven by increasing consumer demand for personalized shopping experiences, technological advancements, and the adoption of innovative solutions. Market size has grown significantly during the historical period and is projected to continue expanding at a Compound Annual Growth Rate (CAGR) of xx% during the forecast period. This expansion is fueled by rising adoption rates across various retail segments, including grocery, apparel, and electronics. Technological disruptions, such as the integration of AI-powered smart carts and cashierless checkout systems, are significantly altering consumer behavior. Consumers are increasingly comfortable with contactless payments and self-service technologies, thus driving further adoption of smart retail solutions. Market penetration is expected to reach xx% by 2033.
Dominant Regions, Countries, or Segments in Smart Retail Market
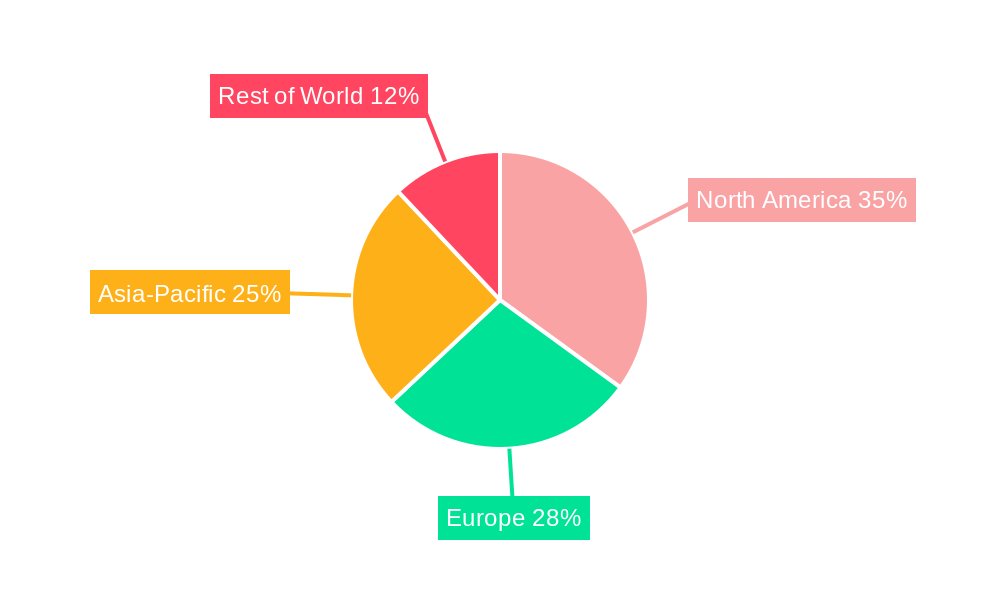
North America currently holds the largest market share in the Smart Retail Market, driven by robust technological advancements, high consumer adoption rates, and supportive government policies. However, the Asia-Pacific region exhibits substantial growth potential due to rapid economic development, rising disposable incomes, and expanding e-commerce infrastructure. Specific countries, such as the United States and China, are significant contributors to overall market growth. Europe also contributes significantly, driven by growing consumer demand and innovation in smart retail technology.
- North America: High adoption rates, strong technological base, supportive regulatory environment.
- Asia-Pacific: Rapid economic growth, rising disposable incomes, expanding e-commerce infrastructure.
- Europe: High consumer demand for advanced retail technologies, strong focus on sustainability.
Smart Retail Market Product Landscape
The Smart Retail Market offers a diverse range of products, from smart shelves and digital signage to AI-powered checkout systems and personalized recommendation engines. These products enhance in-store experiences, optimize inventory management, improve operational efficiency, and gather valuable customer insights. Key technological advancements include advancements in computer vision, natural language processing, and edge computing, creating more robust and efficient solutions. Unique selling propositions often focus on improving customer experience, streamlining operations, and providing actionable data-driven insights.
Key Drivers, Barriers & Challenges in Smart Retail Market
Key Drivers:
- Increased consumer demand for personalized shopping experiences: Consumers expect seamless and tailored interactions.
- Technological advancements: AI, IoT, and cloud computing enable innovative solutions.
- Government initiatives: Policies promoting digitalization and smart city development.
Key Barriers & Challenges:
- High initial investment costs: Implementing smart retail solutions can be expensive.
- Data security and privacy concerns: Protecting sensitive customer data is paramount.
- Integration complexities: Seamless integration with existing systems can be challenging.
- Lack of skilled workforce: Expertise in deploying and managing smart retail technology is needed.
Emerging Opportunities in Smart Retail Market
Untapped markets in developing economies present significant growth opportunities. Innovative applications, such as smart mirrors for virtual try-ons and AI-powered inventory optimization, are gaining traction. The growing demand for omnichannel experiences opens further opportunities for integrating online and offline retail operations. Evolving consumer preferences, such as increased preference for contactless payments, drive adoption of relevant smart technologies.
Growth Accelerators in the Smart Retail Market Industry
Strategic partnerships between technology providers and retailers are accelerating market growth. Technological breakthroughs in areas like AI and edge computing are enhancing the capabilities of smart retail solutions. Expansion into new geographic markets and development of customized solutions for specific retail segments further propel market growth.
Key Players Shaping the Smart Retail Market Market
- Google LLC
- PAX Global Technology Limited
- Intel Corporation
- Verifone Systems
- Cisco Systems Inc
- Huawei Technologies Co Ltd
- IBM Corporation
- Fiserv Inc
- Microsoft
- Honeywell International Inc
- NVIDIA Corporation
- Samsung Electronics
- Amazon com Inc
- NXP Semiconductors
- Caper Inc
- Ingenico Group
- Focal Systems Inc
- LG Display Co Ltd
- NCR Corporation
- *List Not Exhaustive
Notable Milestones in Smart Retail Market Sector
- June 2024: Instacart launches AI-powered Caper Carts at select Missouri locations.
- February 2024: Huawei introduces a comprehensive Smart Retail Solution for various retail operations.
In-Depth Smart Retail Market Market Outlook
The Smart Retail Market is poised for continued robust growth, driven by ongoing technological innovation, increasing consumer adoption, and expansion into new markets. Strategic partnerships, innovative product development, and the addressing of key challenges will shape the future market landscape. The market presents significant opportunities for businesses to enhance their operations, improve customer experiences, and gain a competitive edge in the rapidly evolving retail sector.
Smart Retail Market Segmentation
-
1. Component
- 1.1. Hardware
- 1.2. Software
- 1.3. Services
-
2. Application
- 2.1. Inventory Management
- 2.2. Brand Protection
- 2.3. Foot-Traffic Monitoring
- 2.4. Loyalty Management and Payment
- 2.5. Predictive Equipment Maintenance
- 2.6. Others
Smart Retail Market Segmentation By Geography
- 1. North America
- 2. Europe
- 3. Asia
- 4. Australia and New Zealand
- 5. Latin America
- 6. Middle East and Africa
Smart Retail Market REPORT HIGHLIGHTS
| Aspects | Details |
|---|---|
| Study Period | 2019-2033 |
| Base Year | 2024 |
| Estimated Year | 2025 |
| Forecast Period | 2025-2033 |
| Historical Period | 2019-2024 |
| Growth Rate | CAGR of 22.23% from 2019-2033 |
| Segmentation |
|
Table of Contents
- 1. Introduction
- 1.1. Research Scope
- 1.2. Market Segmentation
- 1.3. Research Methodology
- 1.4. Definitions and Assumptions
- 2. Executive Summary
- 2.1. Introduction
- 3. Market Dynamics
- 3.1. Introduction
- 3.2. Market Drivers
- 3.2.1. Growing Investments in Retail Chains and Retail Supermarkets; Rising Adoption of Advances in Technology Across Retail Chain
- 3.3. Market Restrains
- 3.3.1. Growing Investments in Retail Chains and Retail Supermarkets; Rising Adoption of Advances in Technology Across Retail Chain
- 3.4. Market Trends
- 3.4.1. Inventory Managment Segment is Expected to Hold Significant Market Share
- 4. Market Factor Analysis
- 4.1. Porters Five Forces
- 4.2. Supply/Value Chain
- 4.3. PESTEL analysis
- 4.4. Market Entropy
- 4.5. Patent/Trademark Analysis
- 5. Global Smart Retail Market Analysis, Insights and Forecast, 2019-2031
- 5.1. Market Analysis, Insights and Forecast - by Component
- 5.1.1. Hardware
- 5.1.2. Software
- 5.1.3. Services
- 5.2. Market Analysis, Insights and Forecast - by Application
- 5.2.1. Inventory Management
- 5.2.2. Brand Protection
- 5.2.3. Foot-Traffic Monitoring
- 5.2.4. Loyalty Management and Payment
- 5.2.5. Predictive Equipment Maintenance
- 5.2.6. Others
- 5.3. Market Analysis, Insights and Forecast - by Region
- 5.3.1. North America
- 5.3.2. Europe
- 5.3.3. Asia
- 5.3.4. Australia and New Zealand
- 5.3.5. Latin America
- 5.3.6. Middle East and Africa
- 5.1. Market Analysis, Insights and Forecast - by Component
- 6. North America Smart Retail Market Analysis, Insights and Forecast, 2019-2031
- 6.1. Market Analysis, Insights and Forecast - by Component
- 6.1.1. Hardware
- 6.1.2. Software
- 6.1.3. Services
- 6.2. Market Analysis, Insights and Forecast - by Application
- 6.2.1. Inventory Management
- 6.2.2. Brand Protection
- 6.2.3. Foot-Traffic Monitoring
- 6.2.4. Loyalty Management and Payment
- 6.2.5. Predictive Equipment Maintenance
- 6.2.6. Others
- 6.1. Market Analysis, Insights and Forecast - by Component
- 7. Europe Smart Retail Market Analysis, Insights and Forecast, 2019-2031
- 7.1. Market Analysis, Insights and Forecast - by Component
- 7.1.1. Hardware
- 7.1.2. Software
- 7.1.3. Services
- 7.2. Market Analysis, Insights and Forecast - by Application
- 7.2.1. Inventory Management
- 7.2.2. Brand Protection
- 7.2.3. Foot-Traffic Monitoring
- 7.2.4. Loyalty Management and Payment
- 7.2.5. Predictive Equipment Maintenance
- 7.2.6. Others
- 7.1. Market Analysis, Insights and Forecast - by Component
- 8. Asia Smart Retail Market Analysis, Insights and Forecast, 2019-2031
- 8.1. Market Analysis, Insights and Forecast - by Component
- 8.1.1. Hardware
- 8.1.2. Software
- 8.1.3. Services
- 8.2. Market Analysis, Insights and Forecast - by Application
- 8.2.1. Inventory Management
- 8.2.2. Brand Protection
- 8.2.3. Foot-Traffic Monitoring
- 8.2.4. Loyalty Management and Payment
- 8.2.5. Predictive Equipment Maintenance
- 8.2.6. Others
- 8.1. Market Analysis, Insights and Forecast - by Component
- 9. Australia and New Zealand Smart Retail Market Analysis, Insights and Forecast, 2019-2031
- 9.1. Market Analysis, Insights and Forecast - by Component
- 9.1.1. Hardware
- 9.1.2. Software
- 9.1.3. Services
- 9.2. Market Analysis, Insights and Forecast - by Application
- 9.2.1. Inventory Management
- 9.2.2. Brand Protection
- 9.2.3. Foot-Traffic Monitoring
- 9.2.4. Loyalty Management and Payment
- 9.2.5. Predictive Equipment Maintenance
- 9.2.6. Others
- 9.1. Market Analysis, Insights and Forecast - by Component
- 10. Latin America Smart Retail Market Analysis, Insights and Forecast, 2019-2031
- 10.1. Market Analysis, Insights and Forecast - by Component
- 10.1.1. Hardware
- 10.1.2. Software
- 10.1.3. Services
- 10.2. Market Analysis, Insights and Forecast - by Application
- 10.2.1. Inventory Management
- 10.2.2. Brand Protection
- 10.2.3. Foot-Traffic Monitoring
- 10.2.4. Loyalty Management and Payment
- 10.2.5. Predictive Equipment Maintenance
- 10.2.6. Others
- 10.1. Market Analysis, Insights and Forecast - by Component
- 11. Middle East and Africa Smart Retail Market Analysis, Insights and Forecast, 2019-2031
- 11.1. Market Analysis, Insights and Forecast - by Component
- 11.1.1. Hardware
- 11.1.2. Software
- 11.1.3. Services
- 11.2. Market Analysis, Insights and Forecast - by Application
- 11.2.1. Inventory Management
- 11.2.2. Brand Protection
- 11.2.3. Foot-Traffic Monitoring
- 11.2.4. Loyalty Management and Payment
- 11.2.5. Predictive Equipment Maintenance
- 11.2.6. Others
- 11.1. Market Analysis, Insights and Forecast - by Component
- 12. Competitive Analysis
- 12.1. Global Market Share Analysis 2024
- 12.2. Company Profiles
- 12.2.1 Google LLC
- 12.2.1.1. Overview
- 12.2.1.2. Products
- 12.2.1.3. SWOT Analysis
- 12.2.1.4. Recent Developments
- 12.2.1.5. Financials (Based on Availability)
- 12.2.2 PAX Global Technology Limited
- 12.2.2.1. Overview
- 12.2.2.2. Products
- 12.2.2.3. SWOT Analysis
- 12.2.2.4. Recent Developments
- 12.2.2.5. Financials (Based on Availability)
- 12.2.3 Intel Corporation
- 12.2.3.1. Overview
- 12.2.3.2. Products
- 12.2.3.3. SWOT Analysis
- 12.2.3.4. Recent Developments
- 12.2.3.5. Financials (Based on Availability)
- 12.2.4 Verifone Systems
- 12.2.4.1. Overview
- 12.2.4.2. Products
- 12.2.4.3. SWOT Analysis
- 12.2.4.4. Recent Developments
- 12.2.4.5. Financials (Based on Availability)
- 12.2.5 Cisco Systems Inc
- 12.2.5.1. Overview
- 12.2.5.2. Products
- 12.2.5.3. SWOT Analysis
- 12.2.5.4. Recent Developments
- 12.2.5.5. Financials (Based on Availability)
- 12.2.6 Huawei Technologies Co Ltd
- 12.2.6.1. Overview
- 12.2.6.2. Products
- 12.2.6.3. SWOT Analysis
- 12.2.6.4. Recent Developments
- 12.2.6.5. Financials (Based on Availability)
- 12.2.7 IBM Corporation
- 12.2.7.1. Overview
- 12.2.7.2. Products
- 12.2.7.3. SWOT Analysis
- 12.2.7.4. Recent Developments
- 12.2.7.5. Financials (Based on Availability)
- 12.2.8 Fiserv Inc
- 12.2.8.1. Overview
- 12.2.8.2. Products
- 12.2.8.3. SWOT Analysis
- 12.2.8.4. Recent Developments
- 12.2.8.5. Financials (Based on Availability)
- 12.2.9 Microsoft
- 12.2.9.1. Overview
- 12.2.9.2. Products
- 12.2.9.3. SWOT Analysis
- 12.2.9.4. Recent Developments
- 12.2.9.5. Financials (Based on Availability)
- 12.2.10 Honeywell International Inc
- 12.2.10.1. Overview
- 12.2.10.2. Products
- 12.2.10.3. SWOT Analysis
- 12.2.10.4. Recent Developments
- 12.2.10.5. Financials (Based on Availability)
- 12.2.11 NVIDIA Corporation
- 12.2.11.1. Overview
- 12.2.11.2. Products
- 12.2.11.3. SWOT Analysis
- 12.2.11.4. Recent Developments
- 12.2.11.5. Financials (Based on Availability)
- 12.2.12 Samsung Electronics
- 12.2.12.1. Overview
- 12.2.12.2. Products
- 12.2.12.3. SWOT Analysis
- 12.2.12.4. Recent Developments
- 12.2.12.5. Financials (Based on Availability)
- 12.2.13 Amazon com Inc
- 12.2.13.1. Overview
- 12.2.13.2. Products
- 12.2.13.3. SWOT Analysis
- 12.2.13.4. Recent Developments
- 12.2.13.5. Financials (Based on Availability)
- 12.2.14 NXP Semiconductors
- 12.2.14.1. Overview
- 12.2.14.2. Products
- 12.2.14.3. SWOT Analysis
- 12.2.14.4. Recent Developments
- 12.2.14.5. Financials (Based on Availability)
- 12.2.15 Caper Inc
- 12.2.15.1. Overview
- 12.2.15.2. Products
- 12.2.15.3. SWOT Analysis
- 12.2.15.4. Recent Developments
- 12.2.15.5. Financials (Based on Availability)
- 12.2.16 Ingenico Group
- 12.2.16.1. Overview
- 12.2.16.2. Products
- 12.2.16.3. SWOT Analysis
- 12.2.16.4. Recent Developments
- 12.2.16.5. Financials (Based on Availability)
- 12.2.17 Focal Systems Inc
- 12.2.17.1. Overview
- 12.2.17.2. Products
- 12.2.17.3. SWOT Analysis
- 12.2.17.4. Recent Developments
- 12.2.17.5. Financials (Based on Availability)
- 12.2.18 LG Display Co Ltd
- 12.2.18.1. Overview
- 12.2.18.2. Products
- 12.2.18.3. SWOT Analysis
- 12.2.18.4. Recent Developments
- 12.2.18.5. Financials (Based on Availability)
- 12.2.19 NCR Corporation*List Not Exhaustive
- 12.2.19.1. Overview
- 12.2.19.2. Products
- 12.2.19.3. SWOT Analysis
- 12.2.19.4. Recent Developments
- 12.2.19.5. Financials (Based on Availability)
- 12.2.1 Google LLC
List of Figures
- Figure 1: Global Smart Retail Market Revenue Breakdown (Million, %) by Region 2024 & 2032
- Figure 2: Global Smart Retail Market Volume Breakdown (Billion, %) by Region 2024 & 2032
- Figure 3: North America Smart Retail Market Revenue (Million), by Component 2024 & 2032
- Figure 4: North America Smart Retail Market Volume (Billion), by Component 2024 & 2032
- Figure 5: North America Smart Retail Market Revenue Share (%), by Component 2024 & 2032
- Figure 6: North America Smart Retail Market Volume Share (%), by Component 2024 & 2032
- Figure 7: North America Smart Retail Market Revenue (Million), by Application 2024 & 2032
- Figure 8: North America Smart Retail Market Volume (Billion), by Application 2024 & 2032
- Figure 9: North America Smart Retail Market Revenue Share (%), by Application 2024 & 2032
- Figure 10: North America Smart Retail Market Volume Share (%), by Application 2024 & 2032
- Figure 11: North America Smart Retail Market Revenue (Million), by Country 2024 & 2032
- Figure 12: North America Smart Retail Market Volume (Billion), by Country 2024 & 2032
- Figure 13: North America Smart Retail Market Revenue Share (%), by Country 2024 & 2032
- Figure 14: North America Smart Retail Market Volume Share (%), by Country 2024 & 2032
- Figure 15: Europe Smart Retail Market Revenue (Million), by Component 2024 & 2032
- Figure 16: Europe Smart Retail Market Volume (Billion), by Component 2024 & 2032
- Figure 17: Europe Smart Retail Market Revenue Share (%), by Component 2024 & 2032
- Figure 18: Europe Smart Retail Market Volume Share (%), by Component 2024 & 2032
- Figure 19: Europe Smart Retail Market Revenue (Million), by Application 2024 & 2032
- Figure 20: Europe Smart Retail Market Volume (Billion), by Application 2024 & 2032
- Figure 21: Europe Smart Retail Market Revenue Share (%), by Application 2024 & 2032
- Figure 22: Europe Smart Retail Market Volume Share (%), by Application 2024 & 2032
- Figure 23: Europe Smart Retail Market Revenue (Million), by Country 2024 & 2032
- Figure 24: Europe Smart Retail Market Volume (Billion), by Country 2024 & 2032
- Figure 25: Europe Smart Retail Market Revenue Share (%), by Country 2024 & 2032
- Figure 26: Europe Smart Retail Market Volume Share (%), by Country 2024 & 2032
- Figure 27: Asia Smart Retail Market Revenue (Million), by Component 2024 & 2032
- Figure 28: Asia Smart Retail Market Volume (Billion), by Component 2024 & 2032
- Figure 29: Asia Smart Retail Market Revenue Share (%), by Component 2024 & 2032
- Figure 30: Asia Smart Retail Market Volume Share (%), by Component 2024 & 2032
- Figure 31: Asia Smart Retail Market Revenue (Million), by Application 2024 & 2032
- Figure 32: Asia Smart Retail Market Volume (Billion), by Application 2024 & 2032
- Figure 33: Asia Smart Retail Market Revenue Share (%), by Application 2024 & 2032
- Figure 34: Asia Smart Retail Market Volume Share (%), by Application 2024 & 2032
- Figure 35: Asia Smart Retail Market Revenue (Million), by Country 2024 & 2032
- Figure 36: Asia Smart Retail Market Volume (Billion), by Country 2024 & 2032
- Figure 37: Asia Smart Retail Market Revenue Share (%), by Country 2024 & 2032
- Figure 38: Asia Smart Retail Market Volume Share (%), by Country 2024 & 2032
- Figure 39: Australia and New Zealand Smart Retail Market Revenue (Million), by Component 2024 & 2032
- Figure 40: Australia and New Zealand Smart Retail Market Volume (Billion), by Component 2024 & 2032
- Figure 41: Australia and New Zealand Smart Retail Market Revenue Share (%), by Component 2024 & 2032
- Figure 42: Australia and New Zealand Smart Retail Market Volume Share (%), by Component 2024 & 2032
- Figure 43: Australia and New Zealand Smart Retail Market Revenue (Million), by Application 2024 & 2032
- Figure 44: Australia and New Zealand Smart Retail Market Volume (Billion), by Application 2024 & 2032
- Figure 45: Australia and New Zealand Smart Retail Market Revenue Share (%), by Application 2024 & 2032
- Figure 46: Australia and New Zealand Smart Retail Market Volume Share (%), by Application 2024 & 2032
- Figure 47: Australia and New Zealand Smart Retail Market Revenue (Million), by Country 2024 & 2032
- Figure 48: Australia and New Zealand Smart Retail Market Volume (Billion), by Country 2024 & 2032
- Figure 49: Australia and New Zealand Smart Retail Market Revenue Share (%), by Country 2024 & 2032
- Figure 50: Australia and New Zealand Smart Retail Market Volume Share (%), by Country 2024 & 2032
- Figure 51: Latin America Smart Retail Market Revenue (Million), by Component 2024 & 2032
- Figure 52: Latin America Smart Retail Market Volume (Billion), by Component 2024 & 2032
- Figure 53: Latin America Smart Retail Market Revenue Share (%), by Component 2024 & 2032
- Figure 54: Latin America Smart Retail Market Volume Share (%), by Component 2024 & 2032
- Figure 55: Latin America Smart Retail Market Revenue (Million), by Application 2024 & 2032
- Figure 56: Latin America Smart Retail Market Volume (Billion), by Application 2024 & 2032
- Figure 57: Latin America Smart Retail Market Revenue Share (%), by Application 2024 & 2032
- Figure 58: Latin America Smart Retail Market Volume Share (%), by Application 2024 & 2032
- Figure 59: Latin America Smart Retail Market Revenue (Million), by Country 2024 & 2032
- Figure 60: Latin America Smart Retail Market Volume (Billion), by Country 2024 & 2032
- Figure 61: Latin America Smart Retail Market Revenue Share (%), by Country 2024 & 2032
- Figure 62: Latin America Smart Retail Market Volume Share (%), by Country 2024 & 2032
- Figure 63: Middle East and Africa Smart Retail Market Revenue (Million), by Component 2024 & 2032
- Figure 64: Middle East and Africa Smart Retail Market Volume (Billion), by Component 2024 & 2032
- Figure 65: Middle East and Africa Smart Retail Market Revenue Share (%), by Component 2024 & 2032
- Figure 66: Middle East and Africa Smart Retail Market Volume Share (%), by Component 2024 & 2032
- Figure 67: Middle East and Africa Smart Retail Market Revenue (Million), by Application 2024 & 2032
- Figure 68: Middle East and Africa Smart Retail Market Volume (Billion), by Application 2024 & 2032
- Figure 69: Middle East and Africa Smart Retail Market Revenue Share (%), by Application 2024 & 2032
- Figure 70: Middle East and Africa Smart Retail Market Volume Share (%), by Application 2024 & 2032
- Figure 71: Middle East and Africa Smart Retail Market Revenue (Million), by Country 2024 & 2032
- Figure 72: Middle East and Africa Smart Retail Market Volume (Billion), by Country 2024 & 2032
- Figure 73: Middle East and Africa Smart Retail Market Revenue Share (%), by Country 2024 & 2032
- Figure 74: Middle East and Africa Smart Retail Market Volume Share (%), by Country 2024 & 2032
List of Tables
- Table 1: Global Smart Retail Market Revenue Million Forecast, by Region 2019 & 2032
- Table 2: Global Smart Retail Market Volume Billion Forecast, by Region 2019 & 2032
- Table 3: Global Smart Retail Market Revenue Million Forecast, by Component 2019 & 2032
- Table 4: Global Smart Retail Market Volume Billion Forecast, by Component 2019 & 2032
- Table 5: Global Smart Retail Market Revenue Million Forecast, by Application 2019 & 2032
- Table 6: Global Smart Retail Market Volume Billion Forecast, by Application 2019 & 2032
- Table 7: Global Smart Retail Market Revenue Million Forecast, by Region 2019 & 2032
- Table 8: Global Smart Retail Market Volume Billion Forecast, by Region 2019 & 2032
- Table 9: Global Smart Retail Market Revenue Million Forecast, by Component 2019 & 2032
- Table 10: Global Smart Retail Market Volume Billion Forecast, by Component 2019 & 2032
- Table 11: Global Smart Retail Market Revenue Million Forecast, by Application 2019 & 2032
- Table 12: Global Smart Retail Market Volume Billion Forecast, by Application 2019 & 2032
- Table 13: Global Smart Retail Market Revenue Million Forecast, by Country 2019 & 2032
- Table 14: Global Smart Retail Market Volume Billion Forecast, by Country 2019 & 2032
- Table 15: Global Smart Retail Market Revenue Million Forecast, by Component 2019 & 2032
- Table 16: Global Smart Retail Market Volume Billion Forecast, by Component 2019 & 2032
- Table 17: Global Smart Retail Market Revenue Million Forecast, by Application 2019 & 2032
- Table 18: Global Smart Retail Market Volume Billion Forecast, by Application 2019 & 2032
- Table 19: Global Smart Retail Market Revenue Million Forecast, by Country 2019 & 2032
- Table 20: Global Smart Retail Market Volume Billion Forecast, by Country 2019 & 2032
- Table 21: Global Smart Retail Market Revenue Million Forecast, by Component 2019 & 2032
- Table 22: Global Smart Retail Market Volume Billion Forecast, by Component 2019 & 2032
- Table 23: Global Smart Retail Market Revenue Million Forecast, by Application 2019 & 2032
- Table 24: Global Smart Retail Market Volume Billion Forecast, by Application 2019 & 2032
- Table 25: Global Smart Retail Market Revenue Million Forecast, by Country 2019 & 2032
- Table 26: Global Smart Retail Market Volume Billion Forecast, by Country 2019 & 2032
- Table 27: Global Smart Retail Market Revenue Million Forecast, by Component 2019 & 2032
- Table 28: Global Smart Retail Market Volume Billion Forecast, by Component 2019 & 2032
- Table 29: Global Smart Retail Market Revenue Million Forecast, by Application 2019 & 2032
- Table 30: Global Smart Retail Market Volume Billion Forecast, by Application 2019 & 2032
- Table 31: Global Smart Retail Market Revenue Million Forecast, by Country 2019 & 2032
- Table 32: Global Smart Retail Market Volume Billion Forecast, by Country 2019 & 2032
- Table 33: Global Smart Retail Market Revenue Million Forecast, by Component 2019 & 2032
- Table 34: Global Smart Retail Market Volume Billion Forecast, by Component 2019 & 2032
- Table 35: Global Smart Retail Market Revenue Million Forecast, by Application 2019 & 2032
- Table 36: Global Smart Retail Market Volume Billion Forecast, by Application 2019 & 2032
- Table 37: Global Smart Retail Market Revenue Million Forecast, by Country 2019 & 2032
- Table 38: Global Smart Retail Market Volume Billion Forecast, by Country 2019 & 2032
- Table 39: Global Smart Retail Market Revenue Million Forecast, by Component 2019 & 2032
- Table 40: Global Smart Retail Market Volume Billion Forecast, by Component 2019 & 2032
- Table 41: Global Smart Retail Market Revenue Million Forecast, by Application 2019 & 2032
- Table 42: Global Smart Retail Market Volume Billion Forecast, by Application 2019 & 2032
- Table 43: Global Smart Retail Market Revenue Million Forecast, by Country 2019 & 2032
- Table 44: Global Smart Retail Market Volume Billion Forecast, by Country 2019 & 2032
Frequently Asked Questions
1. What is the projected Compound Annual Growth Rate (CAGR) of the Smart Retail Market?
The projected CAGR is approximately 22.23%.
2. Which companies are prominent players in the Smart Retail Market?
Key companies in the market include Google LLC, PAX Global Technology Limited, Intel Corporation, Verifone Systems, Cisco Systems Inc, Huawei Technologies Co Ltd, IBM Corporation, Fiserv Inc, Microsoft, Honeywell International Inc, NVIDIA Corporation, Samsung Electronics, Amazon com Inc, NXP Semiconductors, Caper Inc, Ingenico Group, Focal Systems Inc, LG Display Co Ltd, NCR Corporation*List Not Exhaustive.
3. What are the main segments of the Smart Retail Market?
The market segments include Component, Application.
4. Can you provide details about the market size?
The market size is estimated to be USD 25.10 Million as of 2022.
5. What are some drivers contributing to market growth?
Growing Investments in Retail Chains and Retail Supermarkets; Rising Adoption of Advances in Technology Across Retail Chain.
6. What are the notable trends driving market growth?
Inventory Managment Segment is Expected to Hold Significant Market Share.
7. Are there any restraints impacting market growth?
Growing Investments in Retail Chains and Retail Supermarkets; Rising Adoption of Advances in Technology Across Retail Chain.
8. Can you provide examples of recent developments in the market?
June 2024: Instacart, in collaboration with Price Chopper and McKeever's Market & Eatery, announced the introduction of Caper Carts, which are powered by artificial intelligence, at select locations in Missouri. These innovative smart carts enhance the shopping experience by enabling customers to scan items while they shop easily, monitor their grocery budget in real time, and bypass the checkout line altogether.
9. What pricing options are available for accessing the report?
Pricing options include single-user, multi-user, and enterprise licenses priced at USD 4750, USD 5250, and USD 8750 respectively.
10. Is the market size provided in terms of value or volume?
The market size is provided in terms of value, measured in Million and volume, measured in Billion.
11. Are there any specific market keywords associated with the report?
Yes, the market keyword associated with the report is "Smart Retail Market," which aids in identifying and referencing the specific market segment covered.
12. How do I determine which pricing option suits my needs best?
The pricing options vary based on user requirements and access needs. Individual users may opt for single-user licenses, while businesses requiring broader access may choose multi-user or enterprise licenses for cost-effective access to the report.
13. Are there any additional resources or data provided in the Smart Retail Market report?
While the report offers comprehensive insights, it's advisable to review the specific contents or supplementary materials provided to ascertain if additional resources or data are available.
14. How can I stay updated on further developments or reports in the Smart Retail Market?
To stay informed about further developments, trends, and reports in the Smart Retail Market, consider subscribing to industry newsletters, following relevant companies and organizations, or regularly checking reputable industry news sources and publications.
Methodology
Step 1 - Identification of Relevant Samples Size from Population Database


Step 2 - Approaches for Defining Global Market Size (Value, Volume* & Price*)

Note*: In applicable scenarios
Step 3 - Data Sources
Primary Research
- Web Analytics
- Survey Reports
- Research Institute
- Latest Research Reports
- Opinion Leaders
Secondary Research
- Annual Reports
- White Paper
- Latest Press Release
- Industry Association
- Paid Database
- Investor Presentations

Step 4 - Data Triangulation
Involves using different sources of information in order to increase the validity of a study
These sources are likely to be stakeholders in a program - participants, other researchers, program staff, other community members, and so on.
Then we put all data in single framework & apply various statistical tools to find out the dynamic on the market.
During the analysis stage, feedback from the stakeholder groups would be compared to determine areas of agreement as well as areas of divergence


