
Key Insights
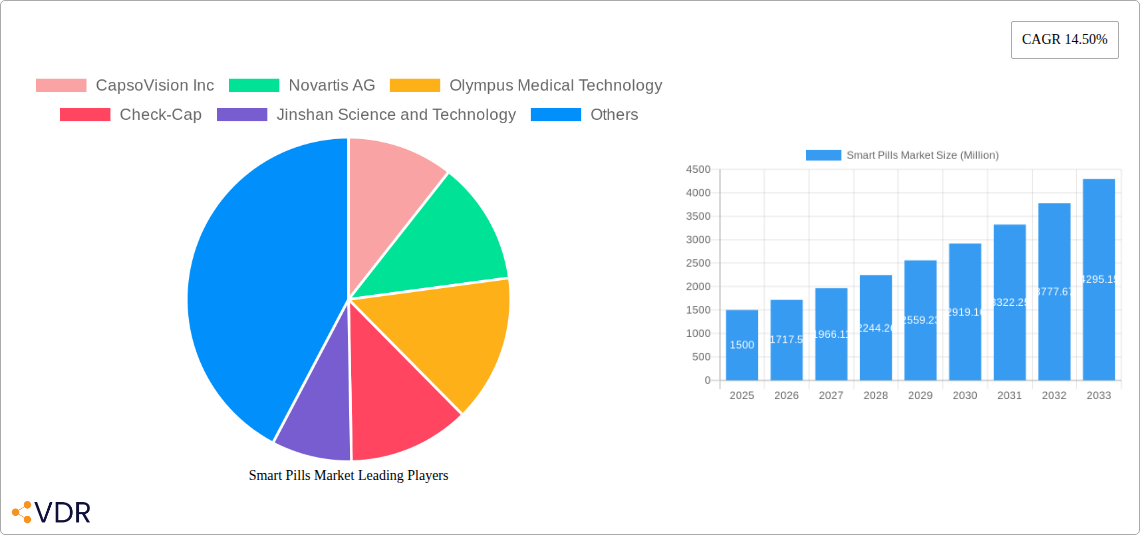
The Smart Pills market, encompassing applications like capsule endoscopy, colon capsule endoscopy, patient monitoring, and drug delivery, is experiencing robust growth, projected at a 14.50% CAGR from 2025 to 2033. This expansion is driven by several factors. Technological advancements leading to miniaturization and enhanced functionalities of smart pills are key. The increasing prevalence of chronic diseases such as Crohn's disease, Celiac disease, and various gastrointestinal disorders fuels demand for minimally invasive diagnostic and therapeutic solutions. Moreover, the rising adoption of telehealth and remote patient monitoring further contributes to market growth, as these technologies facilitate easier data acquisition and analysis from smart pills. The market is segmented by application (Capsule Endoscopy, Colon Capsule Endoscopy, Patient Monitoring, Drug Delivery) and disease indication (Occult GI Bleeding, Crohn's Disease, Small Bowel Tumors, Celiac Disease, Inherited Polyposis Syndromes, Neurological Disorders, Other Disease Indications). While regulatory hurdles and high initial investment costs pose some challenges, the overall market outlook remains positive, fueled by continuous innovation and increasing patient preference for less invasive procedures.
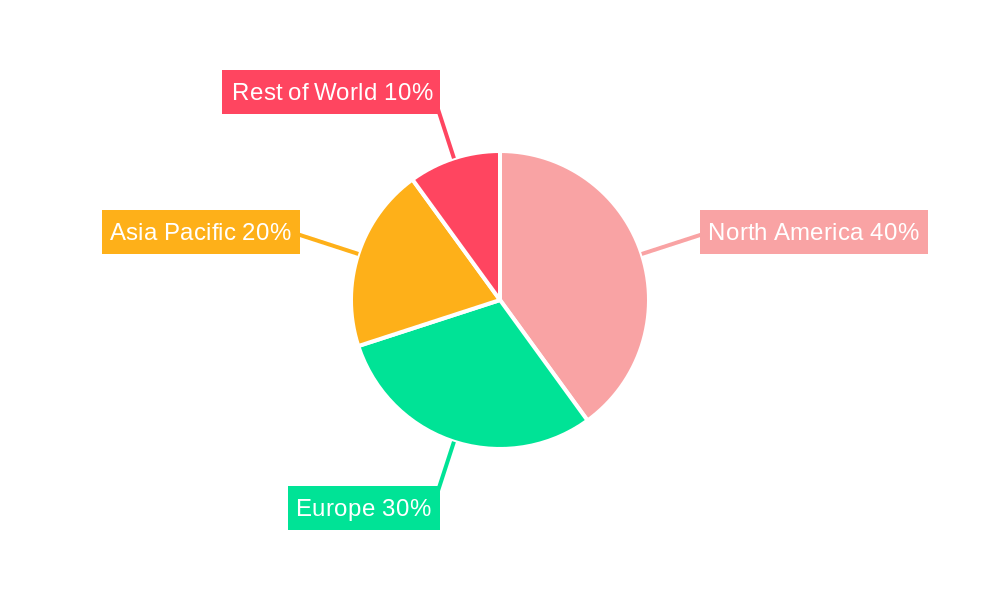
The geographical distribution of the Smart Pills market reflects varying healthcare infrastructure and technological adoption rates across different regions. North America, with its advanced healthcare infrastructure and high adoption of innovative medical technologies, currently holds a significant market share. However, Asia Pacific is projected to witness substantial growth in the coming years due to rising healthcare expenditure, increasing prevalence of target diseases, and growing awareness among consumers. Europe also presents a significant market, driven by strong regulatory frameworks and a large patient population. The competitive landscape includes established players like Novartis AG, Olympus Medical Technology, and Medtronic PLC, alongside emerging companies like CapsoVision Inc. and Check-Cap, constantly innovating to improve smart pill technology and expand market penetration. This competitive dynamic drives further innovation and cost optimization, ultimately benefiting patients and the healthcare system.
Smart Pills Market: A Comprehensive Market Report (2019-2033)
This in-depth report provides a comprehensive analysis of the Smart Pills Market, encompassing market dynamics, growth trends, regional dominance, product landscape, challenges, opportunities, key players, and notable milestones. The study period covers 2019-2033, with 2025 as the base and estimated year. The forecast period spans 2025-2033, and the historical period is 2019-2024. The report segments the market by Application Area (Capsule Endoscopy, Colon Capsule Endoscopy, Patient Monitoring, Drug Delivery) and Disease Indication (Occult GI Bleeding, Crohn's Disease, Small Bowel Tumors, Celiac Disease, Inherited Polyposis Syndromes, Neurological Disorders, Other Disease Indications), offering granular insights into this rapidly evolving sector. The market size is valued in million units.
Smart Pills Market Market Dynamics & Structure
The Smart Pills market is characterized by moderate concentration, with a few key players dominating specific segments. Technological innovation, particularly in sensor miniaturization and data analytics, is a primary growth driver. Stringent regulatory frameworks governing medical devices and pharmaceuticals significantly influence market entry and product approvals. Competitive pressure arises from both established players and emerging startups developing innovative solutions. The market witnesses consistent M&A activity, driven by companies seeking to expand their product portfolios and technological capabilities.
- Market Concentration: Moderately concentrated, with top 5 players holding xx% market share in 2024.
- Technological Innovation: Miniaturization of sensors, advancements in data analytics, and improved power sources are key drivers.
- Regulatory Landscape: Stringent FDA and EMA approvals significantly impact market entry.
- Competitive Landscape: Intense competition from established players and emerging startups.
- M&A Activity: A significant number of M&A deals (xx) were recorded between 2019-2024, signifying market consolidation.
- End-User Demographics: Growing geriatric population and increasing prevalence of chronic diseases are major drivers.
Smart Pills Market Growth Trends & Insights
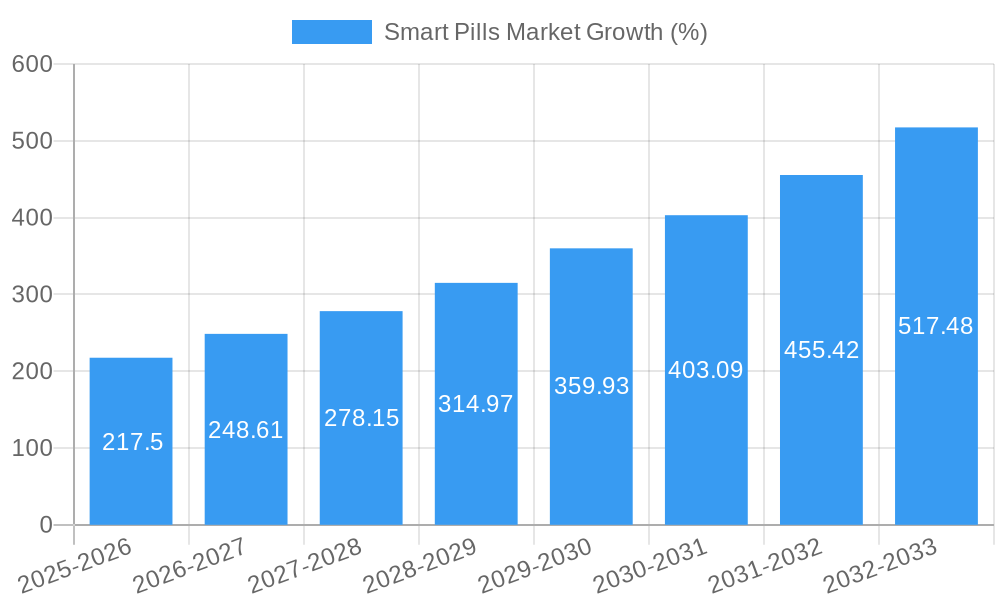
The Smart Pills market exhibits robust growth, driven by factors such as the rising prevalence of chronic diseases, increasing demand for personalized medicine, and technological advancements in drug delivery systems. Market size is projected to reach xx million units by 2033, exhibiting a CAGR of xx% during the forecast period. Adoption rates are increasing steadily, particularly in developed regions. Technological disruptions, such as the integration of AI and IoT, further enhance the efficacy and usability of smart pills, driving market expansion. Consumer behavior shifts toward proactive healthcare management and personalized treatments contribute to increased demand.
Dominant Regions, Countries, or Segments in Smart Pills Market
North America currently holds the largest market share in the Smart Pills market, followed by Europe. This dominance is attributed to factors such as robust healthcare infrastructure, high adoption rates of advanced medical technologies, and favorable regulatory environments. Within application areas, Capsule Endoscopy and Colon Capsule Endoscopy demonstrate the highest growth potential. Similarly, the treatment of Occult GI Bleeding and Crohn’s Disease drives significant demand within disease indications.
- North America: High healthcare expenditure, early adoption of new technologies, and strong regulatory frameworks drive market growth.
- Europe: Expanding healthcare infrastructure and increasing prevalence of chronic diseases contribute to market expansion.
- Asia-Pacific: Rapidly growing healthcare sector and increasing disposable incomes are fueling market growth.
- Capsule Endoscopy & Colon Capsule Endoscopy: High demand due to minimally invasive procedures and improved diagnostic capabilities.
- Occult GI Bleeding & Crohn's Disease: High prevalence and the need for effective treatment methods propel segment growth.
Smart Pills Market Product Landscape
The smart pills market showcases diverse product offerings, ranging from simple ingestible sensors to sophisticated drug delivery systems integrated with advanced data analytics capabilities. These devices offer unique selling propositions such as real-time patient monitoring, improved drug efficacy, and reduced side effects. Technological advancements are focused on enhancing sensor miniaturization, improving data transmission capabilities, and developing biodegradable materials.
Key Drivers, Barriers & Challenges in Smart Pills Market
Key Drivers: Rising prevalence of chronic diseases, increasing demand for personalized medicine, technological advancements in miniaturization and data analytics, supportive regulatory frameworks in certain regions.
Challenges & Restraints: High development costs, stringent regulatory approvals, concerns regarding patient privacy and data security, potential supply chain disruptions, competition from traditional drug delivery methods, limited reimbursement policies in some regions resulting in xx% reduction in market accessibility.
Emerging Opportunities in Smart Pills Market
Untapped markets in developing economies offer significant growth opportunities. Innovative applications in areas like mental health and oncology are emerging. The integration of AI and machine learning for personalized treatment regimens and improved data analysis offers immense potential. Evolving consumer preferences towards convenient and personalized healthcare solutions further support market expansion.
Growth Accelerators in the Smart Pills Market Industry
Technological breakthroughs in sensor technology and data analytics are driving market growth. Strategic partnerships between pharmaceutical companies and technology developers are fostering innovation. Market expansion into emerging economies with unmet medical needs presents significant growth opportunities.
Key Players Shaping the Smart Pills Market Market
- CapsoVision Inc
- Novartis AG
- Olympus Medical Technology
- Check-Cap
- Jinshan Science and Technology
- Intromedic
- Pentax Medical (Hoya)
- Medtronic PLC
- Otsuka Pharmaceutical Co Ltd
- etectRx Inc
- Koninklijke Philips NV (Medimetrics)
- Pixie Scientific
- HQ Inc
Notable Milestones in Smart Pills Market Sector
- September 2022: HealthBeacon plc launched its HB Smart Pills Management System.
- January 2022: Novo Nordisk launched the anti-diabetes pill semaglutide in India.
In-Depth Smart Pills Market Market Outlook
The Smart Pills market is poised for significant growth driven by continued technological advancements, increasing prevalence of chronic diseases, and expanding market penetration in emerging economies. Strategic partnerships and innovative product development will play a crucial role in shaping the future of this dynamic market. The focus on personalized medicine and real-time patient monitoring will further enhance market expansion and create lucrative opportunities for industry stakeholders.
Smart Pills Market Segmentation
-
1. Application Area
-
1.1. Capsule Endoscopy
- 1.1.1. Small Bowel Video Capsule Endoscopy
- 1.1.2. Colon Capsule Endoscopy
- 1.2. Patient Monitoring
- 1.3. Drug Delivery
-
1.1. Capsule Endoscopy
-
2. Disease Indication
- 2.1. Occult GI Bleeding
- 2.2. Crohn's Disease
- 2.3. Small Bowel Tumors
- 2.4. Celiac Disease
- 2.5. Inherited Polyposis Syndromes
- 2.6. Neurological Disorders
- 2.7. Other Disease Indications
Smart Pills Market Segmentation By Geography
-
1. North America
- 1.1. United States
- 1.2. Canada
- 1.3. Mexico
-
2. Europe
- 2.1. Germany
- 2.2. United Kingdom
- 2.3. France
- 2.4. Italy
- 2.5. Spain
- 2.6. Rest of Europe
-
3. Asia Pacific
- 3.1. China
- 3.2. Japan
- 3.3. India
- 3.4. Australia
- 3.5. South Korea
- 3.6. Rest of Asia Pacific
-
4. Middle East and Africa
- 4.1. GCC
- 4.2. South Africa
- 4.3. Rest of Middle East and Africa
-
5. South America
- 5.1. Brazil
- 5.2. Argentina
- 5.3. Rest of South America
Smart Pills Market REPORT HIGHLIGHTS
| Aspects | Details |
|---|---|
| Study Period | 2019-2033 |
| Base Year | 2024 |
| Estimated Year | 2025 |
| Forecast Period | 2025-2033 |
| Historical Period | 2019-2024 |
| Growth Rate | CAGR of 14.50% from 2019-2033 |
| Segmentation |
|
Table of Contents
- 1. Introduction
- 1.1. Research Scope
- 1.2. Market Segmentation
- 1.3. Research Methodology
- 1.4. Definitions and Assumptions
- 2. Executive Summary
- 2.1. Introduction
- 3. Market Dynamics
- 3.1. Introduction
- 3.2. Market Drivers
- 3.2.1. Increasing Preference for Minimally-invasive Devices; Rising Burden of Gastrointestinal Disorders; Technological Advancements
- 3.3. Market Restrains
- 3.3.1. Increasing Cost with Technological Advancements; Potential Health Risks
- 3.4. Market Trends
- 3.4.1. Capsule Endoscopy is Expected to Witness High Growth Over the Forecast Period
- 4. Market Factor Analysis
- 4.1. Porters Five Forces
- 4.2. Supply/Value Chain
- 4.3. PESTEL analysis
- 4.4. Market Entropy
- 4.5. Patent/Trademark Analysis
- 5. Global Smart Pills Market Analysis, Insights and Forecast, 2019-2031
- 5.1. Market Analysis, Insights and Forecast - by Application Area
- 5.1.1. Capsule Endoscopy
- 5.1.1.1. Small Bowel Video Capsule Endoscopy
- 5.1.1.2. Colon Capsule Endoscopy
- 5.1.2. Patient Monitoring
- 5.1.3. Drug Delivery
- 5.1.1. Capsule Endoscopy
- 5.2. Market Analysis, Insights and Forecast - by Disease Indication
- 5.2.1. Occult GI Bleeding
- 5.2.2. Crohn's Disease
- 5.2.3. Small Bowel Tumors
- 5.2.4. Celiac Disease
- 5.2.5. Inherited Polyposis Syndromes
- 5.2.6. Neurological Disorders
- 5.2.7. Other Disease Indications
- 5.3. Market Analysis, Insights and Forecast - by Region
- 5.3.1. North America
- 5.3.2. Europe
- 5.3.3. Asia Pacific
- 5.3.4. Middle East and Africa
- 5.3.5. South America
- 5.1. Market Analysis, Insights and Forecast - by Application Area
- 6. North America Smart Pills Market Analysis, Insights and Forecast, 2019-2031
- 6.1. Market Analysis, Insights and Forecast - by Application Area
- 6.1.1. Capsule Endoscopy
- 6.1.1.1. Small Bowel Video Capsule Endoscopy
- 6.1.1.2. Colon Capsule Endoscopy
- 6.1.2. Patient Monitoring
- 6.1.3. Drug Delivery
- 6.1.1. Capsule Endoscopy
- 6.2. Market Analysis, Insights and Forecast - by Disease Indication
- 6.2.1. Occult GI Bleeding
- 6.2.2. Crohn's Disease
- 6.2.3. Small Bowel Tumors
- 6.2.4. Celiac Disease
- 6.2.5. Inherited Polyposis Syndromes
- 6.2.6. Neurological Disorders
- 6.2.7. Other Disease Indications
- 6.1. Market Analysis, Insights and Forecast - by Application Area
- 7. Europe Smart Pills Market Analysis, Insights and Forecast, 2019-2031
- 7.1. Market Analysis, Insights and Forecast - by Application Area
- 7.1.1. Capsule Endoscopy
- 7.1.1.1. Small Bowel Video Capsule Endoscopy
- 7.1.1.2. Colon Capsule Endoscopy
- 7.1.2. Patient Monitoring
- 7.1.3. Drug Delivery
- 7.1.1. Capsule Endoscopy
- 7.2. Market Analysis, Insights and Forecast - by Disease Indication
- 7.2.1. Occult GI Bleeding
- 7.2.2. Crohn's Disease
- 7.2.3. Small Bowel Tumors
- 7.2.4. Celiac Disease
- 7.2.5. Inherited Polyposis Syndromes
- 7.2.6. Neurological Disorders
- 7.2.7. Other Disease Indications
- 7.1. Market Analysis, Insights and Forecast - by Application Area
- 8. Asia Pacific Smart Pills Market Analysis, Insights and Forecast, 2019-2031
- 8.1. Market Analysis, Insights and Forecast - by Application Area
- 8.1.1. Capsule Endoscopy
- 8.1.1.1. Small Bowel Video Capsule Endoscopy
- 8.1.1.2. Colon Capsule Endoscopy
- 8.1.2. Patient Monitoring
- 8.1.3. Drug Delivery
- 8.1.1. Capsule Endoscopy
- 8.2. Market Analysis, Insights and Forecast - by Disease Indication
- 8.2.1. Occult GI Bleeding
- 8.2.2. Crohn's Disease
- 8.2.3. Small Bowel Tumors
- 8.2.4. Celiac Disease
- 8.2.5. Inherited Polyposis Syndromes
- 8.2.6. Neurological Disorders
- 8.2.7. Other Disease Indications
- 8.1. Market Analysis, Insights and Forecast - by Application Area
- 9. Middle East and Africa Smart Pills Market Analysis, Insights and Forecast, 2019-2031
- 9.1. Market Analysis, Insights and Forecast - by Application Area
- 9.1.1. Capsule Endoscopy
- 9.1.1.1. Small Bowel Video Capsule Endoscopy
- 9.1.1.2. Colon Capsule Endoscopy
- 9.1.2. Patient Monitoring
- 9.1.3. Drug Delivery
- 9.1.1. Capsule Endoscopy
- 9.2. Market Analysis, Insights and Forecast - by Disease Indication
- 9.2.1. Occult GI Bleeding
- 9.2.2. Crohn's Disease
- 9.2.3. Small Bowel Tumors
- 9.2.4. Celiac Disease
- 9.2.5. Inherited Polyposis Syndromes
- 9.2.6. Neurological Disorders
- 9.2.7. Other Disease Indications
- 9.1. Market Analysis, Insights and Forecast - by Application Area
- 10. South America Smart Pills Market Analysis, Insights and Forecast, 2019-2031
- 10.1. Market Analysis, Insights and Forecast - by Application Area
- 10.1.1. Capsule Endoscopy
- 10.1.1.1. Small Bowel Video Capsule Endoscopy
- 10.1.1.2. Colon Capsule Endoscopy
- 10.1.2. Patient Monitoring
- 10.1.3. Drug Delivery
- 10.1.1. Capsule Endoscopy
- 10.2. Market Analysis, Insights and Forecast - by Disease Indication
- 10.2.1. Occult GI Bleeding
- 10.2.2. Crohn's Disease
- 10.2.3. Small Bowel Tumors
- 10.2.4. Celiac Disease
- 10.2.5. Inherited Polyposis Syndromes
- 10.2.6. Neurological Disorders
- 10.2.7. Other Disease Indications
- 10.1. Market Analysis, Insights and Forecast - by Application Area
- 11. North America Smart Pills Market Analysis, Insights and Forecast, 2019-2031
- 11.1. Market Analysis, Insights and Forecast - By Country/Sub-region
- 11.1.1 United States
- 11.1.2 Canada
- 11.1.3 Mexico
- 12. Europe Smart Pills Market Analysis, Insights and Forecast, 2019-2031
- 12.1. Market Analysis, Insights and Forecast - By Country/Sub-region
- 12.1.1 Germany
- 12.1.2 United Kingdom
- 12.1.3 France
- 12.1.4 Italy
- 12.1.5 Spain
- 12.1.6 Rest of Europe
- 13. Asia Pacific Smart Pills Market Analysis, Insights and Forecast, 2019-2031
- 13.1. Market Analysis, Insights and Forecast - By Country/Sub-region
- 13.1.1 China
- 13.1.2 Japan
- 13.1.3 India
- 13.1.4 Australia
- 13.1.5 South Korea
- 13.1.6 Rest of Asia Pacific
- 14. Middle East and Africa Smart Pills Market Analysis, Insights and Forecast, 2019-2031
- 14.1. Market Analysis, Insights and Forecast - By Country/Sub-region
- 14.1.1 GCC
- 14.1.2 South Africa
- 14.1.3 Rest of Middle East and Africa
- 15. South America Smart Pills Market Analysis, Insights and Forecast, 2019-2031
- 15.1. Market Analysis, Insights and Forecast - By Country/Sub-region
- 15.1.1 Brazil
- 15.1.2 Argentina
- 15.1.3 Rest of South America
- 16. Competitive Analysis
- 16.1. Global Market Share Analysis 2024
- 16.2. Company Profiles
- 16.2.1 CapsoVision Inc
- 16.2.1.1. Overview
- 16.2.1.2. Products
- 16.2.1.3. SWOT Analysis
- 16.2.1.4. Recent Developments
- 16.2.1.5. Financials (Based on Availability)
- 16.2.2 Novartis AG
- 16.2.2.1. Overview
- 16.2.2.2. Products
- 16.2.2.3. SWOT Analysis
- 16.2.2.4. Recent Developments
- 16.2.2.5. Financials (Based on Availability)
- 16.2.3 Olympus Medical Technology
- 16.2.3.1. Overview
- 16.2.3.2. Products
- 16.2.3.3. SWOT Analysis
- 16.2.3.4. Recent Developments
- 16.2.3.5. Financials (Based on Availability)
- 16.2.4 Check-Cap
- 16.2.4.1. Overview
- 16.2.4.2. Products
- 16.2.4.3. SWOT Analysis
- 16.2.4.4. Recent Developments
- 16.2.4.5. Financials (Based on Availability)
- 16.2.5 Jinshan Science and Technology
- 16.2.5.1. Overview
- 16.2.5.2. Products
- 16.2.5.3. SWOT Analysis
- 16.2.5.4. Recent Developments
- 16.2.5.5. Financials (Based on Availability)
- 16.2.6 Intromedic
- 16.2.6.1. Overview
- 16.2.6.2. Products
- 16.2.6.3. SWOT Analysis
- 16.2.6.4. Recent Developments
- 16.2.6.5. Financials (Based on Availability)
- 16.2.7 Pentax Medical (Hoya)
- 16.2.7.1. Overview
- 16.2.7.2. Products
- 16.2.7.3. SWOT Analysis
- 16.2.7.4. Recent Developments
- 16.2.7.5. Financials (Based on Availability)
- 16.2.8 Medtronic PLC
- 16.2.8.1. Overview
- 16.2.8.2. Products
- 16.2.8.3. SWOT Analysis
- 16.2.8.4. Recent Developments
- 16.2.8.5. Financials (Based on Availability)
- 16.2.9 Otsuka Pharmaceutical Co Ltd
- 16.2.9.1. Overview
- 16.2.9.2. Products
- 16.2.9.3. SWOT Analysis
- 16.2.9.4. Recent Developments
- 16.2.9.5. Financials (Based on Availability)
- 16.2.10 etectRx Inc
- 16.2.10.1. Overview
- 16.2.10.2. Products
- 16.2.10.3. SWOT Analysis
- 16.2.10.4. Recent Developments
- 16.2.10.5. Financials (Based on Availability)
- 16.2.11 Koninklijke Philips NV (Medimetrics)
- 16.2.11.1. Overview
- 16.2.11.2. Products
- 16.2.11.3. SWOT Analysis
- 16.2.11.4. Recent Developments
- 16.2.11.5. Financials (Based on Availability)
- 16.2.12 Pixie Scientific
- 16.2.12.1. Overview
- 16.2.12.2. Products
- 16.2.12.3. SWOT Analysis
- 16.2.12.4. Recent Developments
- 16.2.12.5. Financials (Based on Availability)
- 16.2.13 HQ Inc
- 16.2.13.1. Overview
- 16.2.13.2. Products
- 16.2.13.3. SWOT Analysis
- 16.2.13.4. Recent Developments
- 16.2.13.5. Financials (Based on Availability)
- 16.2.1 CapsoVision Inc
List of Figures
- Figure 1: Global Smart Pills Market Revenue Breakdown (Million, %) by Region 2024 & 2032
- Figure 2: Global Smart Pills Market Volume Breakdown (Dosage, %) by Region 2024 & 2032
- Figure 3: North America Smart Pills Market Revenue (Million), by Country 2024 & 2032
- Figure 4: North America Smart Pills Market Volume (Dosage), by Country 2024 & 2032
- Figure 5: North America Smart Pills Market Revenue Share (%), by Country 2024 & 2032
- Figure 6: North America Smart Pills Market Volume Share (%), by Country 2024 & 2032
- Figure 7: Europe Smart Pills Market Revenue (Million), by Country 2024 & 2032
- Figure 8: Europe Smart Pills Market Volume (Dosage), by Country 2024 & 2032
- Figure 9: Europe Smart Pills Market Revenue Share (%), by Country 2024 & 2032
- Figure 10: Europe Smart Pills Market Volume Share (%), by Country 2024 & 2032
- Figure 11: Asia Pacific Smart Pills Market Revenue (Million), by Country 2024 & 2032
- Figure 12: Asia Pacific Smart Pills Market Volume (Dosage), by Country 2024 & 2032
- Figure 13: Asia Pacific Smart Pills Market Revenue Share (%), by Country 2024 & 2032
- Figure 14: Asia Pacific Smart Pills Market Volume Share (%), by Country 2024 & 2032
- Figure 15: Middle East and Africa Smart Pills Market Revenue (Million), by Country 2024 & 2032
- Figure 16: Middle East and Africa Smart Pills Market Volume (Dosage), by Country 2024 & 2032
- Figure 17: Middle East and Africa Smart Pills Market Revenue Share (%), by Country 2024 & 2032
- Figure 18: Middle East and Africa Smart Pills Market Volume Share (%), by Country 2024 & 2032
- Figure 19: South America Smart Pills Market Revenue (Million), by Country 2024 & 2032
- Figure 20: South America Smart Pills Market Volume (Dosage), by Country 2024 & 2032
- Figure 21: South America Smart Pills Market Revenue Share (%), by Country 2024 & 2032
- Figure 22: South America Smart Pills Market Volume Share (%), by Country 2024 & 2032
- Figure 23: North America Smart Pills Market Revenue (Million), by Application Area 2024 & 2032
- Figure 24: North America Smart Pills Market Volume (Dosage), by Application Area 2024 & 2032
- Figure 25: North America Smart Pills Market Revenue Share (%), by Application Area 2024 & 2032
- Figure 26: North America Smart Pills Market Volume Share (%), by Application Area 2024 & 2032
- Figure 27: North America Smart Pills Market Revenue (Million), by Disease Indication 2024 & 2032
- Figure 28: North America Smart Pills Market Volume (Dosage), by Disease Indication 2024 & 2032
- Figure 29: North America Smart Pills Market Revenue Share (%), by Disease Indication 2024 & 2032
- Figure 30: North America Smart Pills Market Volume Share (%), by Disease Indication 2024 & 2032
- Figure 31: North America Smart Pills Market Revenue (Million), by Country 2024 & 2032
- Figure 32: North America Smart Pills Market Volume (Dosage), by Country 2024 & 2032
- Figure 33: North America Smart Pills Market Revenue Share (%), by Country 2024 & 2032
- Figure 34: North America Smart Pills Market Volume Share (%), by Country 2024 & 2032
- Figure 35: Europe Smart Pills Market Revenue (Million), by Application Area 2024 & 2032
- Figure 36: Europe Smart Pills Market Volume (Dosage), by Application Area 2024 & 2032
- Figure 37: Europe Smart Pills Market Revenue Share (%), by Application Area 2024 & 2032
- Figure 38: Europe Smart Pills Market Volume Share (%), by Application Area 2024 & 2032
- Figure 39: Europe Smart Pills Market Revenue (Million), by Disease Indication 2024 & 2032
- Figure 40: Europe Smart Pills Market Volume (Dosage), by Disease Indication 2024 & 2032
- Figure 41: Europe Smart Pills Market Revenue Share (%), by Disease Indication 2024 & 2032
- Figure 42: Europe Smart Pills Market Volume Share (%), by Disease Indication 2024 & 2032
- Figure 43: Europe Smart Pills Market Revenue (Million), by Country 2024 & 2032
- Figure 44: Europe Smart Pills Market Volume (Dosage), by Country 2024 & 2032
- Figure 45: Europe Smart Pills Market Revenue Share (%), by Country 2024 & 2032
- Figure 46: Europe Smart Pills Market Volume Share (%), by Country 2024 & 2032
- Figure 47: Asia Pacific Smart Pills Market Revenue (Million), by Application Area 2024 & 2032
- Figure 48: Asia Pacific Smart Pills Market Volume (Dosage), by Application Area 2024 & 2032
- Figure 49: Asia Pacific Smart Pills Market Revenue Share (%), by Application Area 2024 & 2032
- Figure 50: Asia Pacific Smart Pills Market Volume Share (%), by Application Area 2024 & 2032
- Figure 51: Asia Pacific Smart Pills Market Revenue (Million), by Disease Indication 2024 & 2032
- Figure 52: Asia Pacific Smart Pills Market Volume (Dosage), by Disease Indication 2024 & 2032
- Figure 53: Asia Pacific Smart Pills Market Revenue Share (%), by Disease Indication 2024 & 2032
- Figure 54: Asia Pacific Smart Pills Market Volume Share (%), by Disease Indication 2024 & 2032
- Figure 55: Asia Pacific Smart Pills Market Revenue (Million), by Country 2024 & 2032
- Figure 56: Asia Pacific Smart Pills Market Volume (Dosage), by Country 2024 & 2032
- Figure 57: Asia Pacific Smart Pills Market Revenue Share (%), by Country 2024 & 2032
- Figure 58: Asia Pacific Smart Pills Market Volume Share (%), by Country 2024 & 2032
- Figure 59: Middle East and Africa Smart Pills Market Revenue (Million), by Application Area 2024 & 2032
- Figure 60: Middle East and Africa Smart Pills Market Volume (Dosage), by Application Area 2024 & 2032
- Figure 61: Middle East and Africa Smart Pills Market Revenue Share (%), by Application Area 2024 & 2032
- Figure 62: Middle East and Africa Smart Pills Market Volume Share (%), by Application Area 2024 & 2032
- Figure 63: Middle East and Africa Smart Pills Market Revenue (Million), by Disease Indication 2024 & 2032
- Figure 64: Middle East and Africa Smart Pills Market Volume (Dosage), by Disease Indication 2024 & 2032
- Figure 65: Middle East and Africa Smart Pills Market Revenue Share (%), by Disease Indication 2024 & 2032
- Figure 66: Middle East and Africa Smart Pills Market Volume Share (%), by Disease Indication 2024 & 2032
- Figure 67: Middle East and Africa Smart Pills Market Revenue (Million), by Country 2024 & 2032
- Figure 68: Middle East and Africa Smart Pills Market Volume (Dosage), by Country 2024 & 2032
- Figure 69: Middle East and Africa Smart Pills Market Revenue Share (%), by Country 2024 & 2032
- Figure 70: Middle East and Africa Smart Pills Market Volume Share (%), by Country 2024 & 2032
- Figure 71: South America Smart Pills Market Revenue (Million), by Application Area 2024 & 2032
- Figure 72: South America Smart Pills Market Volume (Dosage), by Application Area 2024 & 2032
- Figure 73: South America Smart Pills Market Revenue Share (%), by Application Area 2024 & 2032
- Figure 74: South America Smart Pills Market Volume Share (%), by Application Area 2024 & 2032
- Figure 75: South America Smart Pills Market Revenue (Million), by Disease Indication 2024 & 2032
- Figure 76: South America Smart Pills Market Volume (Dosage), by Disease Indication 2024 & 2032
- Figure 77: South America Smart Pills Market Revenue Share (%), by Disease Indication 2024 & 2032
- Figure 78: South America Smart Pills Market Volume Share (%), by Disease Indication 2024 & 2032
- Figure 79: South America Smart Pills Market Revenue (Million), by Country 2024 & 2032
- Figure 80: South America Smart Pills Market Volume (Dosage), by Country 2024 & 2032
- Figure 81: South America Smart Pills Market Revenue Share (%), by Country 2024 & 2032
- Figure 82: South America Smart Pills Market Volume Share (%), by Country 2024 & 2032
List of Tables
- Table 1: Global Smart Pills Market Revenue Million Forecast, by Region 2019 & 2032
- Table 2: Global Smart Pills Market Volume Dosage Forecast, by Region 2019 & 2032
- Table 3: Global Smart Pills Market Revenue Million Forecast, by Application Area 2019 & 2032
- Table 4: Global Smart Pills Market Volume Dosage Forecast, by Application Area 2019 & 2032
- Table 5: Global Smart Pills Market Revenue Million Forecast, by Disease Indication 2019 & 2032
- Table 6: Global Smart Pills Market Volume Dosage Forecast, by Disease Indication 2019 & 2032
- Table 7: Global Smart Pills Market Revenue Million Forecast, by Region 2019 & 2032
- Table 8: Global Smart Pills Market Volume Dosage Forecast, by Region 2019 & 2032
- Table 9: Global Smart Pills Market Revenue Million Forecast, by Country 2019 & 2032
- Table 10: Global Smart Pills Market Volume Dosage Forecast, by Country 2019 & 2032
- Table 11: United States Smart Pills Market Revenue (Million) Forecast, by Application 2019 & 2032
- Table 12: United States Smart Pills Market Volume (Dosage) Forecast, by Application 2019 & 2032
- Table 13: Canada Smart Pills Market Revenue (Million) Forecast, by Application 2019 & 2032
- Table 14: Canada Smart Pills Market Volume (Dosage) Forecast, by Application 2019 & 2032
- Table 15: Mexico Smart Pills Market Revenue (Million) Forecast, by Application 2019 & 2032
- Table 16: Mexico Smart Pills Market Volume (Dosage) Forecast, by Application 2019 & 2032
- Table 17: Global Smart Pills Market Revenue Million Forecast, by Country 2019 & 2032
- Table 18: Global Smart Pills Market Volume Dosage Forecast, by Country 2019 & 2032
- Table 19: Germany Smart Pills Market Revenue (Million) Forecast, by Application 2019 & 2032
- Table 20: Germany Smart Pills Market Volume (Dosage) Forecast, by Application 2019 & 2032
- Table 21: United Kingdom Smart Pills Market Revenue (Million) Forecast, by Application 2019 & 2032
- Table 22: United Kingdom Smart Pills Market Volume (Dosage) Forecast, by Application 2019 & 2032
- Table 23: France Smart Pills Market Revenue (Million) Forecast, by Application 2019 & 2032
- Table 24: France Smart Pills Market Volume (Dosage) Forecast, by Application 2019 & 2032
- Table 25: Italy Smart Pills Market Revenue (Million) Forecast, by Application 2019 & 2032
- Table 26: Italy Smart Pills Market Volume (Dosage) Forecast, by Application 2019 & 2032
- Table 27: Spain Smart Pills Market Revenue (Million) Forecast, by Application 2019 & 2032
- Table 28: Spain Smart Pills Market Volume (Dosage) Forecast, by Application 2019 & 2032
- Table 29: Rest of Europe Smart Pills Market Revenue (Million) Forecast, by Application 2019 & 2032
- Table 30: Rest of Europe Smart Pills Market Volume (Dosage) Forecast, by Application 2019 & 2032
- Table 31: Global Smart Pills Market Revenue Million Forecast, by Country 2019 & 2032
- Table 32: Global Smart Pills Market Volume Dosage Forecast, by Country 2019 & 2032
- Table 33: China Smart Pills Market Revenue (Million) Forecast, by Application 2019 & 2032
- Table 34: China Smart Pills Market Volume (Dosage) Forecast, by Application 2019 & 2032
- Table 35: Japan Smart Pills Market Revenue (Million) Forecast, by Application 2019 & 2032
- Table 36: Japan Smart Pills Market Volume (Dosage) Forecast, by Application 2019 & 2032
- Table 37: India Smart Pills Market Revenue (Million) Forecast, by Application 2019 & 2032
- Table 38: India Smart Pills Market Volume (Dosage) Forecast, by Application 2019 & 2032
- Table 39: Australia Smart Pills Market Revenue (Million) Forecast, by Application 2019 & 2032
- Table 40: Australia Smart Pills Market Volume (Dosage) Forecast, by Application 2019 & 2032
- Table 41: South Korea Smart Pills Market Revenue (Million) Forecast, by Application 2019 & 2032
- Table 42: South Korea Smart Pills Market Volume (Dosage) Forecast, by Application 2019 & 2032
- Table 43: Rest of Asia Pacific Smart Pills Market Revenue (Million) Forecast, by Application 2019 & 2032
- Table 44: Rest of Asia Pacific Smart Pills Market Volume (Dosage) Forecast, by Application 2019 & 2032
- Table 45: Global Smart Pills Market Revenue Million Forecast, by Country 2019 & 2032
- Table 46: Global Smart Pills Market Volume Dosage Forecast, by Country 2019 & 2032
- Table 47: GCC Smart Pills Market Revenue (Million) Forecast, by Application 2019 & 2032
- Table 48: GCC Smart Pills Market Volume (Dosage) Forecast, by Application 2019 & 2032
- Table 49: South Africa Smart Pills Market Revenue (Million) Forecast, by Application 2019 & 2032
- Table 50: South Africa Smart Pills Market Volume (Dosage) Forecast, by Application 2019 & 2032
- Table 51: Rest of Middle East and Africa Smart Pills Market Revenue (Million) Forecast, by Application 2019 & 2032
- Table 52: Rest of Middle East and Africa Smart Pills Market Volume (Dosage) Forecast, by Application 2019 & 2032
- Table 53: Global Smart Pills Market Revenue Million Forecast, by Country 2019 & 2032
- Table 54: Global Smart Pills Market Volume Dosage Forecast, by Country 2019 & 2032
- Table 55: Brazil Smart Pills Market Revenue (Million) Forecast, by Application 2019 & 2032
- Table 56: Brazil Smart Pills Market Volume (Dosage) Forecast, by Application 2019 & 2032
- Table 57: Argentina Smart Pills Market Revenue (Million) Forecast, by Application 2019 & 2032
- Table 58: Argentina Smart Pills Market Volume (Dosage) Forecast, by Application 2019 & 2032
- Table 59: Rest of South America Smart Pills Market Revenue (Million) Forecast, by Application 2019 & 2032
- Table 60: Rest of South America Smart Pills Market Volume (Dosage) Forecast, by Application 2019 & 2032
- Table 61: Global Smart Pills Market Revenue Million Forecast, by Application Area 2019 & 2032
- Table 62: Global Smart Pills Market Volume Dosage Forecast, by Application Area 2019 & 2032
- Table 63: Global Smart Pills Market Revenue Million Forecast, by Disease Indication 2019 & 2032
- Table 64: Global Smart Pills Market Volume Dosage Forecast, by Disease Indication 2019 & 2032
- Table 65: Global Smart Pills Market Revenue Million Forecast, by Country 2019 & 2032
- Table 66: Global Smart Pills Market Volume Dosage Forecast, by Country 2019 & 2032
- Table 67: United States Smart Pills Market Revenue (Million) Forecast, by Application 2019 & 2032
- Table 68: United States Smart Pills Market Volume (Dosage) Forecast, by Application 2019 & 2032
- Table 69: Canada Smart Pills Market Revenue (Million) Forecast, by Application 2019 & 2032
- Table 70: Canada Smart Pills Market Volume (Dosage) Forecast, by Application 2019 & 2032
- Table 71: Mexico Smart Pills Market Revenue (Million) Forecast, by Application 2019 & 2032
- Table 72: Mexico Smart Pills Market Volume (Dosage) Forecast, by Application 2019 & 2032
- Table 73: Global Smart Pills Market Revenue Million Forecast, by Application Area 2019 & 2032
- Table 74: Global Smart Pills Market Volume Dosage Forecast, by Application Area 2019 & 2032
- Table 75: Global Smart Pills Market Revenue Million Forecast, by Disease Indication 2019 & 2032
- Table 76: Global Smart Pills Market Volume Dosage Forecast, by Disease Indication 2019 & 2032
- Table 77: Global Smart Pills Market Revenue Million Forecast, by Country 2019 & 2032
- Table 78: Global Smart Pills Market Volume Dosage Forecast, by Country 2019 & 2032
- Table 79: Germany Smart Pills Market Revenue (Million) Forecast, by Application 2019 & 2032
- Table 80: Germany Smart Pills Market Volume (Dosage) Forecast, by Application 2019 & 2032
- Table 81: United Kingdom Smart Pills Market Revenue (Million) Forecast, by Application 2019 & 2032
- Table 82: United Kingdom Smart Pills Market Volume (Dosage) Forecast, by Application 2019 & 2032
- Table 83: France Smart Pills Market Revenue (Million) Forecast, by Application 2019 & 2032
- Table 84: France Smart Pills Market Volume (Dosage) Forecast, by Application 2019 & 2032
- Table 85: Italy Smart Pills Market Revenue (Million) Forecast, by Application 2019 & 2032
- Table 86: Italy Smart Pills Market Volume (Dosage) Forecast, by Application 2019 & 2032
- Table 87: Spain Smart Pills Market Revenue (Million) Forecast, by Application 2019 & 2032
- Table 88: Spain Smart Pills Market Volume (Dosage) Forecast, by Application 2019 & 2032
- Table 89: Rest of Europe Smart Pills Market Revenue (Million) Forecast, by Application 2019 & 2032
- Table 90: Rest of Europe Smart Pills Market Volume (Dosage) Forecast, by Application 2019 & 2032
- Table 91: Global Smart Pills Market Revenue Million Forecast, by Application Area 2019 & 2032
- Table 92: Global Smart Pills Market Volume Dosage Forecast, by Application Area 2019 & 2032
- Table 93: Global Smart Pills Market Revenue Million Forecast, by Disease Indication 2019 & 2032
- Table 94: Global Smart Pills Market Volume Dosage Forecast, by Disease Indication 2019 & 2032
- Table 95: Global Smart Pills Market Revenue Million Forecast, by Country 2019 & 2032
- Table 96: Global Smart Pills Market Volume Dosage Forecast, by Country 2019 & 2032
- Table 97: China Smart Pills Market Revenue (Million) Forecast, by Application 2019 & 2032
- Table 98: China Smart Pills Market Volume (Dosage) Forecast, by Application 2019 & 2032
- Table 99: Japan Smart Pills Market Revenue (Million) Forecast, by Application 2019 & 2032
- Table 100: Japan Smart Pills Market Volume (Dosage) Forecast, by Application 2019 & 2032
- Table 101: India Smart Pills Market Revenue (Million) Forecast, by Application 2019 & 2032
- Table 102: India Smart Pills Market Volume (Dosage) Forecast, by Application 2019 & 2032
- Table 103: Australia Smart Pills Market Revenue (Million) Forecast, by Application 2019 & 2032
- Table 104: Australia Smart Pills Market Volume (Dosage) Forecast, by Application 2019 & 2032
- Table 105: South Korea Smart Pills Market Revenue (Million) Forecast, by Application 2019 & 2032
- Table 106: South Korea Smart Pills Market Volume (Dosage) Forecast, by Application 2019 & 2032
- Table 107: Rest of Asia Pacific Smart Pills Market Revenue (Million) Forecast, by Application 2019 & 2032
- Table 108: Rest of Asia Pacific Smart Pills Market Volume (Dosage) Forecast, by Application 2019 & 2032
- Table 109: Global Smart Pills Market Revenue Million Forecast, by Application Area 2019 & 2032
- Table 110: Global Smart Pills Market Volume Dosage Forecast, by Application Area 2019 & 2032
- Table 111: Global Smart Pills Market Revenue Million Forecast, by Disease Indication 2019 & 2032
- Table 112: Global Smart Pills Market Volume Dosage Forecast, by Disease Indication 2019 & 2032
- Table 113: Global Smart Pills Market Revenue Million Forecast, by Country 2019 & 2032
- Table 114: Global Smart Pills Market Volume Dosage Forecast, by Country 2019 & 2032
- Table 115: GCC Smart Pills Market Revenue (Million) Forecast, by Application 2019 & 2032
- Table 116: GCC Smart Pills Market Volume (Dosage) Forecast, by Application 2019 & 2032
- Table 117: South Africa Smart Pills Market Revenue (Million) Forecast, by Application 2019 & 2032
- Table 118: South Africa Smart Pills Market Volume (Dosage) Forecast, by Application 2019 & 2032
- Table 119: Rest of Middle East and Africa Smart Pills Market Revenue (Million) Forecast, by Application 2019 & 2032
- Table 120: Rest of Middle East and Africa Smart Pills Market Volume (Dosage) Forecast, by Application 2019 & 2032
- Table 121: Global Smart Pills Market Revenue Million Forecast, by Application Area 2019 & 2032
- Table 122: Global Smart Pills Market Volume Dosage Forecast, by Application Area 2019 & 2032
- Table 123: Global Smart Pills Market Revenue Million Forecast, by Disease Indication 2019 & 2032
- Table 124: Global Smart Pills Market Volume Dosage Forecast, by Disease Indication 2019 & 2032
- Table 125: Global Smart Pills Market Revenue Million Forecast, by Country 2019 & 2032
- Table 126: Global Smart Pills Market Volume Dosage Forecast, by Country 2019 & 2032
- Table 127: Brazil Smart Pills Market Revenue (Million) Forecast, by Application 2019 & 2032
- Table 128: Brazil Smart Pills Market Volume (Dosage) Forecast, by Application 2019 & 2032
- Table 129: Argentina Smart Pills Market Revenue (Million) Forecast, by Application 2019 & 2032
- Table 130: Argentina Smart Pills Market Volume (Dosage) Forecast, by Application 2019 & 2032
- Table 131: Rest of South America Smart Pills Market Revenue (Million) Forecast, by Application 2019 & 2032
- Table 132: Rest of South America Smart Pills Market Volume (Dosage) Forecast, by Application 2019 & 2032
Frequently Asked Questions
1. What is the projected Compound Annual Growth Rate (CAGR) of the Smart Pills Market?
The projected CAGR is approximately 14.50%.
2. Which companies are prominent players in the Smart Pills Market?
Key companies in the market include CapsoVision Inc, Novartis AG, Olympus Medical Technology, Check-Cap, Jinshan Science and Technology, Intromedic, Pentax Medical (Hoya), Medtronic PLC, Otsuka Pharmaceutical Co Ltd, etectRx Inc, Koninklijke Philips NV (Medimetrics), Pixie Scientific, HQ Inc.
3. What are the main segments of the Smart Pills Market?
The market segments include Application Area, Disease Indication.
4. Can you provide details about the market size?
The market size is estimated to be USD XX Million as of 2022.
5. What are some drivers contributing to market growth?
Increasing Preference for Minimally-invasive Devices; Rising Burden of Gastrointestinal Disorders; Technological Advancements.
6. What are the notable trends driving market growth?
Capsule Endoscopy is Expected to Witness High Growth Over the Forecast Period.
7. Are there any restraints impacting market growth?
Increasing Cost with Technological Advancements; Potential Health Risks.
8. Can you provide examples of recent developments in the market?
In September 2022, HealthBeacon plc extended its platform to manage complex and critical pill regimens with the launch of its new HB Smart Pills Management System.
9. What pricing options are available for accessing the report?
Pricing options include single-user, multi-user, and enterprise licenses priced at USD 4750, USD 5250, and USD 8750 respectively.
10. Is the market size provided in terms of value or volume?
The market size is provided in terms of value, measured in Million and volume, measured in Dosage.
11. Are there any specific market keywords associated with the report?
Yes, the market keyword associated with the report is "Smart Pills Market," which aids in identifying and referencing the specific market segment covered.
12. How do I determine which pricing option suits my needs best?
The pricing options vary based on user requirements and access needs. Individual users may opt for single-user licenses, while businesses requiring broader access may choose multi-user or enterprise licenses for cost-effective access to the report.
13. Are there any additional resources or data provided in the Smart Pills Market report?
While the report offers comprehensive insights, it's advisable to review the specific contents or supplementary materials provided to ascertain if additional resources or data are available.
14. How can I stay updated on further developments or reports in the Smart Pills Market?
To stay informed about further developments, trends, and reports in the Smart Pills Market, consider subscribing to industry newsletters, following relevant companies and organizations, or regularly checking reputable industry news sources and publications.
Methodology
Step 1 - Identification of Relevant Samples Size from Population Database


Step 2 - Approaches for Defining Global Market Size (Value, Volume* & Price*)

Note*: In applicable scenarios
Step 3 - Data Sources
Primary Research
- Web Analytics
- Survey Reports
- Research Institute
- Latest Research Reports
- Opinion Leaders
Secondary Research
- Annual Reports
- White Paper
- Latest Press Release
- Industry Association
- Paid Database
- Investor Presentations

Step 4 - Data Triangulation
Involves using different sources of information in order to increase the validity of a study
These sources are likely to be stakeholders in a program - participants, other researchers, program staff, other community members, and so on.
Then we put all data in single framework & apply various statistical tools to find out the dynamic on the market.
During the analysis stage, feedback from the stakeholder groups would be compared to determine areas of agreement as well as areas of divergence


