

Key Insights
The global Healthcare Data Analytics market is projected for substantial expansion, propelled by the escalating generation of healthcare data from sources such as Electronic Health Records (EHRs), and wearable technologies. With a Compound Annual Growth Rate (CAGR) of 13.36%, the market is anticipated to reach $3.1 billion by 2024. This growth is attributed to the increasing demand for enhanced patient care, efficient healthcare resource management, and the widespread adoption of value-based care models. The market is segmented by component (software, services), deployment (on-premise, cloud), and application (financial, clinical, operational, population health analytics). Cloud-based solutions are expected to see significant uptake due to their scalability, cost-effectiveness, and accessibility. The integration of advanced analytics techniques like Artificial Intelligence (AI) and Machine Learning (ML) is further accelerating market penetration.
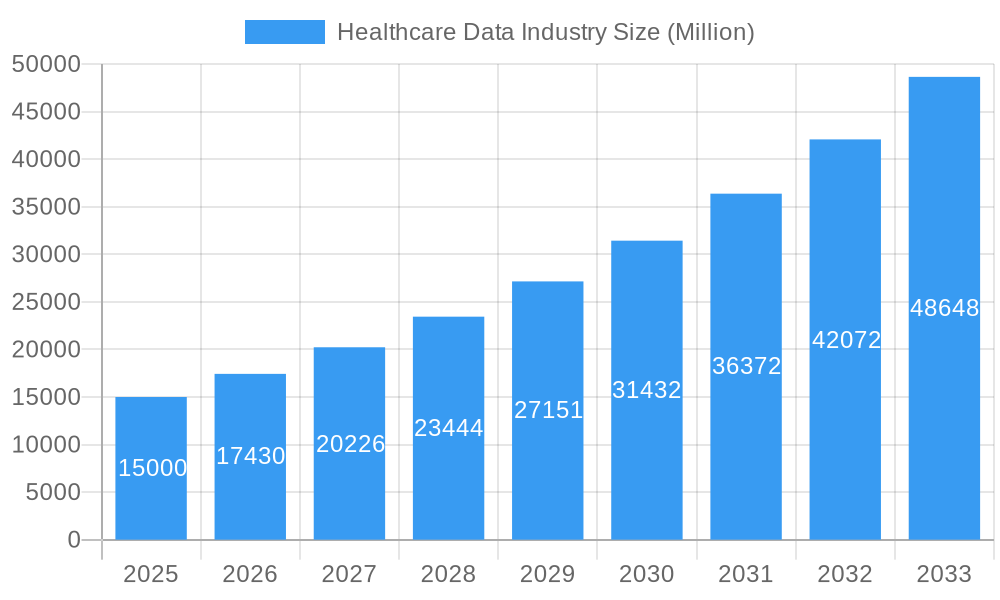
Healthcare Data Industry Market Size (In Billion)
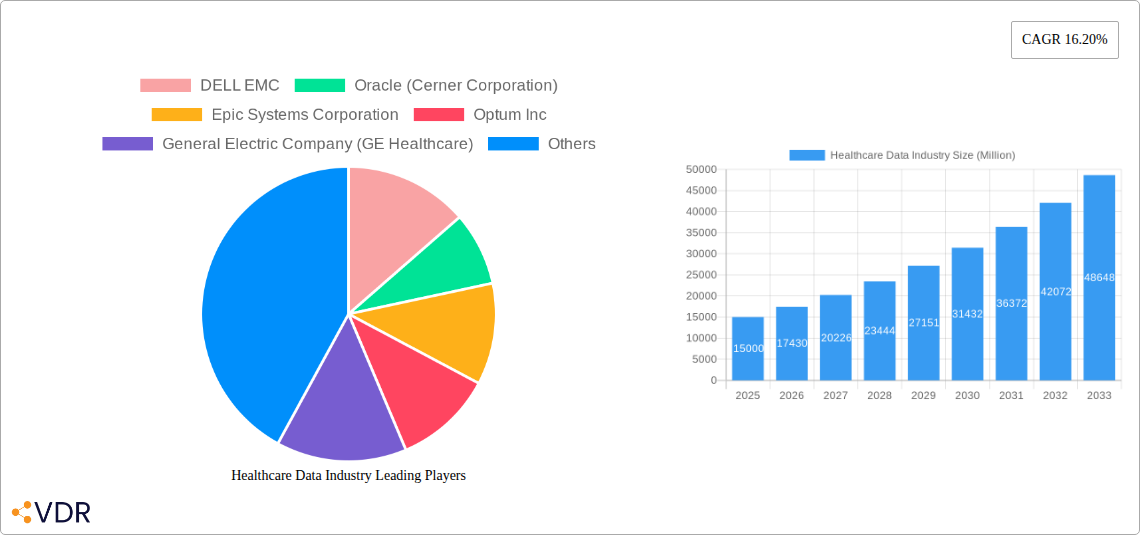
Leading market participants, including Dell EMC, Oracle (Cerner), Epic Systems, and IBM, are actively investing in advanced analytics solutions and expanding their global footprint. North America currently dominates the market, supported by its advanced healthcare infrastructure and high adoption of data analytics. The Asia-Pacific region is poised for significant growth, driven by increased government investment in healthcare IT and growing awareness of data-driven decision-making benefits.
Healthcare Data Industry Company Market Share
Key market restraints include data security and privacy concerns, the high cost of implementation and maintenance, and a shortage of skilled professionals. Addressing these challenges through robust cybersecurity, user-friendly interfaces, and targeted training programs will be critical for sustained growth. The future trajectory of the Healthcare Data Analytics market will be characterized by increased AI and ML integration for predictive modeling, personalized medicine, and improved treatment outcomes. A shift towards real-time data analytics will enable proactive interventions and optimized resource allocation. The proliferation of telehealth and remote patient monitoring will further fuel data growth, increasing demand for sophisticated analytics solutions to extract actionable insights. Overall, the Healthcare Data Analytics market presents a compelling investment opportunity, promising a more efficient, cost-effective, and patient-centric healthcare ecosystem.
Healthcare Data Industry Market Report: 2019-2033
This comprehensive report provides a detailed analysis of the Healthcare Data Industry, encompassing market size, growth trends, competitive landscape, and future outlook. The study period covers 2019-2033, with 2025 as the base and estimated year. The forecast period spans 2025-2033, and the historical period is 2019-2024. This report is invaluable for industry professionals, investors, and strategists seeking a deep understanding of this rapidly evolving sector. The report examines parent markets (Healthcare IT) and child markets (e.g., Clinical Data Analytics, Population Health Analytics) to offer a complete picture of market dynamics.
Healthcare Data Industry Market Dynamics & Structure
The global healthcare data market, valued at $xx million in 2024, exhibits a moderately concentrated structure with several dominant players and a growing number of niche competitors. Technological innovation, particularly in AI and machine learning, is a key driver, alongside increasing regulatory pressures towards data privacy and interoperability (e.g., HIPAA, GDPR). The market witnesses significant M&A activity, with large players acquiring smaller companies to expand their capabilities and market share. Competitive product substitutes include legacy systems and manual processes, but the advantages of data-driven insights are increasingly compelling. End-user demographics are expanding, encompassing hospitals, clinics, pharmaceutical companies, and research institutions.
- Market Concentration: Highly concentrated with top 5 players holding xx% market share in 2024.
- Technological Innovation: AI, ML, Big Data analytics are major drivers.
- Regulatory Frameworks: HIPAA, GDPR, and other regional regulations are shaping market practices.
- M&A Activity: Over xx deals in the last 5 years, totaling an estimated value of $xx million.
- Innovation Barriers: Data security concerns, integration complexities, and high initial investment costs.
Healthcare Data Industry Growth Trends & Insights
The healthcare data market is experiencing robust growth, driven by the increasing adoption of electronic health records (EHRs), the rise of telehealth, and a growing focus on value-based care. The market size is projected to reach $xx million by 2033, exhibiting a CAGR of xx% during the forecast period. This growth is fueled by technological disruptions, such as cloud computing and edge analytics, leading to improved data accessibility and processing capabilities. Consumer behavior is shifting towards greater transparency and control over their health data, creating opportunities for personalized healthcare solutions.
The adoption rate of cloud-based solutions is increasing significantly, with a projected market penetration of xx% by 2033. The shift toward value-based care is also driving demand for analytics solutions that enable providers to optimize resource allocation and improve patient outcomes.
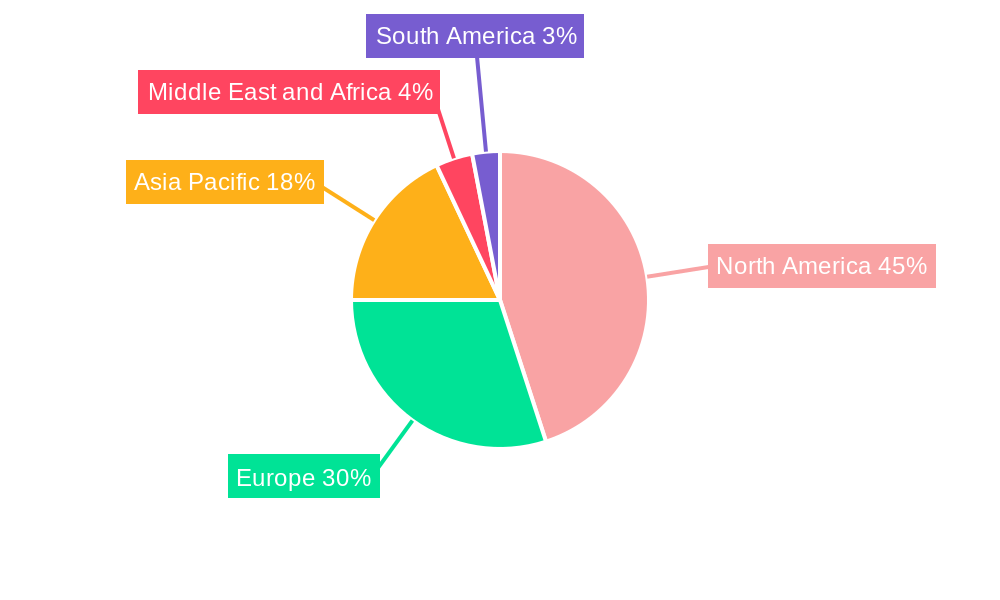
Dominant Regions, Countries, or Segments in Healthcare Data Industry
North America currently holds the largest market share in the healthcare data industry, driven by strong technological advancements, high healthcare expenditure, and well-established healthcare infrastructure. Within this region, the United States dominates due to its advanced technology adoption and large healthcare systems. However, the Asia-Pacific region is showing the fastest growth, driven by increasing government investments in healthcare IT and rising healthcare expenditure.
Leading Segment: Clinical Data Analytics is the largest segment, driven by the need for improved diagnosis and treatment.
Leading Deployment Model: Cloud deployment is experiencing rapid growth due to scalability and cost-effectiveness.
Key Drivers: Strong government support for digital health initiatives, rising healthcare expenditure, and increasing adoption of EHRs.
Software: This segment is projected to hold the largest market share due to the increasing demand for advanced analytics tools and EHR software.
Services: This segment is expected to witness significant growth as organizations look to leverage external expertise in data management and analysis.
On-premise: While cloud is growing, on-premise solutions still hold a significant market share, particularly among large healthcare systems with strict data security requirements.
Cloud: This is the fastest-growing deployment model, driven by the benefits of scalability, cost-effectiveness, and accessibility.
Financial Analytics: This application is experiencing strong growth due to the increasing focus on cost optimization and revenue cycle management.
Clinical Data Analytics: This application dominates the market, owing to its crucial role in improving patient care and clinical decision-making.
Operational Analytics: Growing steadily as healthcare organizations strive to improve operational efficiency.
Population Health Analytics: This application is showing substantial growth, driven by the growing focus on proactive healthcare management.
Healthcare Data Industry Product Landscape
The healthcare data industry offers a wide range of products, from sophisticated analytics platforms to specialized software solutions designed for specific clinical applications. These products incorporate advanced AI and machine learning capabilities for predictive modeling, risk stratification, and personalized medicine. Key innovations include improved data visualization, seamless integration with existing EHR systems, and enhanced security features to address data privacy concerns. Unique selling propositions often center on speed, accuracy, and ease of use, enabling healthcare professionals to make faster, more informed decisions.
Key Drivers, Barriers & Challenges in Healthcare Data Industry
Key Drivers:
- The increasing adoption of EHRs and digital health technologies is driving demand for data analytics solutions.
- The shift towards value-based care is creating a need for data-driven insights to improve healthcare outcomes and optimize resource allocation.
- Government initiatives and regulations promoting data sharing and interoperability are facilitating market growth.
Key Challenges & Restraints:
- Data security and privacy concerns are major obstacles to widespread adoption of healthcare data analytics solutions.
- The complexity of integrating data from diverse sources can hinder efficient data analysis.
- High implementation costs and lack of skilled professionals can limit market penetration, especially in developing economies. This can lead to a xx% reduction in adoption rates in certain regions.
Emerging Opportunities in Healthcare Data Industry
- AI-powered diagnostics: Developing AI-driven tools for early disease detection and personalized treatment plans.
- Predictive analytics for population health: Using data to anticipate health crises and allocate resources effectively.
- Blockchain technology for secure data sharing: Developing secure and transparent systems for data exchange across healthcare organizations.
Growth Accelerators in the Healthcare Data Industry
Technological advancements, particularly in AI and machine learning, are significantly accelerating growth. Strategic partnerships between technology providers and healthcare organizations are fostering innovation and market expansion. The increasing focus on preventive care and personalized medicine is driving demand for advanced data analytics capabilities.
Key Players Shaping the Healthcare Data Industry Market
- DELL EMC
- Oracle (Cerner Corporation)
- Epic Systems Corporation
- Optum Inc
- General Electric Company (GE Healthcare)
- International Business Machines Corporation (IBM)
- ExlService Holdings Inc
- Health Fidelity Inc
- Allscripts Healthcare Solutions Inc
- Flatiron Health
- Apixio
- SAS INSTITUTE INC
- Innovaccer Inc
Notable Milestones in Healthcare Data Industry Sector
- March 2022: Microsoft launched Azure Health Data Services in the United States, providing a secure cloud platform for protected health information (PHI). This significantly accelerated cloud adoption in the US healthcare sector.
- March 2022: The government of Thailand launched a national healthcare big data portal, improving data accessibility and collaboration among healthcare providers. This initiative spurred investments in related technologies.
In-Depth Healthcare Data Industry Market Outlook
The healthcare data industry is poised for continued strong growth, driven by technological advancements, increasing data volumes, and a greater focus on data-driven decision-making. Strategic partnerships and mergers & acquisitions will continue to shape the competitive landscape. Opportunities abound in areas such as AI-powered diagnostics, predictive analytics, and personalized medicine, creating substantial value for both technology providers and healthcare organizations. The market is expected to reach $xx million by 2033, representing a significant expansion from its current size.
Healthcare Data Industry Segmentation
-
1. Component
- 1.1. Software
- 1.2. Services
-
2. Deployment
- 2.1. On-premise
- 2.2. Cloud
-
3. Application
- 3.1. Financial Analytics
- 3.2. Clinical Data Analytics
- 3.3. Operational Analytics
- 3.4. Population Health Analytics
Healthcare Data Industry Segmentation By Geography
-
1. North America
- 1.1. United States
- 1.2. Canada
- 1.3. Mexico
-
2. Europe
- 2.1. Germany
- 2.2. United Kingdom
- 2.3. France
- 2.4. Italy
- 2.5. Spain
- 2.6. Rest of Europe
-
3. Asia Pacific
- 3.1. China
- 3.2. Japan
- 3.3. India
- 3.4. Australia
- 3.5. South Korea
- 3.6. Rest of Asia Pacific
-
4. Middle East and Africa
- 4.1. GCC
- 4.2. South Africa
- 4.3. Rest of Middle East and Africa
-
5. South America
- 5.1. Brazil
- 5.2. Argentina
- 5.3. Rest of South America
Healthcare Data Industry Regional Market Share
Geographic Coverage of Healthcare Data Industry
Healthcare Data Industry REPORT HIGHLIGHTS
| Aspects | Details |
|---|---|
| Study Period | 2020-2034 |
| Base Year | 2025 |
| Estimated Year | 2026 |
| Forecast Period | 2026-2034 |
| Historical Period | 2020-2025 |
| Growth Rate | CAGR of 13.36% from 2020-2034 |
| Segmentation |
|
Table of Contents
- 1. Introduction
- 1.1. Research Scope
- 1.2. Market Segmentation
- 1.3. Research Objective
- 1.4. Definitions and Assumptions
- 2. Executive Summary
- 2.1. Market Snapshot
- 3. Market Dynamics
- 3.1. Market Drivers
- 3.2. Market Restrains
- 3.3. Market Trends
- 3.4. Market Opportunities
- 4. Market Factor Analysis
- 4.1. Porters Five Forces
- 4.1.1. Bargaining Power of Suppliers
- 4.1.2. Bargaining Power of Buyers
- 4.1.3. Threat of New Entrants
- 4.1.4. Threat of Substitutes
- 4.1.5. Competitive Rivalry
- 4.2. PESTEL analysis
- 4.3. BCG Analysis
- 4.3.1. Stars (High Growth, High Market Share)
- 4.3.2. Cash Cows (Low Growth, High Market Share)
- 4.3.3. Question Mark (High Growth, Low Market Share)
- 4.3.4. Dogs (Low Growth, Low Market Share)
- 4.4. Ansoff Matrix Analysis
- 4.5. Supply Chain Analysis
- 4.6. Regulatory Landscape
- 4.7. Current Market Potential and Opportunity Assessment (TAM–SAM–SOM Framework)
- 4.8. VDR Analyst Note
- 4.1. Porters Five Forces
- 5. Market Analysis, Insights and Forecast 2021-2033
- 5.1. Market Analysis, Insights and Forecast - by Component
- 5.1.1. Software
- 5.1.2. Services
- 5.2. Market Analysis, Insights and Forecast - by Deployment
- 5.2.1. On-premise
- 5.2.2. Cloud
- 5.3. Market Analysis, Insights and Forecast - by Application
- 5.3.1. Financial Analytics
- 5.3.2. Clinical Data Analytics
- 5.3.3. Operational Analytics
- 5.3.4. Population Health Analytics
- 5.4. Market Analysis, Insights and Forecast - by Region
- 5.4.1. North America
- 5.4.2. Europe
- 5.4.3. Asia Pacific
- 5.4.4. Middle East and Africa
- 5.4.5. South America
- 5.1. Market Analysis, Insights and Forecast - by Component
- 6. Global Healthcare Data Industry Analysis, Insights and Forecast, 2021-2033
- 6.1. Market Analysis, Insights and Forecast - by Component
- 6.1.1. Software
- 6.1.2. Services
- 6.2. Market Analysis, Insights and Forecast - by Deployment
- 6.2.1. On-premise
- 6.2.2. Cloud
- 6.3. Market Analysis, Insights and Forecast - by Application
- 6.3.1. Financial Analytics
- 6.3.2. Clinical Data Analytics
- 6.3.3. Operational Analytics
- 6.3.4. Population Health Analytics
- 6.1. Market Analysis, Insights and Forecast - by Component
- 7. North America Healthcare Data Industry Analysis, Insights and Forecast, 2021-2033
- 7.1. Market Analysis, Insights and Forecast - by Component
- 7.1.1. Software
- 7.1.2. Services
- 7.2. Market Analysis, Insights and Forecast - by Deployment
- 7.2.1. On-premise
- 7.2.2. Cloud
- 7.3. Market Analysis, Insights and Forecast - by Application
- 7.3.1. Financial Analytics
- 7.3.2. Clinical Data Analytics
- 7.3.3. Operational Analytics
- 7.3.4. Population Health Analytics
- 7.1. Market Analysis, Insights and Forecast - by Component
- 8. Europe Healthcare Data Industry Analysis, Insights and Forecast, 2021-2033
- 8.1. Market Analysis, Insights and Forecast - by Component
- 8.1.1. Software
- 8.1.2. Services
- 8.2. Market Analysis, Insights and Forecast - by Deployment
- 8.2.1. On-premise
- 8.2.2. Cloud
- 8.3. Market Analysis, Insights and Forecast - by Application
- 8.3.1. Financial Analytics
- 8.3.2. Clinical Data Analytics
- 8.3.3. Operational Analytics
- 8.3.4. Population Health Analytics
- 8.1. Market Analysis, Insights and Forecast - by Component
- 9. Asia Pacific Healthcare Data Industry Analysis, Insights and Forecast, 2021-2033
- 9.1. Market Analysis, Insights and Forecast - by Component
- 9.1.1. Software
- 9.1.2. Services
- 9.2. Market Analysis, Insights and Forecast - by Deployment
- 9.2.1. On-premise
- 9.2.2. Cloud
- 9.3. Market Analysis, Insights and Forecast - by Application
- 9.3.1. Financial Analytics
- 9.3.2. Clinical Data Analytics
- 9.3.3. Operational Analytics
- 9.3.4. Population Health Analytics
- 9.1. Market Analysis, Insights and Forecast - by Component
- 10. Middle East and Africa Healthcare Data Industry Analysis, Insights and Forecast, 2021-2033
- 10.1. Market Analysis, Insights and Forecast - by Component
- 10.1.1. Software
- 10.1.2. Services
- 10.2. Market Analysis, Insights and Forecast - by Deployment
- 10.2.1. On-premise
- 10.2.2. Cloud
- 10.3. Market Analysis, Insights and Forecast - by Application
- 10.3.1. Financial Analytics
- 10.3.2. Clinical Data Analytics
- 10.3.3. Operational Analytics
- 10.3.4. Population Health Analytics
- 10.1. Market Analysis, Insights and Forecast - by Component
- 11. South America Healthcare Data Industry Analysis, Insights and Forecast, 2021-2033
- 11.1. Market Analysis, Insights and Forecast - by Component
- 11.1.1. Software
- 11.1.2. Services
- 11.2. Market Analysis, Insights and Forecast - by Deployment
- 11.2.1. On-premise
- 11.2.2. Cloud
- 11.3. Market Analysis, Insights and Forecast - by Application
- 11.3.1. Financial Analytics
- 11.3.2. Clinical Data Analytics
- 11.3.3. Operational Analytics
- 11.3.4. Population Health Analytics
- 11.1. Market Analysis, Insights and Forecast - by Component
- 12. Competitive Analysis
- 12.1. Company Profiles
- 12.1.1 DELL EMC
- 12.1.1.1. Company Overview
- 12.1.1.2. Products
- 12.1.1.3. Company Financials
- 12.1.1.4. SWOT Analysis
- 12.1.2 Oracle (Cerner Corporation)
- 12.1.2.1. Company Overview
- 12.1.2.2. Products
- 12.1.2.3. Company Financials
- 12.1.2.4. SWOT Analysis
- 12.1.3 Epic Systems Corporation
- 12.1.3.1. Company Overview
- 12.1.3.2. Products
- 12.1.3.3. Company Financials
- 12.1.3.4. SWOT Analysis
- 12.1.4 Optum Inc
- 12.1.4.1. Company Overview
- 12.1.4.2. Products
- 12.1.4.3. Company Financials
- 12.1.4.4. SWOT Analysis
- 12.1.5 General Electric Company (GE Healthcare)
- 12.1.5.1. Company Overview
- 12.1.5.2. Products
- 12.1.5.3. Company Financials
- 12.1.5.4. SWOT Analysis
- 12.1.6 International Business Machines Corporation (IBM)
- 12.1.6.1. Company Overview
- 12.1.6.2. Products
- 12.1.6.3. Company Financials
- 12.1.6.4. SWOT Analysis
- 12.1.7 ExlService Holdings Inc
- 12.1.7.1. Company Overview
- 12.1.7.2. Products
- 12.1.7.3. Company Financials
- 12.1.7.4. SWOT Analysis
- 12.1.8 Health Fidelity Inc
- 12.1.8.1. Company Overview
- 12.1.8.2. Products
- 12.1.8.3. Company Financials
- 12.1.8.4. SWOT Analysis
- 12.1.9 Allscripts Healthcare Solutions Inc
- 12.1.9.1. Company Overview
- 12.1.9.2. Products
- 12.1.9.3. Company Financials
- 12.1.9.4. SWOT Analysis
- 12.1.10 Flatiron Health
- 12.1.10.1. Company Overview
- 12.1.10.2. Products
- 12.1.10.3. Company Financials
- 12.1.10.4. SWOT Analysis
- 12.1.11 Apixio
- 12.1.11.1. Company Overview
- 12.1.11.2. Products
- 12.1.11.3. Company Financials
- 12.1.11.4. SWOT Analysis
- 12.1.12 SAS INSTITUTE INC
- 12.1.12.1. Company Overview
- 12.1.12.2. Products
- 12.1.12.3. Company Financials
- 12.1.12.4. SWOT Analysis
- 12.1.13 Innovaccer Inc
- 12.1.13.1. Company Overview
- 12.1.13.2. Products
- 12.1.13.3. Company Financials
- 12.1.13.4. SWOT Analysis
- 12.1.1 DELL EMC
- 12.2. Market Entropy
- 12.2.1 Company's Key Areas Served
- 12.2.2 Recent Developments
- 12.3. Company Market Share Analysis 2025
- 12.3.1 Top 5 Companies Market Share Analysis
- 12.3.2 Top 3 Companies Market Share Analysis
- 12.4. List of Potential Customers
- 13. Research Methodology
List of Figures
- Figure 1: Global Healthcare Data Industry Revenue Breakdown (billion, %) by Region 2025 & 2033
- Figure 2: Global Healthcare Data Industry Volume Breakdown (K Unit, %) by Region 2025 & 2033
- Figure 3: North America Healthcare Data Industry Revenue (billion), by Component 2025 & 2033
- Figure 4: North America Healthcare Data Industry Volume (K Unit), by Component 2025 & 2033
- Figure 5: North America Healthcare Data Industry Revenue Share (%), by Component 2025 & 2033
- Figure 6: North America Healthcare Data Industry Volume Share (%), by Component 2025 & 2033
- Figure 7: North America Healthcare Data Industry Revenue (billion), by Deployment 2025 & 2033
- Figure 8: North America Healthcare Data Industry Volume (K Unit), by Deployment 2025 & 2033
- Figure 9: North America Healthcare Data Industry Revenue Share (%), by Deployment 2025 & 2033
- Figure 10: North America Healthcare Data Industry Volume Share (%), by Deployment 2025 & 2033
- Figure 11: North America Healthcare Data Industry Revenue (billion), by Application 2025 & 2033
- Figure 12: North America Healthcare Data Industry Volume (K Unit), by Application 2025 & 2033
- Figure 13: North America Healthcare Data Industry Revenue Share (%), by Application 2025 & 2033
- Figure 14: North America Healthcare Data Industry Volume Share (%), by Application 2025 & 2033
- Figure 15: North America Healthcare Data Industry Revenue (billion), by Country 2025 & 2033
- Figure 16: North America Healthcare Data Industry Volume (K Unit), by Country 2025 & 2033
- Figure 17: North America Healthcare Data Industry Revenue Share (%), by Country 2025 & 2033
- Figure 18: North America Healthcare Data Industry Volume Share (%), by Country 2025 & 2033
- Figure 19: Europe Healthcare Data Industry Revenue (billion), by Component 2025 & 2033
- Figure 20: Europe Healthcare Data Industry Volume (K Unit), by Component 2025 & 2033
- Figure 21: Europe Healthcare Data Industry Revenue Share (%), by Component 2025 & 2033
- Figure 22: Europe Healthcare Data Industry Volume Share (%), by Component 2025 & 2033
- Figure 23: Europe Healthcare Data Industry Revenue (billion), by Deployment 2025 & 2033
- Figure 24: Europe Healthcare Data Industry Volume (K Unit), by Deployment 2025 & 2033
- Figure 25: Europe Healthcare Data Industry Revenue Share (%), by Deployment 2025 & 2033
- Figure 26: Europe Healthcare Data Industry Volume Share (%), by Deployment 2025 & 2033
- Figure 27: Europe Healthcare Data Industry Revenue (billion), by Application 2025 & 2033
- Figure 28: Europe Healthcare Data Industry Volume (K Unit), by Application 2025 & 2033
- Figure 29: Europe Healthcare Data Industry Revenue Share (%), by Application 2025 & 2033
- Figure 30: Europe Healthcare Data Industry Volume Share (%), by Application 2025 & 2033
- Figure 31: Europe Healthcare Data Industry Revenue (billion), by Country 2025 & 2033
- Figure 32: Europe Healthcare Data Industry Volume (K Unit), by Country 2025 & 2033
- Figure 33: Europe Healthcare Data Industry Revenue Share (%), by Country 2025 & 2033
- Figure 34: Europe Healthcare Data Industry Volume Share (%), by Country 2025 & 2033
- Figure 35: Asia Pacific Healthcare Data Industry Revenue (billion), by Component 2025 & 2033
- Figure 36: Asia Pacific Healthcare Data Industry Volume (K Unit), by Component 2025 & 2033
- Figure 37: Asia Pacific Healthcare Data Industry Revenue Share (%), by Component 2025 & 2033
- Figure 38: Asia Pacific Healthcare Data Industry Volume Share (%), by Component 2025 & 2033
- Figure 39: Asia Pacific Healthcare Data Industry Revenue (billion), by Deployment 2025 & 2033
- Figure 40: Asia Pacific Healthcare Data Industry Volume (K Unit), by Deployment 2025 & 2033
- Figure 41: Asia Pacific Healthcare Data Industry Revenue Share (%), by Deployment 2025 & 2033
- Figure 42: Asia Pacific Healthcare Data Industry Volume Share (%), by Deployment 2025 & 2033
- Figure 43: Asia Pacific Healthcare Data Industry Revenue (billion), by Application 2025 & 2033
- Figure 44: Asia Pacific Healthcare Data Industry Volume (K Unit), by Application 2025 & 2033
- Figure 45: Asia Pacific Healthcare Data Industry Revenue Share (%), by Application 2025 & 2033
- Figure 46: Asia Pacific Healthcare Data Industry Volume Share (%), by Application 2025 & 2033
- Figure 47: Asia Pacific Healthcare Data Industry Revenue (billion), by Country 2025 & 2033
- Figure 48: Asia Pacific Healthcare Data Industry Volume (K Unit), by Country 2025 & 2033
- Figure 49: Asia Pacific Healthcare Data Industry Revenue Share (%), by Country 2025 & 2033
- Figure 50: Asia Pacific Healthcare Data Industry Volume Share (%), by Country 2025 & 2033
- Figure 51: Middle East and Africa Healthcare Data Industry Revenue (billion), by Component 2025 & 2033
- Figure 52: Middle East and Africa Healthcare Data Industry Volume (K Unit), by Component 2025 & 2033
- Figure 53: Middle East and Africa Healthcare Data Industry Revenue Share (%), by Component 2025 & 2033
- Figure 54: Middle East and Africa Healthcare Data Industry Volume Share (%), by Component 2025 & 2033
- Figure 55: Middle East and Africa Healthcare Data Industry Revenue (billion), by Deployment 2025 & 2033
- Figure 56: Middle East and Africa Healthcare Data Industry Volume (K Unit), by Deployment 2025 & 2033
- Figure 57: Middle East and Africa Healthcare Data Industry Revenue Share (%), by Deployment 2025 & 2033
- Figure 58: Middle East and Africa Healthcare Data Industry Volume Share (%), by Deployment 2025 & 2033
- Figure 59: Middle East and Africa Healthcare Data Industry Revenue (billion), by Application 2025 & 2033
- Figure 60: Middle East and Africa Healthcare Data Industry Volume (K Unit), by Application 2025 & 2033
- Figure 61: Middle East and Africa Healthcare Data Industry Revenue Share (%), by Application 2025 & 2033
- Figure 62: Middle East and Africa Healthcare Data Industry Volume Share (%), by Application 2025 & 2033
- Figure 63: Middle East and Africa Healthcare Data Industry Revenue (billion), by Country 2025 & 2033
- Figure 64: Middle East and Africa Healthcare Data Industry Volume (K Unit), by Country 2025 & 2033
- Figure 65: Middle East and Africa Healthcare Data Industry Revenue Share (%), by Country 2025 & 2033
- Figure 66: Middle East and Africa Healthcare Data Industry Volume Share (%), by Country 2025 & 2033
- Figure 67: South America Healthcare Data Industry Revenue (billion), by Component 2025 & 2033
- Figure 68: South America Healthcare Data Industry Volume (K Unit), by Component 2025 & 2033
- Figure 69: South America Healthcare Data Industry Revenue Share (%), by Component 2025 & 2033
- Figure 70: South America Healthcare Data Industry Volume Share (%), by Component 2025 & 2033
- Figure 71: South America Healthcare Data Industry Revenue (billion), by Deployment 2025 & 2033
- Figure 72: South America Healthcare Data Industry Volume (K Unit), by Deployment 2025 & 2033
- Figure 73: South America Healthcare Data Industry Revenue Share (%), by Deployment 2025 & 2033
- Figure 74: South America Healthcare Data Industry Volume Share (%), by Deployment 2025 & 2033
- Figure 75: South America Healthcare Data Industry Revenue (billion), by Application 2025 & 2033
- Figure 76: South America Healthcare Data Industry Volume (K Unit), by Application 2025 & 2033
- Figure 77: South America Healthcare Data Industry Revenue Share (%), by Application 2025 & 2033
- Figure 78: South America Healthcare Data Industry Volume Share (%), by Application 2025 & 2033
- Figure 79: South America Healthcare Data Industry Revenue (billion), by Country 2025 & 2033
- Figure 80: South America Healthcare Data Industry Volume (K Unit), by Country 2025 & 2033
- Figure 81: South America Healthcare Data Industry Revenue Share (%), by Country 2025 & 2033
- Figure 82: South America Healthcare Data Industry Volume Share (%), by Country 2025 & 2033
List of Tables
- Table 1: Global Healthcare Data Industry Revenue billion Forecast, by Component 2020 & 2033
- Table 2: Global Healthcare Data Industry Volume K Unit Forecast, by Component 2020 & 2033
- Table 3: Global Healthcare Data Industry Revenue billion Forecast, by Deployment 2020 & 2033
- Table 4: Global Healthcare Data Industry Volume K Unit Forecast, by Deployment 2020 & 2033
- Table 5: Global Healthcare Data Industry Revenue billion Forecast, by Application 2020 & 2033
- Table 6: Global Healthcare Data Industry Volume K Unit Forecast, by Application 2020 & 2033
- Table 7: Global Healthcare Data Industry Revenue billion Forecast, by Region 2020 & 2033
- Table 8: Global Healthcare Data Industry Volume K Unit Forecast, by Region 2020 & 2033
- Table 9: Global Healthcare Data Industry Revenue billion Forecast, by Component 2020 & 2033
- Table 10: Global Healthcare Data Industry Volume K Unit Forecast, by Component 2020 & 2033
- Table 11: Global Healthcare Data Industry Revenue billion Forecast, by Deployment 2020 & 2033
- Table 12: Global Healthcare Data Industry Volume K Unit Forecast, by Deployment 2020 & 2033
- Table 13: Global Healthcare Data Industry Revenue billion Forecast, by Application 2020 & 2033
- Table 14: Global Healthcare Data Industry Volume K Unit Forecast, by Application 2020 & 2033
- Table 15: Global Healthcare Data Industry Revenue billion Forecast, by Country 2020 & 2033
- Table 16: Global Healthcare Data Industry Volume K Unit Forecast, by Country 2020 & 2033
- Table 17: United States Healthcare Data Industry Revenue (billion) Forecast, by Application 2020 & 2033
- Table 18: United States Healthcare Data Industry Volume (K Unit) Forecast, by Application 2020 & 2033
- Table 19: Canada Healthcare Data Industry Revenue (billion) Forecast, by Application 2020 & 2033
- Table 20: Canada Healthcare Data Industry Volume (K Unit) Forecast, by Application 2020 & 2033
- Table 21: Mexico Healthcare Data Industry Revenue (billion) Forecast, by Application 2020 & 2033
- Table 22: Mexico Healthcare Data Industry Volume (K Unit) Forecast, by Application 2020 & 2033
- Table 23: Global Healthcare Data Industry Revenue billion Forecast, by Component 2020 & 2033
- Table 24: Global Healthcare Data Industry Volume K Unit Forecast, by Component 2020 & 2033
- Table 25: Global Healthcare Data Industry Revenue billion Forecast, by Deployment 2020 & 2033
- Table 26: Global Healthcare Data Industry Volume K Unit Forecast, by Deployment 2020 & 2033
- Table 27: Global Healthcare Data Industry Revenue billion Forecast, by Application 2020 & 2033
- Table 28: Global Healthcare Data Industry Volume K Unit Forecast, by Application 2020 & 2033
- Table 29: Global Healthcare Data Industry Revenue billion Forecast, by Country 2020 & 2033
- Table 30: Global Healthcare Data Industry Volume K Unit Forecast, by Country 2020 & 2033
- Table 31: Germany Healthcare Data Industry Revenue (billion) Forecast, by Application 2020 & 2033
- Table 32: Germany Healthcare Data Industry Volume (K Unit) Forecast, by Application 2020 & 2033
- Table 33: United Kingdom Healthcare Data Industry Revenue (billion) Forecast, by Application 2020 & 2033
- Table 34: United Kingdom Healthcare Data Industry Volume (K Unit) Forecast, by Application 2020 & 2033
- Table 35: France Healthcare Data Industry Revenue (billion) Forecast, by Application 2020 & 2033
- Table 36: France Healthcare Data Industry Volume (K Unit) Forecast, by Application 2020 & 2033
- Table 37: Italy Healthcare Data Industry Revenue (billion) Forecast, by Application 2020 & 2033
- Table 38: Italy Healthcare Data Industry Volume (K Unit) Forecast, by Application 2020 & 2033
- Table 39: Spain Healthcare Data Industry Revenue (billion) Forecast, by Application 2020 & 2033
- Table 40: Spain Healthcare Data Industry Volume (K Unit) Forecast, by Application 2020 & 2033
- Table 41: Rest of Europe Healthcare Data Industry Revenue (billion) Forecast, by Application 2020 & 2033
- Table 42: Rest of Europe Healthcare Data Industry Volume (K Unit) Forecast, by Application 2020 & 2033
- Table 43: Global Healthcare Data Industry Revenue billion Forecast, by Component 2020 & 2033
- Table 44: Global Healthcare Data Industry Volume K Unit Forecast, by Component 2020 & 2033
- Table 45: Global Healthcare Data Industry Revenue billion Forecast, by Deployment 2020 & 2033
- Table 46: Global Healthcare Data Industry Volume K Unit Forecast, by Deployment 2020 & 2033
- Table 47: Global Healthcare Data Industry Revenue billion Forecast, by Application 2020 & 2033
- Table 48: Global Healthcare Data Industry Volume K Unit Forecast, by Application 2020 & 2033
- Table 49: Global Healthcare Data Industry Revenue billion Forecast, by Country 2020 & 2033
- Table 50: Global Healthcare Data Industry Volume K Unit Forecast, by Country 2020 & 2033
- Table 51: China Healthcare Data Industry Revenue (billion) Forecast, by Application 2020 & 2033
- Table 52: China Healthcare Data Industry Volume (K Unit) Forecast, by Application 2020 & 2033
- Table 53: Japan Healthcare Data Industry Revenue (billion) Forecast, by Application 2020 & 2033
- Table 54: Japan Healthcare Data Industry Volume (K Unit) Forecast, by Application 2020 & 2033
- Table 55: India Healthcare Data Industry Revenue (billion) Forecast, by Application 2020 & 2033
- Table 56: India Healthcare Data Industry Volume (K Unit) Forecast, by Application 2020 & 2033
- Table 57: Australia Healthcare Data Industry Revenue (billion) Forecast, by Application 2020 & 2033
- Table 58: Australia Healthcare Data Industry Volume (K Unit) Forecast, by Application 2020 & 2033
- Table 59: South Korea Healthcare Data Industry Revenue (billion) Forecast, by Application 2020 & 2033
- Table 60: South Korea Healthcare Data Industry Volume (K Unit) Forecast, by Application 2020 & 2033
- Table 61: Rest of Asia Pacific Healthcare Data Industry Revenue (billion) Forecast, by Application 2020 & 2033
- Table 62: Rest of Asia Pacific Healthcare Data Industry Volume (K Unit) Forecast, by Application 2020 & 2033
- Table 63: Global Healthcare Data Industry Revenue billion Forecast, by Component 2020 & 2033
- Table 64: Global Healthcare Data Industry Volume K Unit Forecast, by Component 2020 & 2033
- Table 65: Global Healthcare Data Industry Revenue billion Forecast, by Deployment 2020 & 2033
- Table 66: Global Healthcare Data Industry Volume K Unit Forecast, by Deployment 2020 & 2033
- Table 67: Global Healthcare Data Industry Revenue billion Forecast, by Application 2020 & 2033
- Table 68: Global Healthcare Data Industry Volume K Unit Forecast, by Application 2020 & 2033
- Table 69: Global Healthcare Data Industry Revenue billion Forecast, by Country 2020 & 2033
- Table 70: Global Healthcare Data Industry Volume K Unit Forecast, by Country 2020 & 2033
- Table 71: GCC Healthcare Data Industry Revenue (billion) Forecast, by Application 2020 & 2033
- Table 72: GCC Healthcare Data Industry Volume (K Unit) Forecast, by Application 2020 & 2033
- Table 73: South Africa Healthcare Data Industry Revenue (billion) Forecast, by Application 2020 & 2033
- Table 74: South Africa Healthcare Data Industry Volume (K Unit) Forecast, by Application 2020 & 2033
- Table 75: Rest of Middle East and Africa Healthcare Data Industry Revenue (billion) Forecast, by Application 2020 & 2033
- Table 76: Rest of Middle East and Africa Healthcare Data Industry Volume (K Unit) Forecast, by Application 2020 & 2033
- Table 77: Global Healthcare Data Industry Revenue billion Forecast, by Component 2020 & 2033
- Table 78: Global Healthcare Data Industry Volume K Unit Forecast, by Component 2020 & 2033
- Table 79: Global Healthcare Data Industry Revenue billion Forecast, by Deployment 2020 & 2033
- Table 80: Global Healthcare Data Industry Volume K Unit Forecast, by Deployment 2020 & 2033
- Table 81: Global Healthcare Data Industry Revenue billion Forecast, by Application 2020 & 2033
- Table 82: Global Healthcare Data Industry Volume K Unit Forecast, by Application 2020 & 2033
- Table 83: Global Healthcare Data Industry Revenue billion Forecast, by Country 2020 & 2033
- Table 84: Global Healthcare Data Industry Volume K Unit Forecast, by Country 2020 & 2033
- Table 85: Brazil Healthcare Data Industry Revenue (billion) Forecast, by Application 2020 & 2033
- Table 86: Brazil Healthcare Data Industry Volume (K Unit) Forecast, by Application 2020 & 2033
- Table 87: Argentina Healthcare Data Industry Revenue (billion) Forecast, by Application 2020 & 2033
- Table 88: Argentina Healthcare Data Industry Volume (K Unit) Forecast, by Application 2020 & 2033
- Table 89: Rest of South America Healthcare Data Industry Revenue (billion) Forecast, by Application 2020 & 2033
- Table 90: Rest of South America Healthcare Data Industry Volume (K Unit) Forecast, by Application 2020 & 2033
Frequently Asked Questions
1. What is the projected Compound Annual Growth Rate (CAGR) of the Healthcare Data Industry?
The projected CAGR is approximately 13.36%.
2. Which companies are prominent players in the Healthcare Data Industry?
Key companies in the market include DELL EMC, Oracle (Cerner Corporation), Epic Systems Corporation, Optum Inc, General Electric Company (GE Healthcare), International Business Machines Corporation (IBM), ExlService Holdings Inc, Health Fidelity Inc, Allscripts Healthcare Solutions Inc, Flatiron Health, Apixio, SAS INSTITUTE INC, Innovaccer Inc.
3. What are the main segments of the Healthcare Data Industry?
The market segments include Component, Deployment, Application.
4. Can you provide details about the market size?
The market size is estimated to be USD 3.1 billion as of 2022.
5. What are some drivers contributing to market growth?
Increase in Demand for Analytics Solutions for Population Health Management; Rise in Need for Business Intelligence to Optimize Health Administration and Strategy; Surge in Adoption of Big Data in the Healthcare Industry.
6. What are the notable trends driving market growth?
Cloud Segment is Expected to Register a High Growth Rate Over the Forecast Period.
7. Are there any restraints impacting market growth?
Security Concerns Related to Sensitive Patients Medical Data; High Cost of Implementation and Deployment.
8. Can you provide examples of recent developments in the market?
March 2022: Microsoft launched Azure Health Data Services in the United States. It is a platform as a service (PAAS) offering designed exclusively to support protected health information (PHI) in the cloud.
9. What pricing options are available for accessing the report?
Pricing options include single-user, multi-user, and enterprise licenses priced at USD 4750, USD 5250, and USD 8750 respectively.
10. Is the market size provided in terms of value or volume?
The market size is provided in terms of value, measured in billion and volume, measured in K Unit.
11. Are there any specific market keywords associated with the report?
Yes, the market keyword associated with the report is "Healthcare Data Industry," which aids in identifying and referencing the specific market segment covered.
12. How do I determine which pricing option suits my needs best?
The pricing options vary based on user requirements and access needs. Individual users may opt for single-user licenses, while businesses requiring broader access may choose multi-user or enterprise licenses for cost-effective access to the report.
13. Are there any additional resources or data provided in the Healthcare Data Industry report?
While the report offers comprehensive insights, it's advisable to review the specific contents or supplementary materials provided to ascertain if additional resources or data are available.
14. How can I stay updated on further developments or reports in the Healthcare Data Industry?
To stay informed about further developments, trends, and reports in the Healthcare Data Industry, consider subscribing to industry newsletters, following relevant companies and organizations, or regularly checking reputable industry news sources and publications.
Methodology
Step 1 - Identification of Relevant Samples Size from Population Database


Step 2 - Approaches for Defining Global Market Size (Value, Volume* & Price*)

Note*: In applicable scenarios
Step 3 - Data Sources
Primary Research
- Web Analytics
- Survey Reports
- Research Institute
- Latest Research Reports
- Opinion Leaders
Secondary Research
- Annual Reports
- White Paper
- Latest Press Release
- Industry Association
- Paid Database
- Investor Presentations

Step 4 - Data Triangulation
Involves using different sources of information in order to increase the validity of a study
These sources are likely to be stakeholders in a program - participants, other researchers, program staff, other community members, and so on.
Then we put all data in single framework & apply various statistical tools to find out the dynamic on the market.
During the analysis stage, feedback from the stakeholder groups would be compared to determine areas of agreement as well as areas of divergence