
Key Insights
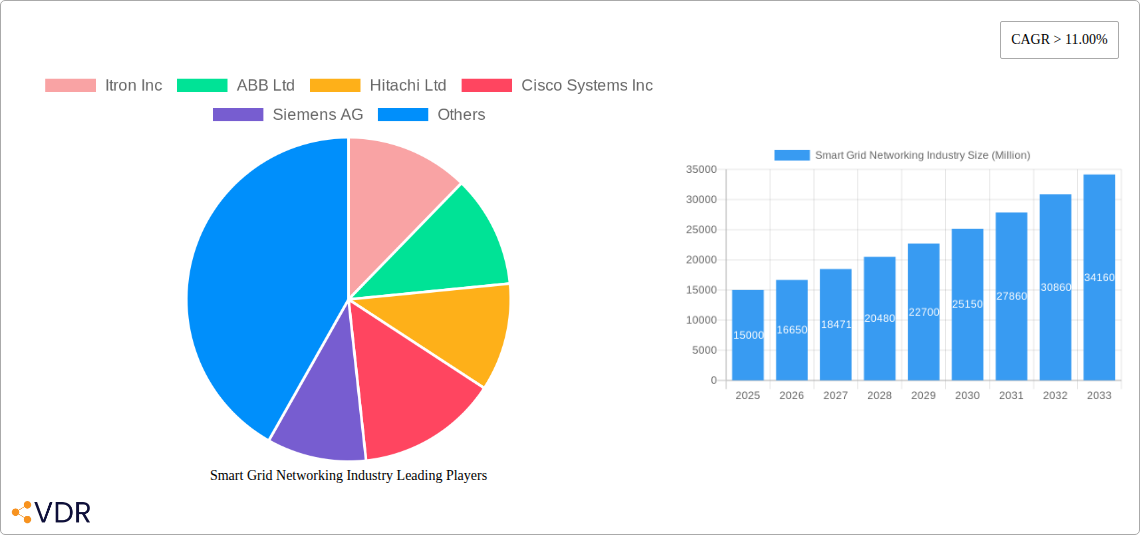
The smart grid networking market is experiencing robust growth, driven by the increasing need for reliable, efficient, and sustainable energy distribution. A compound annual growth rate (CAGR) exceeding 11% from 2019 to 2033 indicates a significant expansion of this market. This growth is fueled by several key factors. Firstly, the global push towards renewable energy integration necessitates advanced grid management systems capable of handling intermittent power sources. Smart grid technologies, including advanced metering infrastructure (AMI), demand response programs, and sophisticated transmission systems, are crucial for optimizing energy distribution and improving grid stability. Secondly, the rising adoption of smart city initiatives is creating a strong demand for smart grid networking solutions. These solutions improve energy efficiency in urban areas, reduce energy costs, and enhance the overall quality of life. Finally, government regulations and incentives aimed at modernizing aging grid infrastructure further contribute to market growth. Major players like Itron, ABB, and Siemens are actively investing in research and development, driving innovation within the sector. While initial investment costs might pose a restraint for some regions, the long-term benefits of improved efficiency and reduced energy loss significantly outweigh the upfront investment.
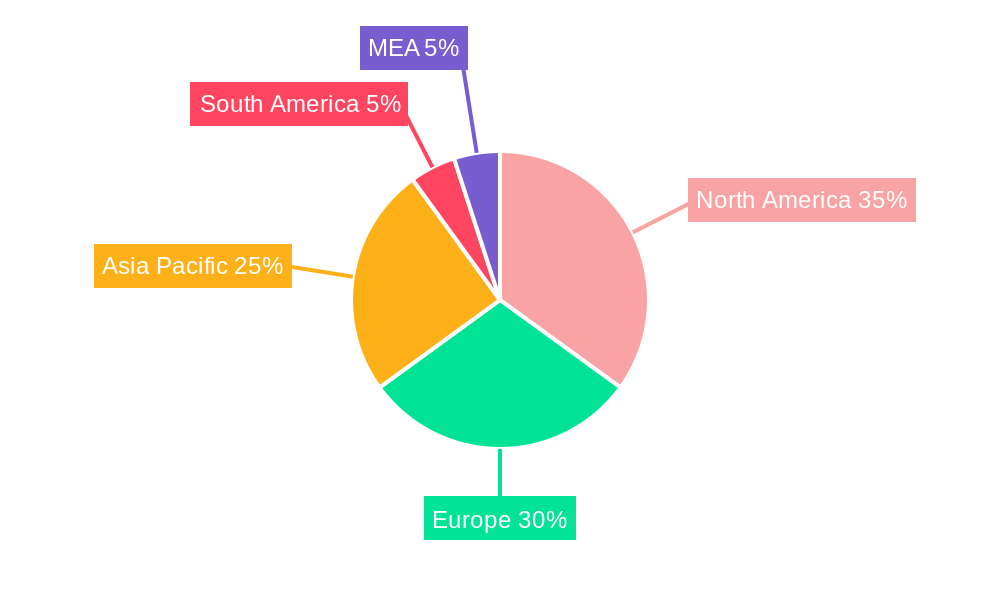
Geographic distribution reveals a strong presence in North America and Europe, driven by early adoption and mature infrastructure. However, Asia Pacific is projected to witness significant growth in the coming years, fueled by rapid urbanization and expanding energy demands, particularly in countries like China and India. While the market is currently dominated by established players, new entrants are emerging, focusing on specialized technologies and niche applications. The market segmentation highlights the significance of AMI, which is experiencing high demand due to its ability to provide real-time energy consumption data, enabling improved grid management and facilitating better consumer engagement. The ongoing development and integration of Internet of Things (IoT) technologies and advanced analytics are expected to further enhance the functionalities of smart grid networks, creating new opportunities for market expansion throughout the forecast period.
This comprehensive report provides a detailed analysis of the Smart Grid Networking industry, encompassing market dynamics, growth trends, regional insights, and key player strategies. The study period covers 2019-2033, with a focus on the forecast period (2025-2033), utilizing 2025 as the base and estimated year. The report delves into the parent market of Energy Management Systems and its child market, Smart Grid Networking, offering granular insights for informed decision-making. The total market size is projected to reach xx Million by 2033.
Smart Grid Networking Industry Market Dynamics & Structure
This section analyzes the competitive landscape of the Smart Grid Networking industry, examining market concentration, technological innovation, regulatory influence, and M&A activity. The market is moderately fragmented, with key players such as Itron Inc, ABB Ltd, Hitachi Ltd, Cisco Systems Inc, Siemens AG, Schneider Electric SE, Eaton Corporation PLC, General Electric Company, Honeywell International Inc, and Osaki Electric Co Ltd holding significant market share. However, the entry of new players with innovative solutions continues to increase competitiveness.
- Market Concentration: Moderately fragmented, with the top 5 players holding an estimated xx% market share in 2025.
- Technological Innovation: Driven by advancements in communication technologies (e.g., 5G, IoT), data analytics, and AI-powered solutions for grid optimization. Barriers include high initial investment costs and integration complexities.
- Regulatory Frameworks: Government policies promoting renewable energy integration and grid modernization are key drivers. Varying regulations across regions pose challenges for standardization and market penetration.
- Competitive Product Substitutes: Limited direct substitutes, but competition exists from traditional grid management solutions and emerging decentralized energy systems.
- End-User Demographics: Primarily utilities, power generation companies, and industrial consumers. The increasing adoption of smart meters and distributed generation is expanding the end-user base.
- M&A Trends: Significant M&A activity observed in recent years, with Schneider Electric's acquisition of DC Systems BV (2021) being a notable example. The volume of deals is predicted to remain consistent at xx deals per year during the forecast period.
Smart Grid Networking Industry Growth Trends & Insights
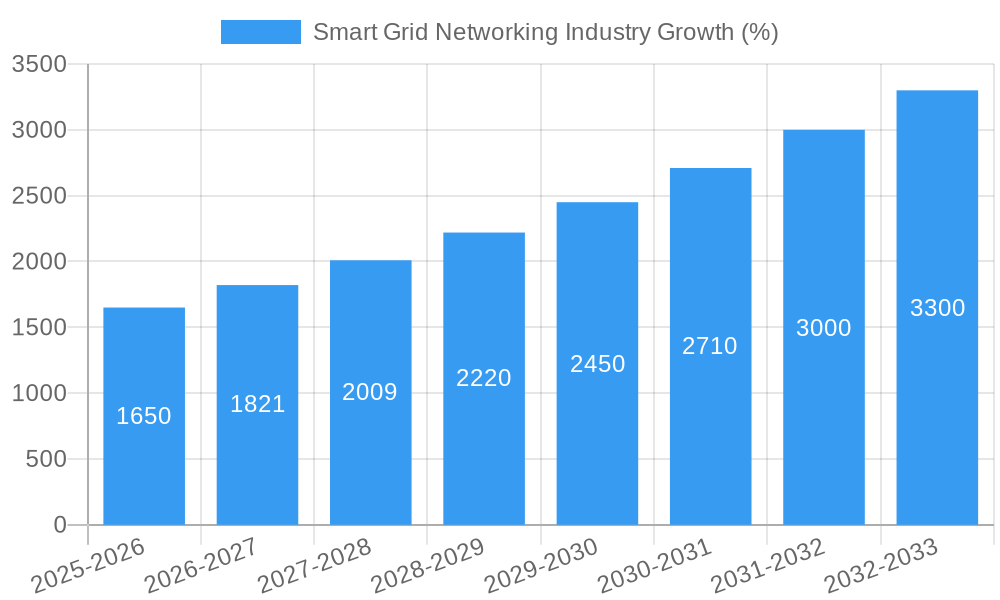
The Smart Grid Networking market is experiencing robust growth, driven by the global shift towards renewable energy, increasing energy demands, and the need for enhanced grid efficiency and reliability. The market size grew from xx Million in 2019 to xx Million in 2024 and is projected to reach xx Million by 2033, exhibiting a CAGR of xx% during the forecast period. This growth is fueled by rising investments in AMI, growing adoption of demand response programs, and expanding smart city initiatives. Technological advancements such as AI and machine learning are significantly improving grid management and optimization, further enhancing market expansion. Consumer behavior is shifting toward increased energy consciousness and demand for sustainable energy solutions, creating a favorable environment for smart grid adoption.
Dominant Regions, Countries, or Segments in Smart Grid Networking Industry
North America and Europe currently dominate the Smart Grid Networking market, driven by established infrastructure, supportive government policies, and high adoption rates of advanced metering infrastructure (AMI). However, Asia-Pacific is projected to witness significant growth during the forecast period, fueled by rapid urbanization, economic development, and increasing investments in renewable energy projects.
- Leading Segment: Advanced Metering Infrastructure (AMI) is the largest segment, accounting for xx% of the market in 2025. This is driven by government mandates for smart meter deployments and the increasing need for real-time energy consumption data.
- Key Regional Drivers:
- North America: Strong regulatory support, high adoption rates, and advanced technological infrastructure.
- Europe: Focus on energy efficiency and renewable energy integration, coupled with significant investments in grid modernization projects.
- Asia-Pacific: Rapid urbanization, expanding renewable energy capacities, and growing government support for smart grid initiatives.
Smart Grid Networking Industry Product Landscape
The smart grid networking product landscape comprises hardware components (e.g., smart meters, communication networks, sensors), software solutions (e.g., grid management systems, data analytics platforms), and services (e.g., installation, maintenance, and support). Product innovation focuses on improving interoperability, enhancing data security, and integrating renewable energy sources seamlessly into the grid. Key features include improved data accuracy, reduced energy losses, enhanced grid stability, and improved customer engagement.
Key Drivers, Barriers & Challenges in Smart Grid Networking Industry
Key Drivers:
- Increasing demand for reliable and efficient energy supply.
- Government initiatives promoting renewable energy integration and grid modernization.
- Advancements in communication technologies (e.g., 5G, IoT) and data analytics.
Challenges & Restraints:
- High initial investment costs associated with smart grid infrastructure deployment.
- Interoperability challenges among different grid components.
- Cybersecurity risks associated with connected grid systems (estimated annual losses of xx Million).
- Regulatory complexities and varying standards across different regions.
Emerging Opportunities in Smart Grid Networking Industry
- Microgrids and distributed generation: Expanding opportunities for localized energy management and resilience.
- Integration of electric vehicles (EVs) into the grid: Managing the increasing demand for EV charging infrastructure and its impact on grid stability.
- Advanced data analytics and AI-powered solutions: Enabling proactive grid management and optimized resource allocation.
Growth Accelerators in the Smart Grid Networking Industry
Technological advancements, particularly in AI, machine learning, and IoT, are significant growth catalysts. Strategic partnerships between utilities, technology providers, and government agencies are fostering innovation and accelerating market adoption. The expansion of smart city initiatives and the growing need for energy efficiency are further driving market growth.
Key Players Shaping the Smart Grid Networking Market
- Itron Inc
- ABB Ltd
- Hitachi Ltd
- Cisco Systems Inc
- Siemens AG
- Schneider Electric SE
- Eaton Corporation PLC
- General Electric Company
- Honeywell International Inc
- Osaki Electric Co Ltd
Notable Milestones in Smart Grid Networking Industry Sector
- September 2020: Siemens Energy launched its Unified Power Flow Controller (UPFC) PLUS, enhancing grid stabilization capabilities.
- January 2021: Schneider Electric acquired DC Systems BV, strengthening its position in smart grid technologies.
In-Depth Smart Grid Networking Industry Market Outlook
The Smart Grid Networking market is poised for continued expansion, driven by the increasing adoption of smart technologies, the integration of renewable energy sources, and the growing emphasis on grid modernization and resilience. Strategic partnerships, technological advancements, and supportive government policies will further propel market growth, creating significant opportunities for players in the industry. The focus will shift towards more sophisticated data analytics, enhanced security measures, and the integration of emerging technologies like blockchain and AI for optimized grid operation and increased efficiency.
Smart Grid Networking Industry Segmentation
-
1. Technology Application Area
- 1.1. Transmission
- 1.2. Demand Response
- 1.3. Advanced Metering Infrastructure (AMI)
- 1.4. Other Technology Application Areas
Smart Grid Networking Industry Segmentation By Geography
- 1. North America
- 2. Europe
- 3. Asia Pacific
- 4. South America
- 5. Middle East
Smart Grid Networking Industry REPORT HIGHLIGHTS
| Aspects | Details |
|---|---|
| Study Period | 2019-2033 |
| Base Year | 2024 |
| Estimated Year | 2025 |
| Forecast Period | 2025-2033 |
| Historical Period | 2019-2024 |
| Growth Rate | CAGR of > 11.00% from 2019-2033 |
| Segmentation |
|
Table of Contents
- 1. Introduction
- 1.1. Research Scope
- 1.2. Market Segmentation
- 1.3. Research Methodology
- 1.4. Definitions and Assumptions
- 2. Executive Summary
- 2.1. Introduction
- 3. Market Dynamics
- 3.1. Introduction
- 3.2. Market Drivers
- 3.2.1. 4.; Growing Power Demand from the Commercial and Industrial Sectors
- 3.3. Market Restrains
- 3.3.1. 4.; Stringent Environmental and Safety Regulations
- 3.4. Market Trends
- 3.4.1. Advanced Metering Infrastructure (AMI) to Witness Significant Growth
- 4. Market Factor Analysis
- 4.1. Porters Five Forces
- 4.2. Supply/Value Chain
- 4.3. PESTEL analysis
- 4.4. Market Entropy
- 4.5. Patent/Trademark Analysis
- 5. Global Smart Grid Networking Industry Analysis, Insights and Forecast, 2019-2031
- 5.1. Market Analysis, Insights and Forecast - by Technology Application Area
- 5.1.1. Transmission
- 5.1.2. Demand Response
- 5.1.3. Advanced Metering Infrastructure (AMI)
- 5.1.4. Other Technology Application Areas
- 5.2. Market Analysis, Insights and Forecast - by Region
- 5.2.1. North America
- 5.2.2. Europe
- 5.2.3. Asia Pacific
- 5.2.4. South America
- 5.2.5. Middle East
- 5.1. Market Analysis, Insights and Forecast - by Technology Application Area
- 6. North America Smart Grid Networking Industry Analysis, Insights and Forecast, 2019-2031
- 6.1. Market Analysis, Insights and Forecast - by Technology Application Area
- 6.1.1. Transmission
- 6.1.2. Demand Response
- 6.1.3. Advanced Metering Infrastructure (AMI)
- 6.1.4. Other Technology Application Areas
- 6.1. Market Analysis, Insights and Forecast - by Technology Application Area
- 7. Europe Smart Grid Networking Industry Analysis, Insights and Forecast, 2019-2031
- 7.1. Market Analysis, Insights and Forecast - by Technology Application Area
- 7.1.1. Transmission
- 7.1.2. Demand Response
- 7.1.3. Advanced Metering Infrastructure (AMI)
- 7.1.4. Other Technology Application Areas
- 7.1. Market Analysis, Insights and Forecast - by Technology Application Area
- 8. Asia Pacific Smart Grid Networking Industry Analysis, Insights and Forecast, 2019-2031
- 8.1. Market Analysis, Insights and Forecast - by Technology Application Area
- 8.1.1. Transmission
- 8.1.2. Demand Response
- 8.1.3. Advanced Metering Infrastructure (AMI)
- 8.1.4. Other Technology Application Areas
- 8.1. Market Analysis, Insights and Forecast - by Technology Application Area
- 9. South America Smart Grid Networking Industry Analysis, Insights and Forecast, 2019-2031
- 9.1. Market Analysis, Insights and Forecast - by Technology Application Area
- 9.1.1. Transmission
- 9.1.2. Demand Response
- 9.1.3. Advanced Metering Infrastructure (AMI)
- 9.1.4. Other Technology Application Areas
- 9.1. Market Analysis, Insights and Forecast - by Technology Application Area
- 10. Middle East Smart Grid Networking Industry Analysis, Insights and Forecast, 2019-2031
- 10.1. Market Analysis, Insights and Forecast - by Technology Application Area
- 10.1.1. Transmission
- 10.1.2. Demand Response
- 10.1.3. Advanced Metering Infrastructure (AMI)
- 10.1.4. Other Technology Application Areas
- 10.1. Market Analysis, Insights and Forecast - by Technology Application Area
- 11. North America Smart Grid Networking Industry Analysis, Insights and Forecast, 2019-2031
- 11.1. Market Analysis, Insights and Forecast - By Country/Sub-region
- 11.1.1 United States
- 11.1.2 Canada
- 11.1.3 Mexico
- 12. Europe Smart Grid Networking Industry Analysis, Insights and Forecast, 2019-2031
- 12.1. Market Analysis, Insights and Forecast - By Country/Sub-region
- 12.1.1 Germany
- 12.1.2 United Kingdom
- 12.1.3 France
- 12.1.4 Spain
- 12.1.5 Italy
- 12.1.6 Spain
- 12.1.7 Belgium
- 12.1.8 Netherland
- 12.1.9 Nordics
- 12.1.10 Rest of Europe
- 13. Asia Pacific Smart Grid Networking Industry Analysis, Insights and Forecast, 2019-2031
- 13.1. Market Analysis, Insights and Forecast - By Country/Sub-region
- 13.1.1 China
- 13.1.2 Japan
- 13.1.3 India
- 13.1.4 South Korea
- 13.1.5 Southeast Asia
- 13.1.6 Australia
- 13.1.7 Indonesia
- 13.1.8 Phillipes
- 13.1.9 Singapore
- 13.1.10 Thailandc
- 13.1.11 Rest of Asia Pacific
- 14. South America Smart Grid Networking Industry Analysis, Insights and Forecast, 2019-2031
- 14.1. Market Analysis, Insights and Forecast - By Country/Sub-region
- 14.1.1 Brazil
- 14.1.2 Argentina
- 14.1.3 Peru
- 14.1.4 Chile
- 14.1.5 Colombia
- 14.1.6 Ecuador
- 14.1.7 Venezuela
- 14.1.8 Rest of South America
- 15. North America Smart Grid Networking Industry Analysis, Insights and Forecast, 2019-2031
- 15.1. Market Analysis, Insights and Forecast - By Country/Sub-region
- 15.1.1 United States
- 15.1.2 Canada
- 15.1.3 Mexico
- 16. MEA Smart Grid Networking Industry Analysis, Insights and Forecast, 2019-2031
- 16.1. Market Analysis, Insights and Forecast - By Country/Sub-region
- 16.1.1 United Arab Emirates
- 16.1.2 Saudi Arabia
- 16.1.3 South Africa
- 16.1.4 Rest of Middle East and Africa
- 17. Competitive Analysis
- 17.1. Global Market Share Analysis 2024
- 17.2. Company Profiles
- 17.2.1 Itron Inc
- 17.2.1.1. Overview
- 17.2.1.2. Products
- 17.2.1.3. SWOT Analysis
- 17.2.1.4. Recent Developments
- 17.2.1.5. Financials (Based on Availability)
- 17.2.2 ABB Ltd
- 17.2.2.1. Overview
- 17.2.2.2. Products
- 17.2.2.3. SWOT Analysis
- 17.2.2.4. Recent Developments
- 17.2.2.5. Financials (Based on Availability)
- 17.2.3 Hitachi Ltd
- 17.2.3.1. Overview
- 17.2.3.2. Products
- 17.2.3.3. SWOT Analysis
- 17.2.3.4. Recent Developments
- 17.2.3.5. Financials (Based on Availability)
- 17.2.4 Cisco Systems Inc
- 17.2.4.1. Overview
- 17.2.4.2. Products
- 17.2.4.3. SWOT Analysis
- 17.2.4.4. Recent Developments
- 17.2.4.5. Financials (Based on Availability)
- 17.2.5 Siemens AG
- 17.2.5.1. Overview
- 17.2.5.2. Products
- 17.2.5.3. SWOT Analysis
- 17.2.5.4. Recent Developments
- 17.2.5.5. Financials (Based on Availability)
- 17.2.6 Schneider Electric SE
- 17.2.6.1. Overview
- 17.2.6.2. Products
- 17.2.6.3. SWOT Analysis
- 17.2.6.4. Recent Developments
- 17.2.6.5. Financials (Based on Availability)
- 17.2.7 Eaton Corporation PLC
- 17.2.7.1. Overview
- 17.2.7.2. Products
- 17.2.7.3. SWOT Analysis
- 17.2.7.4. Recent Developments
- 17.2.7.5. Financials (Based on Availability)
- 17.2.8 General Electric Company
- 17.2.8.1. Overview
- 17.2.8.2. Products
- 17.2.8.3. SWOT Analysis
- 17.2.8.4. Recent Developments
- 17.2.8.5. Financials (Based on Availability)
- 17.2.9 Honeywell International Inc *List Not Exhaustive
- 17.2.9.1. Overview
- 17.2.9.2. Products
- 17.2.9.3. SWOT Analysis
- 17.2.9.4. Recent Developments
- 17.2.9.5. Financials (Based on Availability)
- 17.2.10 Osaki Electric Co Ltd
- 17.2.10.1. Overview
- 17.2.10.2. Products
- 17.2.10.3. SWOT Analysis
- 17.2.10.4. Recent Developments
- 17.2.10.5. Financials (Based on Availability)
- 17.2.1 Itron Inc
List of Figures
- Figure 1: Global Smart Grid Networking Industry Revenue Breakdown (Million, %) by Region 2024 & 2032
- Figure 2: North America Smart Grid Networking Industry Revenue (Million), by Country 2024 & 2032
- Figure 3: North America Smart Grid Networking Industry Revenue Share (%), by Country 2024 & 2032
- Figure 4: Europe Smart Grid Networking Industry Revenue (Million), by Country 2024 & 2032
- Figure 5: Europe Smart Grid Networking Industry Revenue Share (%), by Country 2024 & 2032
- Figure 6: Asia Pacific Smart Grid Networking Industry Revenue (Million), by Country 2024 & 2032
- Figure 7: Asia Pacific Smart Grid Networking Industry Revenue Share (%), by Country 2024 & 2032
- Figure 8: South America Smart Grid Networking Industry Revenue (Million), by Country 2024 & 2032
- Figure 9: South America Smart Grid Networking Industry Revenue Share (%), by Country 2024 & 2032
- Figure 10: North America Smart Grid Networking Industry Revenue (Million), by Country 2024 & 2032
- Figure 11: North America Smart Grid Networking Industry Revenue Share (%), by Country 2024 & 2032
- Figure 12: MEA Smart Grid Networking Industry Revenue (Million), by Country 2024 & 2032
- Figure 13: MEA Smart Grid Networking Industry Revenue Share (%), by Country 2024 & 2032
- Figure 14: North America Smart Grid Networking Industry Revenue (Million), by Technology Application Area 2024 & 2032
- Figure 15: North America Smart Grid Networking Industry Revenue Share (%), by Technology Application Area 2024 & 2032
- Figure 16: North America Smart Grid Networking Industry Revenue (Million), by Country 2024 & 2032
- Figure 17: North America Smart Grid Networking Industry Revenue Share (%), by Country 2024 & 2032
- Figure 18: Europe Smart Grid Networking Industry Revenue (Million), by Technology Application Area 2024 & 2032
- Figure 19: Europe Smart Grid Networking Industry Revenue Share (%), by Technology Application Area 2024 & 2032
- Figure 20: Europe Smart Grid Networking Industry Revenue (Million), by Country 2024 & 2032
- Figure 21: Europe Smart Grid Networking Industry Revenue Share (%), by Country 2024 & 2032
- Figure 22: Asia Pacific Smart Grid Networking Industry Revenue (Million), by Technology Application Area 2024 & 2032
- Figure 23: Asia Pacific Smart Grid Networking Industry Revenue Share (%), by Technology Application Area 2024 & 2032
- Figure 24: Asia Pacific Smart Grid Networking Industry Revenue (Million), by Country 2024 & 2032
- Figure 25: Asia Pacific Smart Grid Networking Industry Revenue Share (%), by Country 2024 & 2032
- Figure 26: South America Smart Grid Networking Industry Revenue (Million), by Technology Application Area 2024 & 2032
- Figure 27: South America Smart Grid Networking Industry Revenue Share (%), by Technology Application Area 2024 & 2032
- Figure 28: South America Smart Grid Networking Industry Revenue (Million), by Country 2024 & 2032
- Figure 29: South America Smart Grid Networking Industry Revenue Share (%), by Country 2024 & 2032
- Figure 30: Middle East Smart Grid Networking Industry Revenue (Million), by Technology Application Area 2024 & 2032
- Figure 31: Middle East Smart Grid Networking Industry Revenue Share (%), by Technology Application Area 2024 & 2032
- Figure 32: Middle East Smart Grid Networking Industry Revenue (Million), by Country 2024 & 2032
- Figure 33: Middle East Smart Grid Networking Industry Revenue Share (%), by Country 2024 & 2032
List of Tables
- Table 1: Global Smart Grid Networking Industry Revenue Million Forecast, by Region 2019 & 2032
- Table 2: Global Smart Grid Networking Industry Revenue Million Forecast, by Technology Application Area 2019 & 2032
- Table 3: Global Smart Grid Networking Industry Revenue Million Forecast, by Region 2019 & 2032
- Table 4: Global Smart Grid Networking Industry Revenue Million Forecast, by Country 2019 & 2032
- Table 5: United States Smart Grid Networking Industry Revenue (Million) Forecast, by Application 2019 & 2032
- Table 6: Canada Smart Grid Networking Industry Revenue (Million) Forecast, by Application 2019 & 2032
- Table 7: Mexico Smart Grid Networking Industry Revenue (Million) Forecast, by Application 2019 & 2032
- Table 8: Global Smart Grid Networking Industry Revenue Million Forecast, by Country 2019 & 2032
- Table 9: Germany Smart Grid Networking Industry Revenue (Million) Forecast, by Application 2019 & 2032
- Table 10: United Kingdom Smart Grid Networking Industry Revenue (Million) Forecast, by Application 2019 & 2032
- Table 11: France Smart Grid Networking Industry Revenue (Million) Forecast, by Application 2019 & 2032
- Table 12: Spain Smart Grid Networking Industry Revenue (Million) Forecast, by Application 2019 & 2032
- Table 13: Italy Smart Grid Networking Industry Revenue (Million) Forecast, by Application 2019 & 2032
- Table 14: Spain Smart Grid Networking Industry Revenue (Million) Forecast, by Application 2019 & 2032
- Table 15: Belgium Smart Grid Networking Industry Revenue (Million) Forecast, by Application 2019 & 2032
- Table 16: Netherland Smart Grid Networking Industry Revenue (Million) Forecast, by Application 2019 & 2032
- Table 17: Nordics Smart Grid Networking Industry Revenue (Million) Forecast, by Application 2019 & 2032
- Table 18: Rest of Europe Smart Grid Networking Industry Revenue (Million) Forecast, by Application 2019 & 2032
- Table 19: Global Smart Grid Networking Industry Revenue Million Forecast, by Country 2019 & 2032
- Table 20: China Smart Grid Networking Industry Revenue (Million) Forecast, by Application 2019 & 2032
- Table 21: Japan Smart Grid Networking Industry Revenue (Million) Forecast, by Application 2019 & 2032
- Table 22: India Smart Grid Networking Industry Revenue (Million) Forecast, by Application 2019 & 2032
- Table 23: South Korea Smart Grid Networking Industry Revenue (Million) Forecast, by Application 2019 & 2032
- Table 24: Southeast Asia Smart Grid Networking Industry Revenue (Million) Forecast, by Application 2019 & 2032
- Table 25: Australia Smart Grid Networking Industry Revenue (Million) Forecast, by Application 2019 & 2032
- Table 26: Indonesia Smart Grid Networking Industry Revenue (Million) Forecast, by Application 2019 & 2032
- Table 27: Phillipes Smart Grid Networking Industry Revenue (Million) Forecast, by Application 2019 & 2032
- Table 28: Singapore Smart Grid Networking Industry Revenue (Million) Forecast, by Application 2019 & 2032
- Table 29: Thailandc Smart Grid Networking Industry Revenue (Million) Forecast, by Application 2019 & 2032
- Table 30: Rest of Asia Pacific Smart Grid Networking Industry Revenue (Million) Forecast, by Application 2019 & 2032
- Table 31: Global Smart Grid Networking Industry Revenue Million Forecast, by Country 2019 & 2032
- Table 32: Brazil Smart Grid Networking Industry Revenue (Million) Forecast, by Application 2019 & 2032
- Table 33: Argentina Smart Grid Networking Industry Revenue (Million) Forecast, by Application 2019 & 2032
- Table 34: Peru Smart Grid Networking Industry Revenue (Million) Forecast, by Application 2019 & 2032
- Table 35: Chile Smart Grid Networking Industry Revenue (Million) Forecast, by Application 2019 & 2032
- Table 36: Colombia Smart Grid Networking Industry Revenue (Million) Forecast, by Application 2019 & 2032
- Table 37: Ecuador Smart Grid Networking Industry Revenue (Million) Forecast, by Application 2019 & 2032
- Table 38: Venezuela Smart Grid Networking Industry Revenue (Million) Forecast, by Application 2019 & 2032
- Table 39: Rest of South America Smart Grid Networking Industry Revenue (Million) Forecast, by Application 2019 & 2032
- Table 40: Global Smart Grid Networking Industry Revenue Million Forecast, by Country 2019 & 2032
- Table 41: United States Smart Grid Networking Industry Revenue (Million) Forecast, by Application 2019 & 2032
- Table 42: Canada Smart Grid Networking Industry Revenue (Million) Forecast, by Application 2019 & 2032
- Table 43: Mexico Smart Grid Networking Industry Revenue (Million) Forecast, by Application 2019 & 2032
- Table 44: Global Smart Grid Networking Industry Revenue Million Forecast, by Country 2019 & 2032
- Table 45: United Arab Emirates Smart Grid Networking Industry Revenue (Million) Forecast, by Application 2019 & 2032
- Table 46: Saudi Arabia Smart Grid Networking Industry Revenue (Million) Forecast, by Application 2019 & 2032
- Table 47: South Africa Smart Grid Networking Industry Revenue (Million) Forecast, by Application 2019 & 2032
- Table 48: Rest of Middle East and Africa Smart Grid Networking Industry Revenue (Million) Forecast, by Application 2019 & 2032
- Table 49: Global Smart Grid Networking Industry Revenue Million Forecast, by Technology Application Area 2019 & 2032
- Table 50: Global Smart Grid Networking Industry Revenue Million Forecast, by Country 2019 & 2032
- Table 51: Global Smart Grid Networking Industry Revenue Million Forecast, by Technology Application Area 2019 & 2032
- Table 52: Global Smart Grid Networking Industry Revenue Million Forecast, by Country 2019 & 2032
- Table 53: Global Smart Grid Networking Industry Revenue Million Forecast, by Technology Application Area 2019 & 2032
- Table 54: Global Smart Grid Networking Industry Revenue Million Forecast, by Country 2019 & 2032
- Table 55: Global Smart Grid Networking Industry Revenue Million Forecast, by Technology Application Area 2019 & 2032
- Table 56: Global Smart Grid Networking Industry Revenue Million Forecast, by Country 2019 & 2032
- Table 57: Global Smart Grid Networking Industry Revenue Million Forecast, by Technology Application Area 2019 & 2032
- Table 58: Global Smart Grid Networking Industry Revenue Million Forecast, by Country 2019 & 2032
Frequently Asked Questions
1. What is the projected Compound Annual Growth Rate (CAGR) of the Smart Grid Networking Industry?
The projected CAGR is approximately > 11.00%.
2. Which companies are prominent players in the Smart Grid Networking Industry?
Key companies in the market include Itron Inc, ABB Ltd, Hitachi Ltd, Cisco Systems Inc, Siemens AG, Schneider Electric SE, Eaton Corporation PLC, General Electric Company, Honeywell International Inc *List Not Exhaustive, Osaki Electric Co Ltd.
3. What are the main segments of the Smart Grid Networking Industry?
The market segments include Technology Application Area.
4. Can you provide details about the market size?
The market size is estimated to be USD XX Million as of 2022.
5. What are some drivers contributing to market growth?
4.; Growing Power Demand from the Commercial and Industrial Sectors.
6. What are the notable trends driving market growth?
Advanced Metering Infrastructure (AMI) to Witness Significant Growth.
7. Are there any restraints impacting market growth?
4.; Stringent Environmental and Safety Regulations.
8. Can you provide examples of recent developments in the market?
In January 2021, Schneider Electric acquired DC Systems BV, a major supplier of smart systems. This acquisition has helped Schneider Electric advance innovations in the electrical distribution and smart grid sectors.
9. What pricing options are available for accessing the report?
Pricing options include single-user, multi-user, and enterprise licenses priced at USD 4750, USD 5250, and USD 8750 respectively.
10. Is the market size provided in terms of value or volume?
The market size is provided in terms of value, measured in Million.
11. Are there any specific market keywords associated with the report?
Yes, the market keyword associated with the report is "Smart Grid Networking Industry," which aids in identifying and referencing the specific market segment covered.
12. How do I determine which pricing option suits my needs best?
The pricing options vary based on user requirements and access needs. Individual users may opt for single-user licenses, while businesses requiring broader access may choose multi-user or enterprise licenses for cost-effective access to the report.
13. Are there any additional resources or data provided in the Smart Grid Networking Industry report?
While the report offers comprehensive insights, it's advisable to review the specific contents or supplementary materials provided to ascertain if additional resources or data are available.
14. How can I stay updated on further developments or reports in the Smart Grid Networking Industry?
To stay informed about further developments, trends, and reports in the Smart Grid Networking Industry, consider subscribing to industry newsletters, following relevant companies and organizations, or regularly checking reputable industry news sources and publications.
Methodology
Step 1 - Identification of Relevant Samples Size from Population Database


Step 2 - Approaches for Defining Global Market Size (Value, Volume* & Price*)

Note*: In applicable scenarios
Step 3 - Data Sources
Primary Research
- Web Analytics
- Survey Reports
- Research Institute
- Latest Research Reports
- Opinion Leaders
Secondary Research
- Annual Reports
- White Paper
- Latest Press Release
- Industry Association
- Paid Database
- Investor Presentations

Step 4 - Data Triangulation
Involves using different sources of information in order to increase the validity of a study
These sources are likely to be stakeholders in a program - participants, other researchers, program staff, other community members, and so on.
Then we put all data in single framework & apply various statistical tools to find out the dynamic on the market.
During the analysis stage, feedback from the stakeholder groups would be compared to determine areas of agreement as well as areas of divergence


