
Key Insights
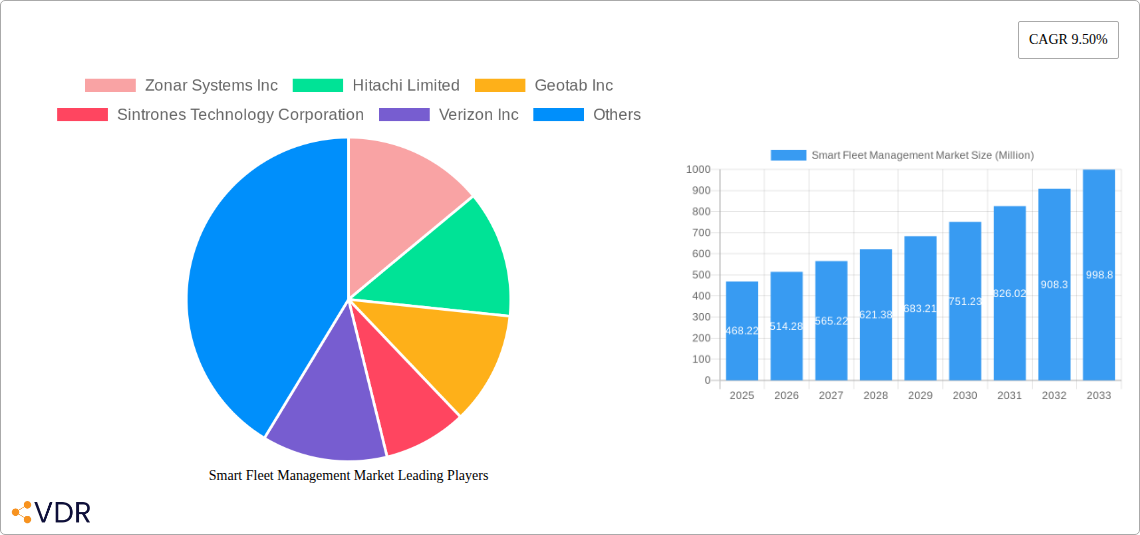
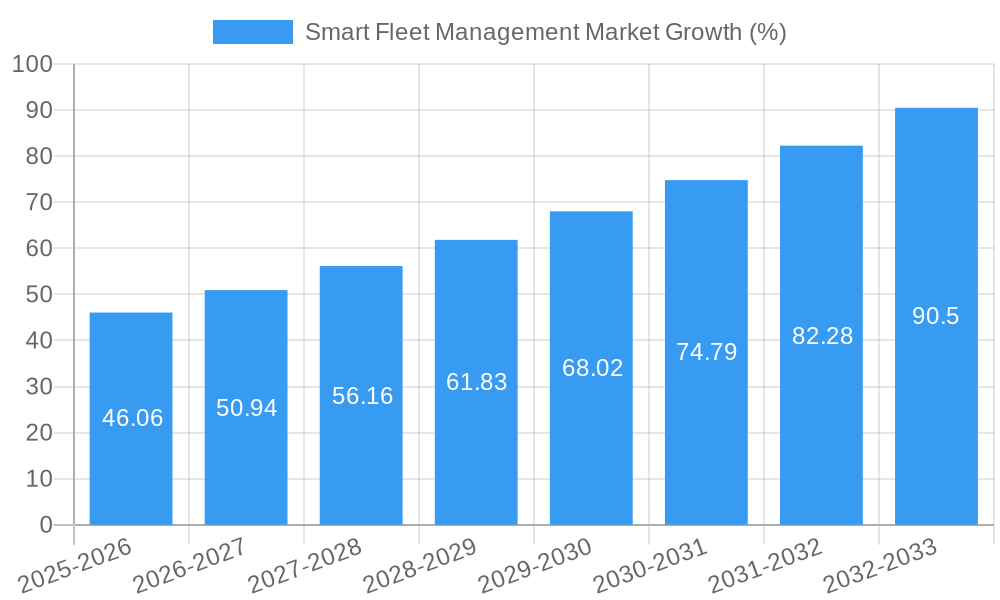
The global smart fleet management market, valued at $468.22 million in 2025, is projected to experience robust growth, driven by the increasing adoption of connected vehicles and the demand for enhanced operational efficiency across various industries. The market's Compound Annual Growth Rate (CAGR) of 9.50% from 2019 to 2033 indicates a significant expansion over the forecast period (2025-2033). Key drivers include the rising need for real-time vehicle tracking, fuel optimization, improved driver safety, and regulatory compliance. The integration of advanced technologies like telematics, IoT sensors, and AI-powered analytics is further fueling market expansion. While initial investment costs can be a restraint for some businesses, the long-term benefits in terms of reduced operational expenses, enhanced productivity, and improved risk management are increasingly outweighing this concern. The market is segmented by vehicle type (light commercial vehicles, heavy commercial vehicles, etc.), deployment mode (cloud-based, on-premise), and application (logistics, transportation, etc.) – although specific segment breakdowns are not provided here. Leading companies such as Zonar Systems Inc., Hitachi Limited, Geotab Inc., and Samsara Inc. are actively shaping the market landscape through technological innovations and strategic partnerships. This competitive environment fosters continuous improvement and further accelerates market growth.
The anticipated growth trajectory for the smart fleet management market is fueled by several converging factors. The ongoing digital transformation across industries is pushing businesses to adopt more efficient and data-driven approaches. The increasing emphasis on sustainability, coupled with the need to reduce carbon footprints, is driving demand for fuel-efficient solutions. Moreover, evolving government regulations pertaining to fleet safety and emissions are adding another layer of impetus to market growth. This market dynamic creates opportunities for innovation in areas such as predictive maintenance, advanced driver-assistance systems (ADAS), and route optimization. As the technology matures and becomes more accessible, the smart fleet management market is poised to expand into new sectors and geographical regions, furthering its significant growth potential.
Smart Fleet Management Market: A Comprehensive Report (2019-2033)
This comprehensive report provides an in-depth analysis of the Smart Fleet Management market, encompassing market dynamics, growth trends, regional dominance, product landscape, key players, and future outlook. The study period covers 2019-2033, with 2025 as the base and estimated year. This report is crucial for businesses seeking to understand and capitalize on opportunities within this rapidly evolving sector. The parent market is Transportation and Logistics, while the child market focuses specifically on fleet management solutions leveraging advanced technologies. The market size is projected to reach xx Million by 2033.
Smart Fleet Management Market Dynamics & Structure
The Smart Fleet Management market is characterized by moderate concentration, with several key players vying for market share. Technological innovation, particularly in areas like AI, IoT, and telematics, is a major growth driver. Stringent government regulations regarding fleet safety and emissions also shape market dynamics. Competitive substitutes include traditional fleet management systems lacking advanced analytics capabilities. The end-user demographic encompasses diverse industries, including transportation, logistics, construction, and public services. Mergers and acquisitions (M&A) activity is relatively high, indicating industry consolidation and strategic expansion.
- Market Concentration: Moderately concentrated, with the top 5 players holding approximately xx% market share in 2025.
- Technological Innovation: Significant advancements in AI-powered predictive maintenance, IoT-enabled real-time tracking, and advanced analytics are driving growth.
- Regulatory Framework: Increasingly stringent emission standards and safety regulations are shaping product development and adoption.
- Competitive Substitutes: Traditional fleet management solutions pose a competitive threat, though their lack of advanced analytics is a key differentiator.
- End-User Demographics: Diverse, including transportation and logistics (xx%), construction (xx%), public services (xx%), and others (xx%).
- M&A Trends: A steady rise in M&A activity, with xx deals recorded in the last five years, suggests ongoing consolidation and expansion.
Smart Fleet Management Market Growth Trends & Insights
The Smart Fleet Management market has witnessed significant growth over the historical period (2019-2024), driven by increasing adoption of connected vehicles, rising demand for enhanced fleet efficiency, and advancements in data analytics. The market size experienced a CAGR of xx% during this period and is projected to continue growing at a CAGR of xx% from 2025 to 2033, reaching a value of xx Million by 2033. This growth is fueled by the increasing adoption of cloud-based solutions, the integration of AI and machine learning, and the growing demand for real-time data and insights for better decision-making. Market penetration is currently at xx% and is expected to reach xx% by 2033. Technological disruptions, such as the introduction of 5G connectivity and autonomous vehicles, will further accelerate market growth. Consumer behavior shifts toward enhanced safety and sustainability are influencing purchasing decisions.
Dominant Regions, Countries, or Segments in Smart Fleet Management Market
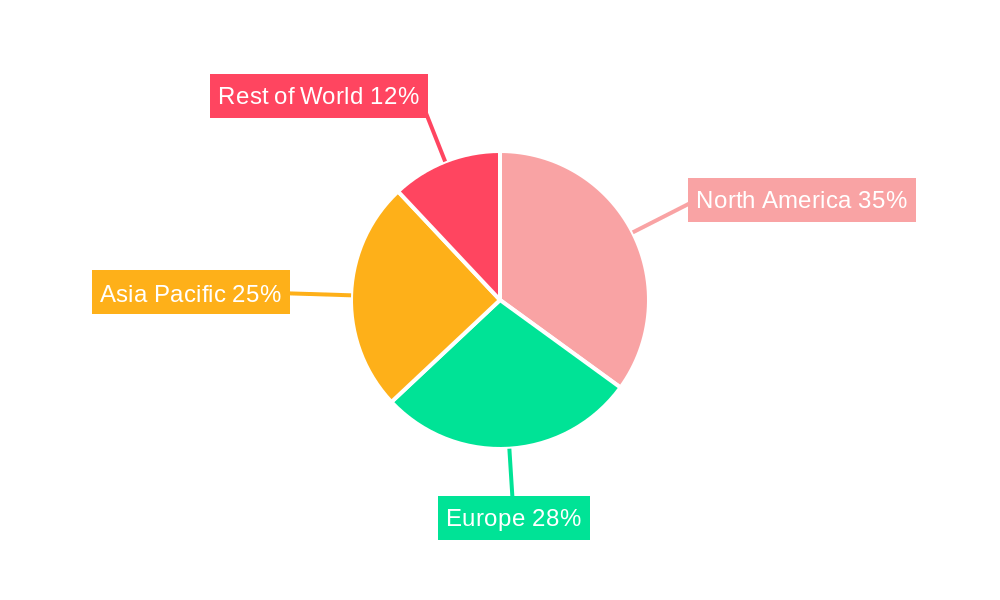
North America currently holds the dominant position in the Smart Fleet Management market, driven by early adoption of advanced technologies, well-established infrastructure, and strong regulatory support. Europe follows as a significant market, exhibiting strong growth potential due to increasing government initiatives promoting sustainable transportation. The Asia-Pacific region is emerging as a rapidly growing market, with substantial investment in infrastructure development and increasing adoption rates among businesses. Within segments, the transportation and logistics sector leads, accounting for xx% of the market share, followed by construction and public services.
- North America: Strong market leadership due to early adoption, technological advancements, and robust infrastructure.
- Europe: Significant market with substantial growth potential driven by government initiatives for sustainable transportation.
- Asia-Pacific: Rapidly expanding market with high growth potential fueled by infrastructure development and increasing adoption rates.
- Transportation & Logistics: Dominant segment with xx% market share driven by the need for enhanced efficiency and cost optimization.
Smart Fleet Management Market Product Landscape
Smart fleet management solutions are evolving rapidly, with a focus on integrating advanced technologies like AI, IoT, and telematics. These solutions offer features such as real-time vehicle tracking, predictive maintenance, driver behavior monitoring, fuel efficiency optimization, and route optimization. Unique selling propositions include enhanced safety features, reduced operational costs, and improved efficiency. Technological advancements include the integration of 5G connectivity for faster data transmission and the use of AI for predictive analytics and automated decision-making.
Key Drivers, Barriers & Challenges in Smart Fleet Management Market
Key Drivers:
- Rising demand for improved fleet efficiency and cost reduction.
- Stringent government regulations promoting safety and emissions reduction.
- Technological advancements in AI, IoT, and telematics.
- Growing adoption of cloud-based solutions.
Key Barriers & Challenges:
- High initial investment costs for implementing smart fleet management systems.
- Concerns about data security and privacy.
- Lack of skilled workforce to manage and interpret the data generated.
- Integration challenges with existing fleet management systems. The cost of integration is estimated to impact market growth by xx% in the next five years.
Emerging Opportunities in Smart Fleet Management Market
Emerging opportunities include the integration of smart fleet management systems with autonomous vehicles, the expansion into untapped markets (e.g., developing economies), and the development of specialized solutions for niche industries (e.g., last-mile delivery). The adoption of AI-powered predictive maintenance promises significant cost savings and improved efficiency. Growing consumer demand for sustainable transportation fuels opportunities for eco-friendly fleet management solutions.
Growth Accelerators in the Smart Fleet Management Market Industry
Long-term growth will be fueled by continued technological innovation, strategic partnerships between technology providers and fleet operators, and expansion into new geographic markets. Government initiatives promoting sustainable transportation and digitalization will further accelerate market growth. The development of more user-friendly and cost-effective solutions will broaden market adoption.
Key Players Shaping the Smart Fleet Management Market Market
- Zonar Systems Inc
- Hitachi Limited
- Geotab Inc
- Sintrones Technology Corporation
- Verizon Inc
- Teletrac Navman US Limited
- Inseego Corporation
- Sierra Wireless Inc
- Samsara Inc
- Continental AG
*List Not Exhaustive
Notable Milestones in Smart Fleet Management Market Sector
- June 2024: AsianBulk Logistics (ABL) implements Spinergie's smart fleet management solution to optimize global transshipment operations.
- April 2024: Seaward Services implements Spinergie's solution across its fleet of offshore service vessels engaged in US East Coast offshore wind operations.
In-Depth Smart Fleet Management Market Market Outlook
The Smart Fleet Management market presents significant future potential, driven by ongoing technological advancements, increasing demand for efficiency and sustainability, and expansion into new markets. Strategic partnerships and investments in research and development will be crucial for companies to capitalize on emerging opportunities. The market is poised for robust growth, with significant potential for innovation and expansion in the coming years.
Smart Fleet Management Market Segmentation
-
1. Transporation Mode
- 1.1. Marine
- 1.2. Rolling Stock
- 1.3. Automotive
- 1.4. Other Modes
-
2. Solution
- 2.1. Tracking and Monitoring
- 2.2. Route Optimization
- 2.3. ADAS
- 2.4. Remote Diagnostics
- 2.5. Telematics
- 2.6. Other Solutions
-
3. Hardware
- 3.1. Onboard Diagnostics (OBD)
- 3.2. Cameras
- 3.3. Sensors
- 3.4. GPS Devices
Smart Fleet Management Market Segmentation By Geography
- 1. North America
- 2. Europe
- 3. Asia
- 4. Latin America
- 5. Middle East and Africa
Smart Fleet Management Market REPORT HIGHLIGHTS
| Aspects | Details |
|---|---|
| Study Period | 2019-2033 |
| Base Year | 2024 |
| Estimated Year | 2025 |
| Forecast Period | 2025-2033 |
| Historical Period | 2019-2024 |
| Growth Rate | CAGR of 9.50% from 2019-2033 |
| Segmentation |
|
Table of Contents
- 1. Introduction
- 1.1. Research Scope
- 1.2. Market Segmentation
- 1.3. Research Methodology
- 1.4. Definitions and Assumptions
- 2. Executive Summary
- 2.1. Introduction
- 3. Market Dynamics
- 3.1. Introduction
- 3.2. Market Drivers
- 3.2.1. Telematics and IoT Integration; Regulatory Compliance and Safety Standards
- 3.3. Market Restrains
- 3.3.1. Telematics and IoT Integration; Regulatory Compliance and Safety Standards
- 3.4. Market Trends
- 3.4.1. Tracking and Monitoring is Expected to Witness a Significant Growth
- 4. Market Factor Analysis
- 4.1. Porters Five Forces
- 4.2. Supply/Value Chain
- 4.3. PESTEL analysis
- 4.4. Market Entropy
- 4.5. Patent/Trademark Analysis
- 5. Global Smart Fleet Management Market Analysis, Insights and Forecast, 2019-2031
- 5.1. Market Analysis, Insights and Forecast - by Transporation Mode
- 5.1.1. Marine
- 5.1.2. Rolling Stock
- 5.1.3. Automotive
- 5.1.4. Other Modes
- 5.2. Market Analysis, Insights and Forecast - by Solution
- 5.2.1. Tracking and Monitoring
- 5.2.2. Route Optimization
- 5.2.3. ADAS
- 5.2.4. Remote Diagnostics
- 5.2.5. Telematics
- 5.2.6. Other Solutions
- 5.3. Market Analysis, Insights and Forecast - by Hardware
- 5.3.1. Onboard Diagnostics (OBD)
- 5.3.2. Cameras
- 5.3.3. Sensors
- 5.3.4. GPS Devices
- 5.4. Market Analysis, Insights and Forecast - by Region
- 5.4.1. North America
- 5.4.2. Europe
- 5.4.3. Asia
- 5.4.4. Latin America
- 5.4.5. Middle East and Africa
- 5.1. Market Analysis, Insights and Forecast - by Transporation Mode
- 6. North America Smart Fleet Management Market Analysis, Insights and Forecast, 2019-2031
- 6.1. Market Analysis, Insights and Forecast - by Transporation Mode
- 6.1.1. Marine
- 6.1.2. Rolling Stock
- 6.1.3. Automotive
- 6.1.4. Other Modes
- 6.2. Market Analysis, Insights and Forecast - by Solution
- 6.2.1. Tracking and Monitoring
- 6.2.2. Route Optimization
- 6.2.3. ADAS
- 6.2.4. Remote Diagnostics
- 6.2.5. Telematics
- 6.2.6. Other Solutions
- 6.3. Market Analysis, Insights and Forecast - by Hardware
- 6.3.1. Onboard Diagnostics (OBD)
- 6.3.2. Cameras
- 6.3.3. Sensors
- 6.3.4. GPS Devices
- 6.1. Market Analysis, Insights and Forecast - by Transporation Mode
- 7. Europe Smart Fleet Management Market Analysis, Insights and Forecast, 2019-2031
- 7.1. Market Analysis, Insights and Forecast - by Transporation Mode
- 7.1.1. Marine
- 7.1.2. Rolling Stock
- 7.1.3. Automotive
- 7.1.4. Other Modes
- 7.2. Market Analysis, Insights and Forecast - by Solution
- 7.2.1. Tracking and Monitoring
- 7.2.2. Route Optimization
- 7.2.3. ADAS
- 7.2.4. Remote Diagnostics
- 7.2.5. Telematics
- 7.2.6. Other Solutions
- 7.3. Market Analysis, Insights and Forecast - by Hardware
- 7.3.1. Onboard Diagnostics (OBD)
- 7.3.2. Cameras
- 7.3.3. Sensors
- 7.3.4. GPS Devices
- 7.1. Market Analysis, Insights and Forecast - by Transporation Mode
- 8. Asia Smart Fleet Management Market Analysis, Insights and Forecast, 2019-2031
- 8.1. Market Analysis, Insights and Forecast - by Transporation Mode
- 8.1.1. Marine
- 8.1.2. Rolling Stock
- 8.1.3. Automotive
- 8.1.4. Other Modes
- 8.2. Market Analysis, Insights and Forecast - by Solution
- 8.2.1. Tracking and Monitoring
- 8.2.2. Route Optimization
- 8.2.3. ADAS
- 8.2.4. Remote Diagnostics
- 8.2.5. Telematics
- 8.2.6. Other Solutions
- 8.3. Market Analysis, Insights and Forecast - by Hardware
- 8.3.1. Onboard Diagnostics (OBD)
- 8.3.2. Cameras
- 8.3.3. Sensors
- 8.3.4. GPS Devices
- 8.1. Market Analysis, Insights and Forecast - by Transporation Mode
- 9. Latin America Smart Fleet Management Market Analysis, Insights and Forecast, 2019-2031
- 9.1. Market Analysis, Insights and Forecast - by Transporation Mode
- 9.1.1. Marine
- 9.1.2. Rolling Stock
- 9.1.3. Automotive
- 9.1.4. Other Modes
- 9.2. Market Analysis, Insights and Forecast - by Solution
- 9.2.1. Tracking and Monitoring
- 9.2.2. Route Optimization
- 9.2.3. ADAS
- 9.2.4. Remote Diagnostics
- 9.2.5. Telematics
- 9.2.6. Other Solutions
- 9.3. Market Analysis, Insights and Forecast - by Hardware
- 9.3.1. Onboard Diagnostics (OBD)
- 9.3.2. Cameras
- 9.3.3. Sensors
- 9.3.4. GPS Devices
- 9.1. Market Analysis, Insights and Forecast - by Transporation Mode
- 10. Middle East and Africa Smart Fleet Management Market Analysis, Insights and Forecast, 2019-2031
- 10.1. Market Analysis, Insights and Forecast - by Transporation Mode
- 10.1.1. Marine
- 10.1.2. Rolling Stock
- 10.1.3. Automotive
- 10.1.4. Other Modes
- 10.2. Market Analysis, Insights and Forecast - by Solution
- 10.2.1. Tracking and Monitoring
- 10.2.2. Route Optimization
- 10.2.3. ADAS
- 10.2.4. Remote Diagnostics
- 10.2.5. Telematics
- 10.2.6. Other Solutions
- 10.3. Market Analysis, Insights and Forecast - by Hardware
- 10.3.1. Onboard Diagnostics (OBD)
- 10.3.2. Cameras
- 10.3.3. Sensors
- 10.3.4. GPS Devices
- 10.1. Market Analysis, Insights and Forecast - by Transporation Mode
- 11. Competitive Analysis
- 11.1. Global Market Share Analysis 2024
- 11.2. Company Profiles
- 11.2.1 Zonar Systems Inc
- 11.2.1.1. Overview
- 11.2.1.2. Products
- 11.2.1.3. SWOT Analysis
- 11.2.1.4. Recent Developments
- 11.2.1.5. Financials (Based on Availability)
- 11.2.2 Hitachi Limited
- 11.2.2.1. Overview
- 11.2.2.2. Products
- 11.2.2.3. SWOT Analysis
- 11.2.2.4. Recent Developments
- 11.2.2.5. Financials (Based on Availability)
- 11.2.3 Geotab Inc
- 11.2.3.1. Overview
- 11.2.3.2. Products
- 11.2.3.3. SWOT Analysis
- 11.2.3.4. Recent Developments
- 11.2.3.5. Financials (Based on Availability)
- 11.2.4 Sintrones Technology Corporation
- 11.2.4.1. Overview
- 11.2.4.2. Products
- 11.2.4.3. SWOT Analysis
- 11.2.4.4. Recent Developments
- 11.2.4.5. Financials (Based on Availability)
- 11.2.5 Verizon Inc
- 11.2.5.1. Overview
- 11.2.5.2. Products
- 11.2.5.3. SWOT Analysis
- 11.2.5.4. Recent Developments
- 11.2.5.5. Financials (Based on Availability)
- 11.2.6 Teletrac Navman US Limited
- 11.2.6.1. Overview
- 11.2.6.2. Products
- 11.2.6.3. SWOT Analysis
- 11.2.6.4. Recent Developments
- 11.2.6.5. Financials (Based on Availability)
- 11.2.7 Inseego Corporation
- 11.2.7.1. Overview
- 11.2.7.2. Products
- 11.2.7.3. SWOT Analysis
- 11.2.7.4. Recent Developments
- 11.2.7.5. Financials (Based on Availability)
- 11.2.8 Sierra Wireless Inc
- 11.2.8.1. Overview
- 11.2.8.2. Products
- 11.2.8.3. SWOT Analysis
- 11.2.8.4. Recent Developments
- 11.2.8.5. Financials (Based on Availability)
- 11.2.9 Samsara Inc
- 11.2.9.1. Overview
- 11.2.9.2. Products
- 11.2.9.3. SWOT Analysis
- 11.2.9.4. Recent Developments
- 11.2.9.5. Financials (Based on Availability)
- 11.2.10 Continental AG*List Not Exhaustive
- 11.2.10.1. Overview
- 11.2.10.2. Products
- 11.2.10.3. SWOT Analysis
- 11.2.10.4. Recent Developments
- 11.2.10.5. Financials (Based on Availability)
- 11.2.1 Zonar Systems Inc
List of Figures
- Figure 1: Global Smart Fleet Management Market Revenue Breakdown (Million, %) by Region 2024 & 2032
- Figure 2: Global Smart Fleet Management Market Volume Breakdown (Billion, %) by Region 2024 & 2032
- Figure 3: North America Smart Fleet Management Market Revenue (Million), by Transporation Mode 2024 & 2032
- Figure 4: North America Smart Fleet Management Market Volume (Billion), by Transporation Mode 2024 & 2032
- Figure 5: North America Smart Fleet Management Market Revenue Share (%), by Transporation Mode 2024 & 2032
- Figure 6: North America Smart Fleet Management Market Volume Share (%), by Transporation Mode 2024 & 2032
- Figure 7: North America Smart Fleet Management Market Revenue (Million), by Solution 2024 & 2032
- Figure 8: North America Smart Fleet Management Market Volume (Billion), by Solution 2024 & 2032
- Figure 9: North America Smart Fleet Management Market Revenue Share (%), by Solution 2024 & 2032
- Figure 10: North America Smart Fleet Management Market Volume Share (%), by Solution 2024 & 2032
- Figure 11: North America Smart Fleet Management Market Revenue (Million), by Hardware 2024 & 2032
- Figure 12: North America Smart Fleet Management Market Volume (Billion), by Hardware 2024 & 2032
- Figure 13: North America Smart Fleet Management Market Revenue Share (%), by Hardware 2024 & 2032
- Figure 14: North America Smart Fleet Management Market Volume Share (%), by Hardware 2024 & 2032
- Figure 15: North America Smart Fleet Management Market Revenue (Million), by Country 2024 & 2032
- Figure 16: North America Smart Fleet Management Market Volume (Billion), by Country 2024 & 2032
- Figure 17: North America Smart Fleet Management Market Revenue Share (%), by Country 2024 & 2032
- Figure 18: North America Smart Fleet Management Market Volume Share (%), by Country 2024 & 2032
- Figure 19: Europe Smart Fleet Management Market Revenue (Million), by Transporation Mode 2024 & 2032
- Figure 20: Europe Smart Fleet Management Market Volume (Billion), by Transporation Mode 2024 & 2032
- Figure 21: Europe Smart Fleet Management Market Revenue Share (%), by Transporation Mode 2024 & 2032
- Figure 22: Europe Smart Fleet Management Market Volume Share (%), by Transporation Mode 2024 & 2032
- Figure 23: Europe Smart Fleet Management Market Revenue (Million), by Solution 2024 & 2032
- Figure 24: Europe Smart Fleet Management Market Volume (Billion), by Solution 2024 & 2032
- Figure 25: Europe Smart Fleet Management Market Revenue Share (%), by Solution 2024 & 2032
- Figure 26: Europe Smart Fleet Management Market Volume Share (%), by Solution 2024 & 2032
- Figure 27: Europe Smart Fleet Management Market Revenue (Million), by Hardware 2024 & 2032
- Figure 28: Europe Smart Fleet Management Market Volume (Billion), by Hardware 2024 & 2032
- Figure 29: Europe Smart Fleet Management Market Revenue Share (%), by Hardware 2024 & 2032
- Figure 30: Europe Smart Fleet Management Market Volume Share (%), by Hardware 2024 & 2032
- Figure 31: Europe Smart Fleet Management Market Revenue (Million), by Country 2024 & 2032
- Figure 32: Europe Smart Fleet Management Market Volume (Billion), by Country 2024 & 2032
- Figure 33: Europe Smart Fleet Management Market Revenue Share (%), by Country 2024 & 2032
- Figure 34: Europe Smart Fleet Management Market Volume Share (%), by Country 2024 & 2032
- Figure 35: Asia Smart Fleet Management Market Revenue (Million), by Transporation Mode 2024 & 2032
- Figure 36: Asia Smart Fleet Management Market Volume (Billion), by Transporation Mode 2024 & 2032
- Figure 37: Asia Smart Fleet Management Market Revenue Share (%), by Transporation Mode 2024 & 2032
- Figure 38: Asia Smart Fleet Management Market Volume Share (%), by Transporation Mode 2024 & 2032
- Figure 39: Asia Smart Fleet Management Market Revenue (Million), by Solution 2024 & 2032
- Figure 40: Asia Smart Fleet Management Market Volume (Billion), by Solution 2024 & 2032
- Figure 41: Asia Smart Fleet Management Market Revenue Share (%), by Solution 2024 & 2032
- Figure 42: Asia Smart Fleet Management Market Volume Share (%), by Solution 2024 & 2032
- Figure 43: Asia Smart Fleet Management Market Revenue (Million), by Hardware 2024 & 2032
- Figure 44: Asia Smart Fleet Management Market Volume (Billion), by Hardware 2024 & 2032
- Figure 45: Asia Smart Fleet Management Market Revenue Share (%), by Hardware 2024 & 2032
- Figure 46: Asia Smart Fleet Management Market Volume Share (%), by Hardware 2024 & 2032
- Figure 47: Asia Smart Fleet Management Market Revenue (Million), by Country 2024 & 2032
- Figure 48: Asia Smart Fleet Management Market Volume (Billion), by Country 2024 & 2032
- Figure 49: Asia Smart Fleet Management Market Revenue Share (%), by Country 2024 & 2032
- Figure 50: Asia Smart Fleet Management Market Volume Share (%), by Country 2024 & 2032
- Figure 51: Latin America Smart Fleet Management Market Revenue (Million), by Transporation Mode 2024 & 2032
- Figure 52: Latin America Smart Fleet Management Market Volume (Billion), by Transporation Mode 2024 & 2032
- Figure 53: Latin America Smart Fleet Management Market Revenue Share (%), by Transporation Mode 2024 & 2032
- Figure 54: Latin America Smart Fleet Management Market Volume Share (%), by Transporation Mode 2024 & 2032
- Figure 55: Latin America Smart Fleet Management Market Revenue (Million), by Solution 2024 & 2032
- Figure 56: Latin America Smart Fleet Management Market Volume (Billion), by Solution 2024 & 2032
- Figure 57: Latin America Smart Fleet Management Market Revenue Share (%), by Solution 2024 & 2032
- Figure 58: Latin America Smart Fleet Management Market Volume Share (%), by Solution 2024 & 2032
- Figure 59: Latin America Smart Fleet Management Market Revenue (Million), by Hardware 2024 & 2032
- Figure 60: Latin America Smart Fleet Management Market Volume (Billion), by Hardware 2024 & 2032
- Figure 61: Latin America Smart Fleet Management Market Revenue Share (%), by Hardware 2024 & 2032
- Figure 62: Latin America Smart Fleet Management Market Volume Share (%), by Hardware 2024 & 2032
- Figure 63: Latin America Smart Fleet Management Market Revenue (Million), by Country 2024 & 2032
- Figure 64: Latin America Smart Fleet Management Market Volume (Billion), by Country 2024 & 2032
- Figure 65: Latin America Smart Fleet Management Market Revenue Share (%), by Country 2024 & 2032
- Figure 66: Latin America Smart Fleet Management Market Volume Share (%), by Country 2024 & 2032
- Figure 67: Middle East and Africa Smart Fleet Management Market Revenue (Million), by Transporation Mode 2024 & 2032
- Figure 68: Middle East and Africa Smart Fleet Management Market Volume (Billion), by Transporation Mode 2024 & 2032
- Figure 69: Middle East and Africa Smart Fleet Management Market Revenue Share (%), by Transporation Mode 2024 & 2032
- Figure 70: Middle East and Africa Smart Fleet Management Market Volume Share (%), by Transporation Mode 2024 & 2032
- Figure 71: Middle East and Africa Smart Fleet Management Market Revenue (Million), by Solution 2024 & 2032
- Figure 72: Middle East and Africa Smart Fleet Management Market Volume (Billion), by Solution 2024 & 2032
- Figure 73: Middle East and Africa Smart Fleet Management Market Revenue Share (%), by Solution 2024 & 2032
- Figure 74: Middle East and Africa Smart Fleet Management Market Volume Share (%), by Solution 2024 & 2032
- Figure 75: Middle East and Africa Smart Fleet Management Market Revenue (Million), by Hardware 2024 & 2032
- Figure 76: Middle East and Africa Smart Fleet Management Market Volume (Billion), by Hardware 2024 & 2032
- Figure 77: Middle East and Africa Smart Fleet Management Market Revenue Share (%), by Hardware 2024 & 2032
- Figure 78: Middle East and Africa Smart Fleet Management Market Volume Share (%), by Hardware 2024 & 2032
- Figure 79: Middle East and Africa Smart Fleet Management Market Revenue (Million), by Country 2024 & 2032
- Figure 80: Middle East and Africa Smart Fleet Management Market Volume (Billion), by Country 2024 & 2032
- Figure 81: Middle East and Africa Smart Fleet Management Market Revenue Share (%), by Country 2024 & 2032
- Figure 82: Middle East and Africa Smart Fleet Management Market Volume Share (%), by Country 2024 & 2032
List of Tables
- Table 1: Global Smart Fleet Management Market Revenue Million Forecast, by Region 2019 & 2032
- Table 2: Global Smart Fleet Management Market Volume Billion Forecast, by Region 2019 & 2032
- Table 3: Global Smart Fleet Management Market Revenue Million Forecast, by Transporation Mode 2019 & 2032
- Table 4: Global Smart Fleet Management Market Volume Billion Forecast, by Transporation Mode 2019 & 2032
- Table 5: Global Smart Fleet Management Market Revenue Million Forecast, by Solution 2019 & 2032
- Table 6: Global Smart Fleet Management Market Volume Billion Forecast, by Solution 2019 & 2032
- Table 7: Global Smart Fleet Management Market Revenue Million Forecast, by Hardware 2019 & 2032
- Table 8: Global Smart Fleet Management Market Volume Billion Forecast, by Hardware 2019 & 2032
- Table 9: Global Smart Fleet Management Market Revenue Million Forecast, by Region 2019 & 2032
- Table 10: Global Smart Fleet Management Market Volume Billion Forecast, by Region 2019 & 2032
- Table 11: Global Smart Fleet Management Market Revenue Million Forecast, by Transporation Mode 2019 & 2032
- Table 12: Global Smart Fleet Management Market Volume Billion Forecast, by Transporation Mode 2019 & 2032
- Table 13: Global Smart Fleet Management Market Revenue Million Forecast, by Solution 2019 & 2032
- Table 14: Global Smart Fleet Management Market Volume Billion Forecast, by Solution 2019 & 2032
- Table 15: Global Smart Fleet Management Market Revenue Million Forecast, by Hardware 2019 & 2032
- Table 16: Global Smart Fleet Management Market Volume Billion Forecast, by Hardware 2019 & 2032
- Table 17: Global Smart Fleet Management Market Revenue Million Forecast, by Country 2019 & 2032
- Table 18: Global Smart Fleet Management Market Volume Billion Forecast, by Country 2019 & 2032
- Table 19: Global Smart Fleet Management Market Revenue Million Forecast, by Transporation Mode 2019 & 2032
- Table 20: Global Smart Fleet Management Market Volume Billion Forecast, by Transporation Mode 2019 & 2032
- Table 21: Global Smart Fleet Management Market Revenue Million Forecast, by Solution 2019 & 2032
- Table 22: Global Smart Fleet Management Market Volume Billion Forecast, by Solution 2019 & 2032
- Table 23: Global Smart Fleet Management Market Revenue Million Forecast, by Hardware 2019 & 2032
- Table 24: Global Smart Fleet Management Market Volume Billion Forecast, by Hardware 2019 & 2032
- Table 25: Global Smart Fleet Management Market Revenue Million Forecast, by Country 2019 & 2032
- Table 26: Global Smart Fleet Management Market Volume Billion Forecast, by Country 2019 & 2032
- Table 27: Global Smart Fleet Management Market Revenue Million Forecast, by Transporation Mode 2019 & 2032
- Table 28: Global Smart Fleet Management Market Volume Billion Forecast, by Transporation Mode 2019 & 2032
- Table 29: Global Smart Fleet Management Market Revenue Million Forecast, by Solution 2019 & 2032
- Table 30: Global Smart Fleet Management Market Volume Billion Forecast, by Solution 2019 & 2032
- Table 31: Global Smart Fleet Management Market Revenue Million Forecast, by Hardware 2019 & 2032
- Table 32: Global Smart Fleet Management Market Volume Billion Forecast, by Hardware 2019 & 2032
- Table 33: Global Smart Fleet Management Market Revenue Million Forecast, by Country 2019 & 2032
- Table 34: Global Smart Fleet Management Market Volume Billion Forecast, by Country 2019 & 2032
- Table 35: Global Smart Fleet Management Market Revenue Million Forecast, by Transporation Mode 2019 & 2032
- Table 36: Global Smart Fleet Management Market Volume Billion Forecast, by Transporation Mode 2019 & 2032
- Table 37: Global Smart Fleet Management Market Revenue Million Forecast, by Solution 2019 & 2032
- Table 38: Global Smart Fleet Management Market Volume Billion Forecast, by Solution 2019 & 2032
- Table 39: Global Smart Fleet Management Market Revenue Million Forecast, by Hardware 2019 & 2032
- Table 40: Global Smart Fleet Management Market Volume Billion Forecast, by Hardware 2019 & 2032
- Table 41: Global Smart Fleet Management Market Revenue Million Forecast, by Country 2019 & 2032
- Table 42: Global Smart Fleet Management Market Volume Billion Forecast, by Country 2019 & 2032
- Table 43: Global Smart Fleet Management Market Revenue Million Forecast, by Transporation Mode 2019 & 2032
- Table 44: Global Smart Fleet Management Market Volume Billion Forecast, by Transporation Mode 2019 & 2032
- Table 45: Global Smart Fleet Management Market Revenue Million Forecast, by Solution 2019 & 2032
- Table 46: Global Smart Fleet Management Market Volume Billion Forecast, by Solution 2019 & 2032
- Table 47: Global Smart Fleet Management Market Revenue Million Forecast, by Hardware 2019 & 2032
- Table 48: Global Smart Fleet Management Market Volume Billion Forecast, by Hardware 2019 & 2032
- Table 49: Global Smart Fleet Management Market Revenue Million Forecast, by Country 2019 & 2032
- Table 50: Global Smart Fleet Management Market Volume Billion Forecast, by Country 2019 & 2032
Frequently Asked Questions
1. What is the projected Compound Annual Growth Rate (CAGR) of the Smart Fleet Management Market?
The projected CAGR is approximately 9.50%.
2. Which companies are prominent players in the Smart Fleet Management Market?
Key companies in the market include Zonar Systems Inc, Hitachi Limited, Geotab Inc, Sintrones Technology Corporation, Verizon Inc, Teletrac Navman US Limited, Inseego Corporation, Sierra Wireless Inc, Samsara Inc, Continental AG*List Not Exhaustive.
3. What are the main segments of the Smart Fleet Management Market?
The market segments include Transporation Mode, Solution, Hardware.
4. Can you provide details about the market size?
The market size is estimated to be USD 468.22 Million as of 2022.
5. What are some drivers contributing to market growth?
Telematics and IoT Integration; Regulatory Compliance and Safety Standards.
6. What are the notable trends driving market growth?
Tracking and Monitoring is Expected to Witness a Significant Growth.
7. Are there any restraints impacting market growth?
Telematics and IoT Integration; Regulatory Compliance and Safety Standards.
8. Can you provide examples of recent developments in the market?
June 2024: Spinergie, a specialist in maritime data integration and analytics, revealed that AsianBulk Logistics (ABL), known for its integrated logistics services and infrastructure solutions for bulk commodities, opted for smart fleet management. This choice aims to refine ABL's global transshipment operations. The centralized digital solution promises to simplify onboard reporting for bulk cargo transfers, bolster activity tracking throughout ABL's fleet, and facilitate efficient oversight of remote offshore project zones. Through the Spinergie solution, ABL now leverages automated outgoing reports derived from digital Daily Reports (DRs) filled out by captains.April 2024: Seaward Services, a subsidiary of Hornblower Group, is implementing Spinergie Inc.'s smart fleet management solution across its fleet. This fleet includes Jones Act-compliant offshore service vessels, multipurpose service vessels (MPSVs), and crew transfer vessels (CTVs) actively engaged in offshore wind operations along the US East Coast. Spinergie's customizable smart fleet management solution consolidates various systems into a unified analytics platform, enabling shoreside operations personnel to manage the fleet remotely.
9. What pricing options are available for accessing the report?
Pricing options include single-user, multi-user, and enterprise licenses priced at USD 4750, USD 5250, and USD 8750 respectively.
10. Is the market size provided in terms of value or volume?
The market size is provided in terms of value, measured in Million and volume, measured in Billion.
11. Are there any specific market keywords associated with the report?
Yes, the market keyword associated with the report is "Smart Fleet Management Market," which aids in identifying and referencing the specific market segment covered.
12. How do I determine which pricing option suits my needs best?
The pricing options vary based on user requirements and access needs. Individual users may opt for single-user licenses, while businesses requiring broader access may choose multi-user or enterprise licenses for cost-effective access to the report.
13. Are there any additional resources or data provided in the Smart Fleet Management Market report?
While the report offers comprehensive insights, it's advisable to review the specific contents or supplementary materials provided to ascertain if additional resources or data are available.
14. How can I stay updated on further developments or reports in the Smart Fleet Management Market?
To stay informed about further developments, trends, and reports in the Smart Fleet Management Market, consider subscribing to industry newsletters, following relevant companies and organizations, or regularly checking reputable industry news sources and publications.
Methodology
Step 1 - Identification of Relevant Samples Size from Population Database


Step 2 - Approaches for Defining Global Market Size (Value, Volume* & Price*)

Note*: In applicable scenarios
Step 3 - Data Sources
Primary Research
- Web Analytics
- Survey Reports
- Research Institute
- Latest Research Reports
- Opinion Leaders
Secondary Research
- Annual Reports
- White Paper
- Latest Press Release
- Industry Association
- Paid Database
- Investor Presentations

Step 4 - Data Triangulation
Involves using different sources of information in order to increase the validity of a study
These sources are likely to be stakeholders in a program - participants, other researchers, program staff, other community members, and so on.
Then we put all data in single framework & apply various statistical tools to find out the dynamic on the market.
During the analysis stage, feedback from the stakeholder groups would be compared to determine areas of agreement as well as areas of divergence


