

Key Insights
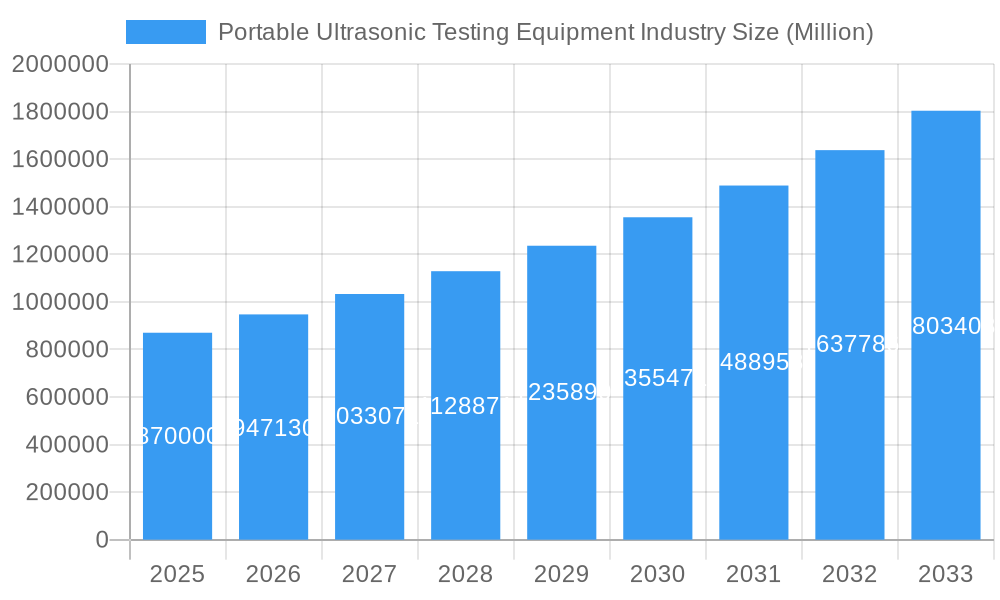
The Portable Ultrasonic Testing (UT) Equipment market is poised for significant expansion, projected to reach $0.87 Million by 2025, with a robust Compound Annual Growth Rate (CAGR) of 8.79% through 2033. This growth is fueled by an increasing emphasis on quality control and non-destructive testing (NDT) across various critical industries. The aerospace sector, with its stringent safety regulations and demand for lightweight yet durable components, represents a key application driving innovation in portable UT solutions. Similarly, the automotive industry's pursuit of lighter materials and advanced manufacturing techniques relies heavily on the precise defect detection capabilities offered by these portable devices. The energy sector, encompassing oil and gas, as well as renewable energy infrastructure, also presents substantial opportunities, as the need for regular inspections and maintenance of pipelines, turbines, and other critical assets grows. Furthermore, the construction industry's increasing adoption of advanced materials and the need for structural integrity assessments contribute to the rising demand for portable UT equipment. The market's trajectory is further supported by advancements in technology, leading to more sophisticated, user-friendly, and data-rich portable UT systems.
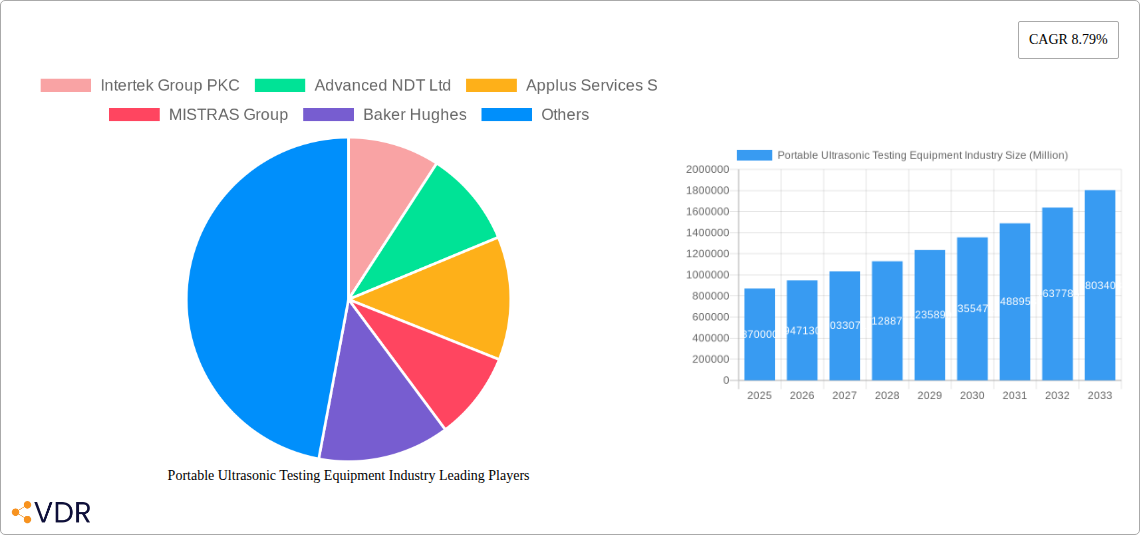
Portable Ultrasonic Testing Equipment Industry Market Size (In Billion)
The market is segmented into Manual Ultrasonic Testing Equipment, Automated Ultrasonic Testing Equipment, and Handheld Ultrasonic Testing Equipment, each catering to specific industry needs and complexities. While the market is experiencing strong growth, certain restraints, such as the high initial cost of advanced equipment and the need for skilled operators, could moderate the pace of adoption in some segments. However, the persistent demand for enhanced safety, improved product reliability, and efficient operational maintenance across major economies like North America, Europe, and the Asia Pacific is expected to outweigh these challenges. Key players like Olympus Corporation, Baker Hughes, and Intertek Group are actively investing in research and development to introduce next-generation portable UT solutions, focusing on enhanced portability, wireless connectivity, and sophisticated data analysis capabilities. The growing adoption of digital technologies and the Internet of Things (IoT) within industrial settings is also expected to integrate smart features into portable UT equipment, further bolstering market growth and application diversity.
Portable Ultrasonic Testing Equipment Industry Company Market Share
Portable Ultrasonic Testing Equipment Industry Report: Market Analysis, Trends, and Future Outlook (2019-2033)
This comprehensive report offers an in-depth analysis of the global Portable Ultrasonic Testing Equipment market, providing critical insights for industry professionals, investors, and stakeholders. Spanning from 2019 to 2033, with a base year of 2025, this study meticulously examines market dynamics, growth trends, regional dominance, product landscapes, key drivers, emerging opportunities, and the competitive environment. We delve into parent and child market segments, exploring the intricate relationships and growth trajectories that define this vital sector of the Non-Destructive Testing (NDT) industry. The report quantifies market size evolution in Million units, analyzes adoption rates, and forecasts future potential, equipping you with actionable intelligence to navigate and capitalize on market advancements.
Portable Ultrasonic Testing Equipment Industry Market Dynamics & Structure
The Portable Ultrasonic Testing Equipment market exhibits a moderately concentrated structure, with a few key players holding significant market share. Technological innovation is a primary driver, fueled by advancements in digital signal processing, miniaturization of components, and the integration of artificial intelligence for data analysis. Regulatory frameworks, particularly stringent safety and quality standards in sectors like Aerospace and Energy, mandate the use of advanced NDT solutions, including portable ultrasonic equipment. Competitive product substitutes, such as radiographic testing and eddy current testing, exist, but portable UT offers distinct advantages in terms of speed, safety, and on-site applicability. End-user demographics are increasingly sophisticated, demanding user-friendly interfaces, advanced data management, and robust performance in challenging environments. Mergers and Acquisitions (M&A) trends are evident as larger entities acquire specialized NDT firms to broaden their service offerings and technological portfolios. For instance, the MISTRAS Group has been active in strategic acquisitions to enhance its NDT capabilities.
- Market Concentration: Moderately concentrated, with key players like Olympus Corporation and Baker Hughes leading.
- Technological Innovation Drivers: Miniaturization, digital signal processing, AI integration for defect characterization.
- Regulatory Frameworks: Stringent standards in Aerospace, Energy, and Manufacturing necessitate advanced NDT.
- Competitive Product Substitutes: Radiography, eddy current, magnetic particle testing offer alternative NDT solutions.
- End-User Demographics: Demand for ease of use, data portability, and advanced reporting features.
- M&A Trends: Consolidation for expanded service portfolios and technological integration.
Portable Ultrasonic Testing Equipment Industry Growth Trends & Insights
The Portable Ultrasonic Testing Equipment market is poised for robust expansion, driven by an escalating demand for reliable and efficient Non-Destructive Testing (NDT) solutions across a multitude of industries. The market size evolution is characterized by a consistent upward trajectory, reflecting the increasing adoption of portable UT equipment for on-site inspections, maintenance, and quality control. Technological disruptions are at the forefront of this growth, with the transition from analog to digital UT systems significantly enhancing resolution, accuracy, and data acquisition capabilities. The integration of advanced features such as phased array technology, Total Focusing Method (TFM), and guided wave UT is further propelling market penetration. Consumer behavior shifts are also playing a crucial role, with a growing preference for lightweight, intuitive, and data-rich portable devices that can be easily deployed in diverse and often remote operational environments. This trend is particularly pronounced in sectors like the Energy industry, where the need for inspecting aging infrastructure and ensuring operational safety is paramount. The Manufacturing and Automotive sectors are also significant contributors, leveraging portable UT for in-line quality checks and component integrity assessments. The Aerospace industry, with its stringent safety regulations, continues to be a high-value segment, demanding the highest levels of precision and reliability from portable ultrasonic testing equipment. The compound annual growth rate (CAGR) is projected to be substantial over the forecast period, fueled by increasing investments in infrastructure development and the growing emphasis on asset integrity management worldwide. The adoption rates for these advanced portable solutions are accelerating as businesses recognize their long-term cost-saving benefits through early defect detection and the prevention of catastrophic failures. Furthermore, the increasing focus on predictive maintenance strategies across industries is creating a sustained demand for portable UT devices that can provide real-time data for condition monitoring.
Dominant Regions, Countries, or Segments in Portable Ultrasonic Testing Equipment Industry
North America currently stands as a dominant region in the Portable Ultrasonic Testing Equipment market, driven by a confluence of factors including a mature industrial base, significant investments in infrastructure, and stringent regulatory oversight in critical sectors like Energy and Aerospace. The United States, in particular, represents a substantial portion of this regional dominance, owing to its advanced manufacturing capabilities and a strong emphasis on asset integrity management. The Energy sector, encompassing oil and gas exploration, production, and power generation, is a major end-user, demanding reliable on-site inspection solutions for pipelines, storage tanks, and renewable energy infrastructure. The Manufacturing sector also contributes significantly, with the automotive industry in North America actively adopting portable UT for quality control of critical components.
From a product type perspective, Automated Ultrasonic Testing Equipment is experiencing accelerated growth, driven by the need for higher throughput and reduced human error in large-scale industrial applications. However, Handheld Ultrasonic Testing Equipment continues to hold a substantial market share due to its versatility, portability, and cost-effectiveness for a wide range of inspection tasks. The Aerospace segment, while smaller in volume, represents a high-value application, demanding the most sophisticated and accurate portable UT devices.
- Key Drivers in North America:
- Robust Energy sector demand for pipeline and infrastructure integrity.
- Advanced Manufacturing and Automotive industries requiring stringent quality control.
- Strict regulatory environments in Aerospace mandating advanced NDT.
- High disposable income for adopting cutting-edge technology.
- Significant investments in R&D and technological advancements.
The dominance is further amplified by the presence of key players like Baker Hughes and MISTRAS Group, who have a strong foothold and extensive service networks within the region. Government initiatives promoting industrial safety and modernization also contribute to sustained market growth.
Portable Ultrasonic Testing Equipment Industry Product Landscape
The Portable Ultrasonic Testing Equipment product landscape is characterized by a relentless pursuit of enhanced performance, user-friendliness, and data integration. Innovations are geared towards miniaturization, increased battery life, and intuitive touch-screen interfaces. Phased array and Total Focusing Method (TFM) capabilities are becoming standard features, offering superior defect visualization and characterization. Advanced data logging, connectivity options (Wi-Fi, Bluetooth), and integration with cloud-based reporting platforms are crucial for efficient workflow management. Unique selling propositions often lie in the equipment's ruggedness, ability to operate in extreme environmental conditions, and specialized software for specific applications like weld inspection or corrosion mapping.
Key Drivers, Barriers & Challenges in Portable Ultrasonic Testing Equipment Industry
The Portable Ultrasonic Testing Equipment market is propelled by several key drivers. Technological advancements, particularly in digital signal processing and miniaturization, enable more powerful and portable devices. The growing emphasis on safety and regulatory compliance across industries like Energy, Aerospace, and Manufacturing necessitates reliable NDT solutions. Furthermore, the increasing need for predictive maintenance and asset integrity management to reduce downtime and operational costs fuels demand.
Key challenges and restraints include the high initial cost of advanced equipment, which can be a barrier for smaller enterprises. Supply chain disruptions, particularly for specialized electronic components, can impact manufacturing and lead times. Stringent qualification and certification requirements for NDT personnel can also limit widespread adoption. Intense competition among established players and emerging manufacturers can lead to price pressures.
Emerging Opportunities in Portable Ultrasonic Testing Equipment Industry
Emerging opportunities in the Portable Ultrasonic Testing Equipment sector are abundant, driven by untapped markets and evolving technological frontiers. The expansion of renewable energy infrastructure, such as wind farms and solar installations, presents a growing demand for portable UT for inspecting turbine blades, support structures, and electrical components. The increasing adoption of Industry 4.0 principles is creating opportunities for smart, connected UT devices capable of real-time data sharing and integration with AI-powered analytics for predictive maintenance. Furthermore, the development of specialized portable UT solutions for emerging applications like composite material inspection in aerospace and lightweight automotive components offers significant growth potential. The growing focus on infrastructure inspection in developing economies also presents a substantial, yet largely untapped, market.
Growth Accelerators in the Portable Ultrasonic Testing Equipment Industry Industry
Several catalysts are accelerating the growth of the Portable Ultrasonic Testing Equipment industry. Technological breakthroughs, such as the development of highly sensitive transducers and advanced signal processing algorithms, are continuously enhancing equipment capabilities. Strategic partnerships between NDT equipment manufacturers and end-user industries are fostering innovation tailored to specific application needs. Market expansion strategies, including penetration into emerging economies and the development of cost-effective solutions for small and medium-sized enterprises, are also playing a vital role. The increasing demand for integrated NDT solutions that combine ultrasonic testing with other inspection methods further fuels market expansion.
Key Players Shaping the Portable Ultrasonic Testing Equipment Industry Market
- Intertek Group
- PKC
- Advanced NDT Ltd
- Applus Services S
- MISTRAS Group
- Baker Hughes
- Russell Fraser Sales Pty Ltd
- OkoNDT group
- ROSEN Group
- Bureau Veritas SA
- Johnson and Allen Ltd
- Olympus Corporation
Notable Milestones in Portable Ultrasonic Testing Equipment Industry Sector
- July 2022: Applus+ was awarded a major contract to execute non-destructive testing on critical maritime assets. Applus+ provides a significant range of marine Non-destructive testing services like materials, corrosion monitoring and testing, and electrical safety and functionality testing. The two-year project entails the execution of radiographic and ultrasonic testing on diverse maritime assets, including watercraft.
In-Depth Portable Ultrasonic Testing Equipment Industry Market Outlook
The future outlook for the Portable Ultrasonic Testing Equipment market is exceptionally promising, driven by sustained demand for robust inspection solutions and continuous technological advancements. Growth accelerators, including the integration of AI for advanced defect analysis and the expanding applications in renewable energy and advanced manufacturing, will continue to shape the market landscape. Strategic partnerships and market expansion into developing regions will unlock new revenue streams. The industry is well-positioned to capitalize on the global emphasis on asset integrity, safety, and operational efficiency, ensuring continued market expansion and innovation in the coming years.
Portable Ultrasonic Testing Equipment Industry Segmentation
-
1. Product Type
- 1.1. Manual Ultrasonic Testing Equipment
- 1.2. Automated Ultrasonic Testing Equipment
- 1.3. Handheld Ultrasonic Testing Equipment
-
2. Application
- 2.1. Aerospace
- 2.2. Manufacturing
- 2.3. Automotive
- 2.4. Energy
- 2.5. Construction
Portable Ultrasonic Testing Equipment Industry Segmentation By Geography
-
1. North America
- 1.1. United States
- 1.2. Canada
-
2. Europe
- 2.1. Germany
- 2.2. United Kingdom
- 2.3. France
- 2.4. Spain
- 2.5. Rest of Europe
-
3. Asia Pacific
- 3.1. China
- 3.2. Japan
- 3.3. India
- 3.4. South Korea
- 3.5. Rest of Asia Pacific
-
4. Latin America
- 4.1. Brazil
- 4.2. Argentina
- 4.3. Rest of Latin America
-
5. Middle East and Africa
- 5.1. United Arab Emirates
- 5.2. Saudi Arabia
- 5.3. Rest of Middle East and Africa
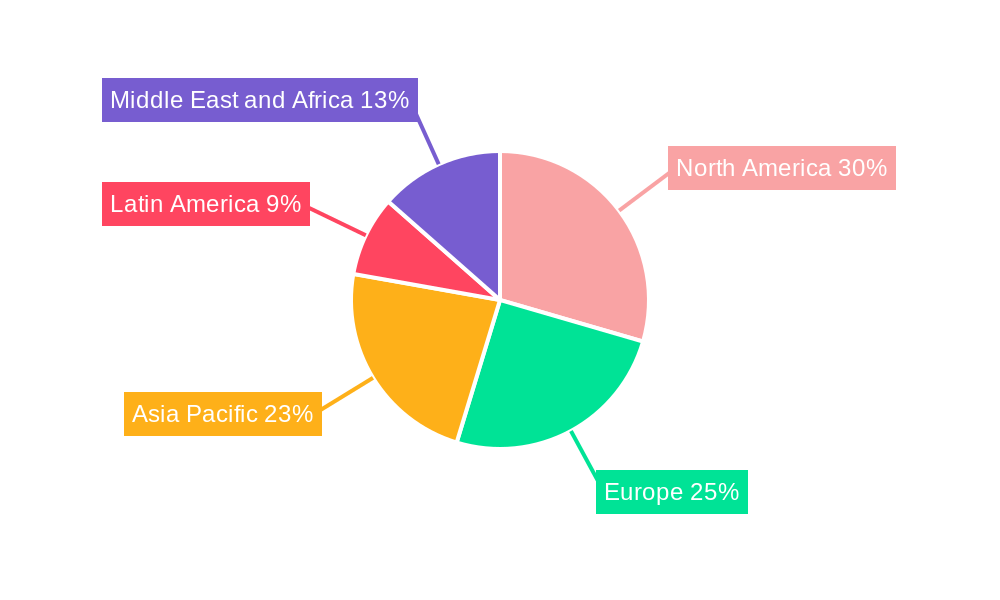
Portable Ultrasonic Testing Equipment Industry Regional Market Share
Geographic Coverage of Portable Ultrasonic Testing Equipment Industry
Portable Ultrasonic Testing Equipment Industry REPORT HIGHLIGHTS
| Aspects | Details |
|---|---|
| Study Period | 2020-2034 |
| Base Year | 2025 |
| Estimated Year | 2026 |
| Forecast Period | 2026-2034 |
| Historical Period | 2020-2025 |
| Growth Rate | CAGR of 8.79% from 2020-2034 |
| Segmentation |
|
Table of Contents
- 1. Introduction
- 1.1. Research Scope
- 1.2. Market Segmentation
- 1.3. Research Objective
- 1.4. Definitions and Assumptions
- 2. Executive Summary
- 2.1. Market Snapshot
- 3. Market Dynamics
- 3.1. Market Drivers
- 3.2. Market Restrains
- 3.3. Market Trends
- 3.4. Market Opportunities
- 4. Market Factor Analysis
- 4.1. Porters Five Forces
- 4.1.1. Bargaining Power of Suppliers
- 4.1.2. Bargaining Power of Buyers
- 4.1.3. Threat of New Entrants
- 4.1.4. Threat of Substitutes
- 4.1.5. Competitive Rivalry
- 4.2. PESTEL analysis
- 4.3. BCG Analysis
- 4.3.1. Stars (High Growth, High Market Share)
- 4.3.2. Cash Cows (Low Growth, High Market Share)
- 4.3.3. Question Mark (High Growth, Low Market Share)
- 4.3.4. Dogs (Low Growth, Low Market Share)
- 4.4. Ansoff Matrix Analysis
- 4.5. Supply Chain Analysis
- 4.6. Regulatory Landscape
- 4.7. Current Market Potential and Opportunity Assessment (TAM–SAM–SOM Framework)
- 4.8. VDR Analyst Note
- 4.1. Porters Five Forces
- 5. Market Analysis, Insights and Forecast 2021-2033
- 5.1. Market Analysis, Insights and Forecast - by Product Type
- 5.1.1. Manual Ultrasonic Testing Equipment
- 5.1.2. Automated Ultrasonic Testing Equipment
- 5.1.3. Handheld Ultrasonic Testing Equipment
- 5.2. Market Analysis, Insights and Forecast - by Application
- 5.2.1. Aerospace
- 5.2.2. Manufacturing
- 5.2.3. Automotive
- 5.2.4. Energy
- 5.2.5. Construction
- 5.3. Market Analysis, Insights and Forecast - by Region
- 5.3.1. North America
- 5.3.2. Europe
- 5.3.3. Asia Pacific
- 5.3.4. Latin America
- 5.3.5. Middle East and Africa
- 5.1. Market Analysis, Insights and Forecast - by Product Type
- 6. Global Portable Ultrasonic Testing Equipment Industry Analysis, Insights and Forecast, 2021-2033
- 6.1. Market Analysis, Insights and Forecast - by Product Type
- 6.1.1. Manual Ultrasonic Testing Equipment
- 6.1.2. Automated Ultrasonic Testing Equipment
- 6.1.3. Handheld Ultrasonic Testing Equipment
- 6.2. Market Analysis, Insights and Forecast - by Application
- 6.2.1. Aerospace
- 6.2.2. Manufacturing
- 6.2.3. Automotive
- 6.2.4. Energy
- 6.2.5. Construction
- 6.1. Market Analysis, Insights and Forecast - by Product Type
- 7. North America Portable Ultrasonic Testing Equipment Industry Analysis, Insights and Forecast, 2021-2033
- 7.1. Market Analysis, Insights and Forecast - by Product Type
- 7.1.1. Manual Ultrasonic Testing Equipment
- 7.1.2. Automated Ultrasonic Testing Equipment
- 7.1.3. Handheld Ultrasonic Testing Equipment
- 7.2. Market Analysis, Insights and Forecast - by Application
- 7.2.1. Aerospace
- 7.2.2. Manufacturing
- 7.2.3. Automotive
- 7.2.4. Energy
- 7.2.5. Construction
- 7.1. Market Analysis, Insights and Forecast - by Product Type
- 8. Europe Portable Ultrasonic Testing Equipment Industry Analysis, Insights and Forecast, 2021-2033
- 8.1. Market Analysis, Insights and Forecast - by Product Type
- 8.1.1. Manual Ultrasonic Testing Equipment
- 8.1.2. Automated Ultrasonic Testing Equipment
- 8.1.3. Handheld Ultrasonic Testing Equipment
- 8.2. Market Analysis, Insights and Forecast - by Application
- 8.2.1. Aerospace
- 8.2.2. Manufacturing
- 8.2.3. Automotive
- 8.2.4. Energy
- 8.2.5. Construction
- 8.1. Market Analysis, Insights and Forecast - by Product Type
- 9. Asia Pacific Portable Ultrasonic Testing Equipment Industry Analysis, Insights and Forecast, 2021-2033
- 9.1. Market Analysis, Insights and Forecast - by Product Type
- 9.1.1. Manual Ultrasonic Testing Equipment
- 9.1.2. Automated Ultrasonic Testing Equipment
- 9.1.3. Handheld Ultrasonic Testing Equipment
- 9.2. Market Analysis, Insights and Forecast - by Application
- 9.2.1. Aerospace
- 9.2.2. Manufacturing
- 9.2.3. Automotive
- 9.2.4. Energy
- 9.2.5. Construction
- 9.1. Market Analysis, Insights and Forecast - by Product Type
- 10. Latin America Portable Ultrasonic Testing Equipment Industry Analysis, Insights and Forecast, 2021-2033
- 10.1. Market Analysis, Insights and Forecast - by Product Type
- 10.1.1. Manual Ultrasonic Testing Equipment
- 10.1.2. Automated Ultrasonic Testing Equipment
- 10.1.3. Handheld Ultrasonic Testing Equipment
- 10.2. Market Analysis, Insights and Forecast - by Application
- 10.2.1. Aerospace
- 10.2.2. Manufacturing
- 10.2.3. Automotive
- 10.2.4. Energy
- 10.2.5. Construction
- 10.1. Market Analysis, Insights and Forecast - by Product Type
- 11. Middle East and Africa Portable Ultrasonic Testing Equipment Industry Analysis, Insights and Forecast, 2021-2033
- 11.1. Market Analysis, Insights and Forecast - by Product Type
- 11.1.1. Manual Ultrasonic Testing Equipment
- 11.1.2. Automated Ultrasonic Testing Equipment
- 11.1.3. Handheld Ultrasonic Testing Equipment
- 11.2. Market Analysis, Insights and Forecast - by Application
- 11.2.1. Aerospace
- 11.2.2. Manufacturing
- 11.2.3. Automotive
- 11.2.4. Energy
- 11.2.5. Construction
- 11.1. Market Analysis, Insights and Forecast - by Product Type
- 12. Competitive Analysis
- 12.1. Company Profiles
- 12.1.1 Intertek Group PKC
- 12.1.1.1. Company Overview
- 12.1.1.2. Products
- 12.1.1.3. Company Financials
- 12.1.1.4. SWOT Analysis
- 12.1.2 Advanced NDT Ltd
- 12.1.2.1. Company Overview
- 12.1.2.2. Products
- 12.1.2.3. Company Financials
- 12.1.2.4. SWOT Analysis
- 12.1.3 Applus Services S
- 12.1.3.1. Company Overview
- 12.1.3.2. Products
- 12.1.3.3. Company Financials
- 12.1.3.4. SWOT Analysis
- 12.1.4 MISTRAS Group
- 12.1.4.1. Company Overview
- 12.1.4.2. Products
- 12.1.4.3. Company Financials
- 12.1.4.4. SWOT Analysis
- 12.1.5 Baker Hughes
- 12.1.5.1. Company Overview
- 12.1.5.2. Products
- 12.1.5.3. Company Financials
- 12.1.5.4. SWOT Analysis
- 12.1.6 Russell Fraser Sales Pty Ltd
- 12.1.6.1. Company Overview
- 12.1.6.2. Products
- 12.1.6.3. Company Financials
- 12.1.6.4. SWOT Analysis
- 12.1.7 OkoNDT group
- 12.1.7.1. Company Overview
- 12.1.7.2. Products
- 12.1.7.3. Company Financials
- 12.1.7.4. SWOT Analysis
- 12.1.8 ROSEN Group
- 12.1.8.1. Company Overview
- 12.1.8.2. Products
- 12.1.8.3. Company Financials
- 12.1.8.4. SWOT Analysis
- 12.1.9 Bureau Veritas SA
- 12.1.9.1. Company Overview
- 12.1.9.2. Products
- 12.1.9.3. Company Financials
- 12.1.9.4. SWOT Analysis
- 12.1.10 Johnson and Allen Ltd
- 12.1.10.1. Company Overview
- 12.1.10.2. Products
- 12.1.10.3. Company Financials
- 12.1.10.4. SWOT Analysis
- 12.1.11 Olympus Corporation
- 12.1.11.1. Company Overview
- 12.1.11.2. Products
- 12.1.11.3. Company Financials
- 12.1.11.4. SWOT Analysis
- 12.1.1 Intertek Group PKC
- 12.2. Market Entropy
- 12.2.1 Company's Key Areas Served
- 12.2.2 Recent Developments
- 12.3. Company Market Share Analysis 2025
- 12.3.1 Top 5 Companies Market Share Analysis
- 12.3.2 Top 3 Companies Market Share Analysis
- 12.4. List of Potential Customers
- 13. Research Methodology
List of Figures
- Figure 1: Global Portable Ultrasonic Testing Equipment Industry Revenue Breakdown (Million, %) by Region 2025 & 2033
- Figure 2: Global Portable Ultrasonic Testing Equipment Industry Volume Breakdown (K Unit, %) by Region 2025 & 2033
- Figure 3: North America Portable Ultrasonic Testing Equipment Industry Revenue (Million), by Product Type 2025 & 2033
- Figure 4: North America Portable Ultrasonic Testing Equipment Industry Volume (K Unit), by Product Type 2025 & 2033
- Figure 5: North America Portable Ultrasonic Testing Equipment Industry Revenue Share (%), by Product Type 2025 & 2033
- Figure 6: North America Portable Ultrasonic Testing Equipment Industry Volume Share (%), by Product Type 2025 & 2033
- Figure 7: North America Portable Ultrasonic Testing Equipment Industry Revenue (Million), by Application 2025 & 2033
- Figure 8: North America Portable Ultrasonic Testing Equipment Industry Volume (K Unit), by Application 2025 & 2033
- Figure 9: North America Portable Ultrasonic Testing Equipment Industry Revenue Share (%), by Application 2025 & 2033
- Figure 10: North America Portable Ultrasonic Testing Equipment Industry Volume Share (%), by Application 2025 & 2033
- Figure 11: North America Portable Ultrasonic Testing Equipment Industry Revenue (Million), by Country 2025 & 2033
- Figure 12: North America Portable Ultrasonic Testing Equipment Industry Volume (K Unit), by Country 2025 & 2033
- Figure 13: North America Portable Ultrasonic Testing Equipment Industry Revenue Share (%), by Country 2025 & 2033
- Figure 14: North America Portable Ultrasonic Testing Equipment Industry Volume Share (%), by Country 2025 & 2033
- Figure 15: Europe Portable Ultrasonic Testing Equipment Industry Revenue (Million), by Product Type 2025 & 2033
- Figure 16: Europe Portable Ultrasonic Testing Equipment Industry Volume (K Unit), by Product Type 2025 & 2033
- Figure 17: Europe Portable Ultrasonic Testing Equipment Industry Revenue Share (%), by Product Type 2025 & 2033
- Figure 18: Europe Portable Ultrasonic Testing Equipment Industry Volume Share (%), by Product Type 2025 & 2033
- Figure 19: Europe Portable Ultrasonic Testing Equipment Industry Revenue (Million), by Application 2025 & 2033
- Figure 20: Europe Portable Ultrasonic Testing Equipment Industry Volume (K Unit), by Application 2025 & 2033
- Figure 21: Europe Portable Ultrasonic Testing Equipment Industry Revenue Share (%), by Application 2025 & 2033
- Figure 22: Europe Portable Ultrasonic Testing Equipment Industry Volume Share (%), by Application 2025 & 2033
- Figure 23: Europe Portable Ultrasonic Testing Equipment Industry Revenue (Million), by Country 2025 & 2033
- Figure 24: Europe Portable Ultrasonic Testing Equipment Industry Volume (K Unit), by Country 2025 & 2033
- Figure 25: Europe Portable Ultrasonic Testing Equipment Industry Revenue Share (%), by Country 2025 & 2033
- Figure 26: Europe Portable Ultrasonic Testing Equipment Industry Volume Share (%), by Country 2025 & 2033
- Figure 27: Asia Pacific Portable Ultrasonic Testing Equipment Industry Revenue (Million), by Product Type 2025 & 2033
- Figure 28: Asia Pacific Portable Ultrasonic Testing Equipment Industry Volume (K Unit), by Product Type 2025 & 2033
- Figure 29: Asia Pacific Portable Ultrasonic Testing Equipment Industry Revenue Share (%), by Product Type 2025 & 2033
- Figure 30: Asia Pacific Portable Ultrasonic Testing Equipment Industry Volume Share (%), by Product Type 2025 & 2033
- Figure 31: Asia Pacific Portable Ultrasonic Testing Equipment Industry Revenue (Million), by Application 2025 & 2033
- Figure 32: Asia Pacific Portable Ultrasonic Testing Equipment Industry Volume (K Unit), by Application 2025 & 2033
- Figure 33: Asia Pacific Portable Ultrasonic Testing Equipment Industry Revenue Share (%), by Application 2025 & 2033
- Figure 34: Asia Pacific Portable Ultrasonic Testing Equipment Industry Volume Share (%), by Application 2025 & 2033
- Figure 35: Asia Pacific Portable Ultrasonic Testing Equipment Industry Revenue (Million), by Country 2025 & 2033
- Figure 36: Asia Pacific Portable Ultrasonic Testing Equipment Industry Volume (K Unit), by Country 2025 & 2033
- Figure 37: Asia Pacific Portable Ultrasonic Testing Equipment Industry Revenue Share (%), by Country 2025 & 2033
- Figure 38: Asia Pacific Portable Ultrasonic Testing Equipment Industry Volume Share (%), by Country 2025 & 2033
- Figure 39: Latin America Portable Ultrasonic Testing Equipment Industry Revenue (Million), by Product Type 2025 & 2033
- Figure 40: Latin America Portable Ultrasonic Testing Equipment Industry Volume (K Unit), by Product Type 2025 & 2033
- Figure 41: Latin America Portable Ultrasonic Testing Equipment Industry Revenue Share (%), by Product Type 2025 & 2033
- Figure 42: Latin America Portable Ultrasonic Testing Equipment Industry Volume Share (%), by Product Type 2025 & 2033
- Figure 43: Latin America Portable Ultrasonic Testing Equipment Industry Revenue (Million), by Application 2025 & 2033
- Figure 44: Latin America Portable Ultrasonic Testing Equipment Industry Volume (K Unit), by Application 2025 & 2033
- Figure 45: Latin America Portable Ultrasonic Testing Equipment Industry Revenue Share (%), by Application 2025 & 2033
- Figure 46: Latin America Portable Ultrasonic Testing Equipment Industry Volume Share (%), by Application 2025 & 2033
- Figure 47: Latin America Portable Ultrasonic Testing Equipment Industry Revenue (Million), by Country 2025 & 2033
- Figure 48: Latin America Portable Ultrasonic Testing Equipment Industry Volume (K Unit), by Country 2025 & 2033
- Figure 49: Latin America Portable Ultrasonic Testing Equipment Industry Revenue Share (%), by Country 2025 & 2033
- Figure 50: Latin America Portable Ultrasonic Testing Equipment Industry Volume Share (%), by Country 2025 & 2033
- Figure 51: Middle East and Africa Portable Ultrasonic Testing Equipment Industry Revenue (Million), by Product Type 2025 & 2033
- Figure 52: Middle East and Africa Portable Ultrasonic Testing Equipment Industry Volume (K Unit), by Product Type 2025 & 2033
- Figure 53: Middle East and Africa Portable Ultrasonic Testing Equipment Industry Revenue Share (%), by Product Type 2025 & 2033
- Figure 54: Middle East and Africa Portable Ultrasonic Testing Equipment Industry Volume Share (%), by Product Type 2025 & 2033
- Figure 55: Middle East and Africa Portable Ultrasonic Testing Equipment Industry Revenue (Million), by Application 2025 & 2033
- Figure 56: Middle East and Africa Portable Ultrasonic Testing Equipment Industry Volume (K Unit), by Application 2025 & 2033
- Figure 57: Middle East and Africa Portable Ultrasonic Testing Equipment Industry Revenue Share (%), by Application 2025 & 2033
- Figure 58: Middle East and Africa Portable Ultrasonic Testing Equipment Industry Volume Share (%), by Application 2025 & 2033
- Figure 59: Middle East and Africa Portable Ultrasonic Testing Equipment Industry Revenue (Million), by Country 2025 & 2033
- Figure 60: Middle East and Africa Portable Ultrasonic Testing Equipment Industry Volume (K Unit), by Country 2025 & 2033
- Figure 61: Middle East and Africa Portable Ultrasonic Testing Equipment Industry Revenue Share (%), by Country 2025 & 2033
- Figure 62: Middle East and Africa Portable Ultrasonic Testing Equipment Industry Volume Share (%), by Country 2025 & 2033
List of Tables
- Table 1: Global Portable Ultrasonic Testing Equipment Industry Revenue Million Forecast, by Product Type 2020 & 2033
- Table 2: Global Portable Ultrasonic Testing Equipment Industry Volume K Unit Forecast, by Product Type 2020 & 2033
- Table 3: Global Portable Ultrasonic Testing Equipment Industry Revenue Million Forecast, by Application 2020 & 2033
- Table 4: Global Portable Ultrasonic Testing Equipment Industry Volume K Unit Forecast, by Application 2020 & 2033
- Table 5: Global Portable Ultrasonic Testing Equipment Industry Revenue Million Forecast, by Region 2020 & 2033
- Table 6: Global Portable Ultrasonic Testing Equipment Industry Volume K Unit Forecast, by Region 2020 & 2033
- Table 7: Global Portable Ultrasonic Testing Equipment Industry Revenue Million Forecast, by Product Type 2020 & 2033
- Table 8: Global Portable Ultrasonic Testing Equipment Industry Volume K Unit Forecast, by Product Type 2020 & 2033
- Table 9: Global Portable Ultrasonic Testing Equipment Industry Revenue Million Forecast, by Application 2020 & 2033
- Table 10: Global Portable Ultrasonic Testing Equipment Industry Volume K Unit Forecast, by Application 2020 & 2033
- Table 11: Global Portable Ultrasonic Testing Equipment Industry Revenue Million Forecast, by Country 2020 & 2033
- Table 12: Global Portable Ultrasonic Testing Equipment Industry Volume K Unit Forecast, by Country 2020 & 2033
- Table 13: United States Portable Ultrasonic Testing Equipment Industry Revenue (Million) Forecast, by Application 2020 & 2033
- Table 14: United States Portable Ultrasonic Testing Equipment Industry Volume (K Unit) Forecast, by Application 2020 & 2033
- Table 15: Canada Portable Ultrasonic Testing Equipment Industry Revenue (Million) Forecast, by Application 2020 & 2033
- Table 16: Canada Portable Ultrasonic Testing Equipment Industry Volume (K Unit) Forecast, by Application 2020 & 2033
- Table 17: Global Portable Ultrasonic Testing Equipment Industry Revenue Million Forecast, by Product Type 2020 & 2033
- Table 18: Global Portable Ultrasonic Testing Equipment Industry Volume K Unit Forecast, by Product Type 2020 & 2033
- Table 19: Global Portable Ultrasonic Testing Equipment Industry Revenue Million Forecast, by Application 2020 & 2033
- Table 20: Global Portable Ultrasonic Testing Equipment Industry Volume K Unit Forecast, by Application 2020 & 2033
- Table 21: Global Portable Ultrasonic Testing Equipment Industry Revenue Million Forecast, by Country 2020 & 2033
- Table 22: Global Portable Ultrasonic Testing Equipment Industry Volume K Unit Forecast, by Country 2020 & 2033
- Table 23: Germany Portable Ultrasonic Testing Equipment Industry Revenue (Million) Forecast, by Application 2020 & 2033
- Table 24: Germany Portable Ultrasonic Testing Equipment Industry Volume (K Unit) Forecast, by Application 2020 & 2033
- Table 25: United Kingdom Portable Ultrasonic Testing Equipment Industry Revenue (Million) Forecast, by Application 2020 & 2033
- Table 26: United Kingdom Portable Ultrasonic Testing Equipment Industry Volume (K Unit) Forecast, by Application 2020 & 2033
- Table 27: France Portable Ultrasonic Testing Equipment Industry Revenue (Million) Forecast, by Application 2020 & 2033
- Table 28: France Portable Ultrasonic Testing Equipment Industry Volume (K Unit) Forecast, by Application 2020 & 2033
- Table 29: Spain Portable Ultrasonic Testing Equipment Industry Revenue (Million) Forecast, by Application 2020 & 2033
- Table 30: Spain Portable Ultrasonic Testing Equipment Industry Volume (K Unit) Forecast, by Application 2020 & 2033
- Table 31: Rest of Europe Portable Ultrasonic Testing Equipment Industry Revenue (Million) Forecast, by Application 2020 & 2033
- Table 32: Rest of Europe Portable Ultrasonic Testing Equipment Industry Volume (K Unit) Forecast, by Application 2020 & 2033
- Table 33: Global Portable Ultrasonic Testing Equipment Industry Revenue Million Forecast, by Product Type 2020 & 2033
- Table 34: Global Portable Ultrasonic Testing Equipment Industry Volume K Unit Forecast, by Product Type 2020 & 2033
- Table 35: Global Portable Ultrasonic Testing Equipment Industry Revenue Million Forecast, by Application 2020 & 2033
- Table 36: Global Portable Ultrasonic Testing Equipment Industry Volume K Unit Forecast, by Application 2020 & 2033
- Table 37: Global Portable Ultrasonic Testing Equipment Industry Revenue Million Forecast, by Country 2020 & 2033
- Table 38: Global Portable Ultrasonic Testing Equipment Industry Volume K Unit Forecast, by Country 2020 & 2033
- Table 39: China Portable Ultrasonic Testing Equipment Industry Revenue (Million) Forecast, by Application 2020 & 2033
- Table 40: China Portable Ultrasonic Testing Equipment Industry Volume (K Unit) Forecast, by Application 2020 & 2033
- Table 41: Japan Portable Ultrasonic Testing Equipment Industry Revenue (Million) Forecast, by Application 2020 & 2033
- Table 42: Japan Portable Ultrasonic Testing Equipment Industry Volume (K Unit) Forecast, by Application 2020 & 2033
- Table 43: India Portable Ultrasonic Testing Equipment Industry Revenue (Million) Forecast, by Application 2020 & 2033
- Table 44: India Portable Ultrasonic Testing Equipment Industry Volume (K Unit) Forecast, by Application 2020 & 2033
- Table 45: South Korea Portable Ultrasonic Testing Equipment Industry Revenue (Million) Forecast, by Application 2020 & 2033
- Table 46: South Korea Portable Ultrasonic Testing Equipment Industry Volume (K Unit) Forecast, by Application 2020 & 2033
- Table 47: Rest of Asia Pacific Portable Ultrasonic Testing Equipment Industry Revenue (Million) Forecast, by Application 2020 & 2033
- Table 48: Rest of Asia Pacific Portable Ultrasonic Testing Equipment Industry Volume (K Unit) Forecast, by Application 2020 & 2033
- Table 49: Global Portable Ultrasonic Testing Equipment Industry Revenue Million Forecast, by Product Type 2020 & 2033
- Table 50: Global Portable Ultrasonic Testing Equipment Industry Volume K Unit Forecast, by Product Type 2020 & 2033
- Table 51: Global Portable Ultrasonic Testing Equipment Industry Revenue Million Forecast, by Application 2020 & 2033
- Table 52: Global Portable Ultrasonic Testing Equipment Industry Volume K Unit Forecast, by Application 2020 & 2033
- Table 53: Global Portable Ultrasonic Testing Equipment Industry Revenue Million Forecast, by Country 2020 & 2033
- Table 54: Global Portable Ultrasonic Testing Equipment Industry Volume K Unit Forecast, by Country 2020 & 2033
- Table 55: Brazil Portable Ultrasonic Testing Equipment Industry Revenue (Million) Forecast, by Application 2020 & 2033
- Table 56: Brazil Portable Ultrasonic Testing Equipment Industry Volume (K Unit) Forecast, by Application 2020 & 2033
- Table 57: Argentina Portable Ultrasonic Testing Equipment Industry Revenue (Million) Forecast, by Application 2020 & 2033
- Table 58: Argentina Portable Ultrasonic Testing Equipment Industry Volume (K Unit) Forecast, by Application 2020 & 2033
- Table 59: Rest of Latin America Portable Ultrasonic Testing Equipment Industry Revenue (Million) Forecast, by Application 2020 & 2033
- Table 60: Rest of Latin America Portable Ultrasonic Testing Equipment Industry Volume (K Unit) Forecast, by Application 2020 & 2033
- Table 61: Global Portable Ultrasonic Testing Equipment Industry Revenue Million Forecast, by Product Type 2020 & 2033
- Table 62: Global Portable Ultrasonic Testing Equipment Industry Volume K Unit Forecast, by Product Type 2020 & 2033
- Table 63: Global Portable Ultrasonic Testing Equipment Industry Revenue Million Forecast, by Application 2020 & 2033
- Table 64: Global Portable Ultrasonic Testing Equipment Industry Volume K Unit Forecast, by Application 2020 & 2033
- Table 65: Global Portable Ultrasonic Testing Equipment Industry Revenue Million Forecast, by Country 2020 & 2033
- Table 66: Global Portable Ultrasonic Testing Equipment Industry Volume K Unit Forecast, by Country 2020 & 2033
- Table 67: United Arab Emirates Portable Ultrasonic Testing Equipment Industry Revenue (Million) Forecast, by Application 2020 & 2033
- Table 68: United Arab Emirates Portable Ultrasonic Testing Equipment Industry Volume (K Unit) Forecast, by Application 2020 & 2033
- Table 69: Saudi Arabia Portable Ultrasonic Testing Equipment Industry Revenue (Million) Forecast, by Application 2020 & 2033
- Table 70: Saudi Arabia Portable Ultrasonic Testing Equipment Industry Volume (K Unit) Forecast, by Application 2020 & 2033
- Table 71: Rest of Middle East and Africa Portable Ultrasonic Testing Equipment Industry Revenue (Million) Forecast, by Application 2020 & 2033
- Table 72: Rest of Middle East and Africa Portable Ultrasonic Testing Equipment Industry Volume (K Unit) Forecast, by Application 2020 & 2033
Frequently Asked Questions
1. What is the projected Compound Annual Growth Rate (CAGR) of the Portable Ultrasonic Testing Equipment Industry?
The projected CAGR is approximately 8.79%.
2. Which companies are prominent players in the Portable Ultrasonic Testing Equipment Industry?
Key companies in the market include Intertek Group PKC, Advanced NDT Ltd, Applus Services S, MISTRAS Group, Baker Hughes, Russell Fraser Sales Pty Ltd, OkoNDT group, ROSEN Group, Bureau Veritas SA, Johnson and Allen Ltd, Olympus Corporation.
3. What are the main segments of the Portable Ultrasonic Testing Equipment Industry?
The market segments include Product Type , Application .
4. Can you provide details about the market size?
The market size is estimated to be USD 0.87 Million as of 2022.
5. What are some drivers contributing to market growth?
Increased Safety Regulation; More Emphasis Toward Continuous Monitoring to Prevent Sudden Failure; Availability of Portable and Connected Devices for Real-time Data.
6. What are the notable trends driving market growth?
Availability of Portable and Connected Devices for Real-time Data is Expected to Drive the Market's Growth.
7. Are there any restraints impacting market growth?
Lack of Skilled Labor Required to Implement and Carry Out Inspection Service.
8. Can you provide examples of recent developments in the market?
July 2022 - Applus+ was awarded a major contract to execute non-destructive testing on critical maritime assets. Applus+ provides a significant range of marine Non-destructive testing services like materials, corrosion monitoring and testing, and electrical safety and functionality testing. The two-year project entails the execution of radiographic and ultrasonic testing on diverse maritime assets, including watercraft.
9. What pricing options are available for accessing the report?
Pricing options include single-user, multi-user, and enterprise licenses priced at USD 4750, USD 5250, and USD 8750 respectively.
10. Is the market size provided in terms of value or volume?
The market size is provided in terms of value, measured in Million and volume, measured in K Unit.
11. Are there any specific market keywords associated with the report?
Yes, the market keyword associated with the report is "Portable Ultrasonic Testing Equipment Industry," which aids in identifying and referencing the specific market segment covered.
12. How do I determine which pricing option suits my needs best?
The pricing options vary based on user requirements and access needs. Individual users may opt for single-user licenses, while businesses requiring broader access may choose multi-user or enterprise licenses for cost-effective access to the report.
13. Are there any additional resources or data provided in the Portable Ultrasonic Testing Equipment Industry report?
While the report offers comprehensive insights, it's advisable to review the specific contents or supplementary materials provided to ascertain if additional resources or data are available.
14. How can I stay updated on further developments or reports in the Portable Ultrasonic Testing Equipment Industry?
To stay informed about further developments, trends, and reports in the Portable Ultrasonic Testing Equipment Industry, consider subscribing to industry newsletters, following relevant companies and organizations, or regularly checking reputable industry news sources and publications.
Methodology
Step 1 - Identification of Relevant Samples Size from Population Database


Step 2 - Approaches for Defining Global Market Size (Value, Volume* & Price*)

Note*: In applicable scenarios
Step 3 - Data Sources
Primary Research
- Web Analytics
- Survey Reports
- Research Institute
- Latest Research Reports
- Opinion Leaders
Secondary Research
- Annual Reports
- White Paper
- Latest Press Release
- Industry Association
- Paid Database
- Investor Presentations

Step 4 - Data Triangulation
Involves using different sources of information in order to increase the validity of a study
These sources are likely to be stakeholders in a program - participants, other researchers, program staff, other community members, and so on.
Then we put all data in single framework & apply various statistical tools to find out the dynamic on the market.
During the analysis stage, feedback from the stakeholder groups would be compared to determine areas of agreement as well as areas of divergence