
Key Insights
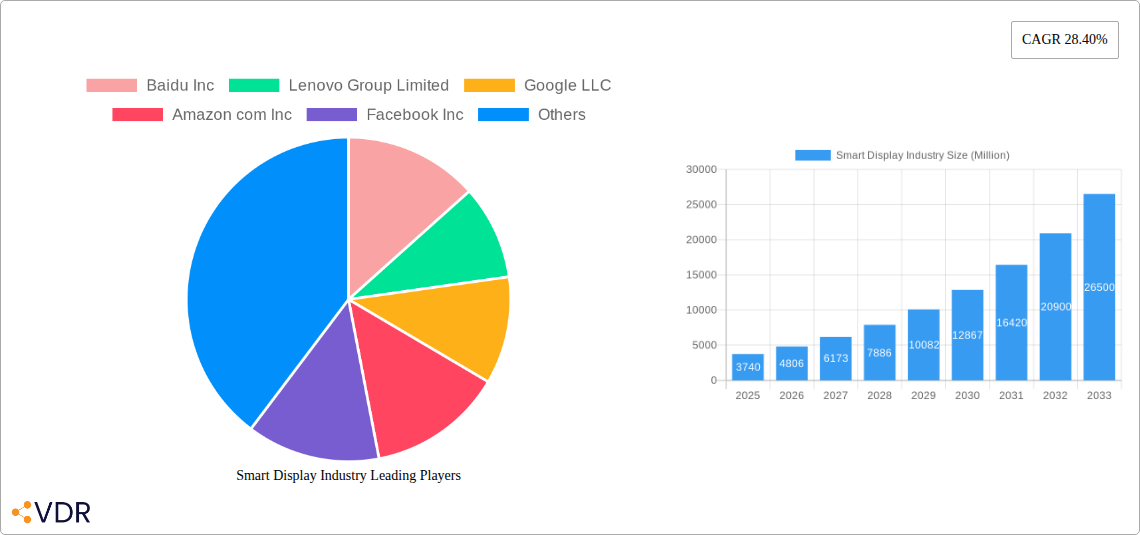
The smart display market, encompassing smart home displays, smart speakers, smart clocks, and smart glasses, is experiencing robust growth, projected to reach a market size of $3.74 billion in 2025 and expanding at a compound annual growth rate (CAGR) of 28.40%. This surge is driven by several key factors. Firstly, increasing consumer adoption of smart home technology and the integration of voice assistants like Alexa and Google Assistant are fueling demand for convenient and hands-free control of smart devices. Secondly, the continuous innovation in display technology, leading to improved screen quality, enhanced features, and more compact designs, is boosting the appeal of these devices across various applications. Thirdly, the growing popularity of smart home automation systems, where smart displays serve as central hubs, creates a synergistic effect, driving further market penetration. Finally, the expansion of high-speed internet accessibility across the globe plays a vital role in enabling seamless connectivity and functionality of these smart devices.
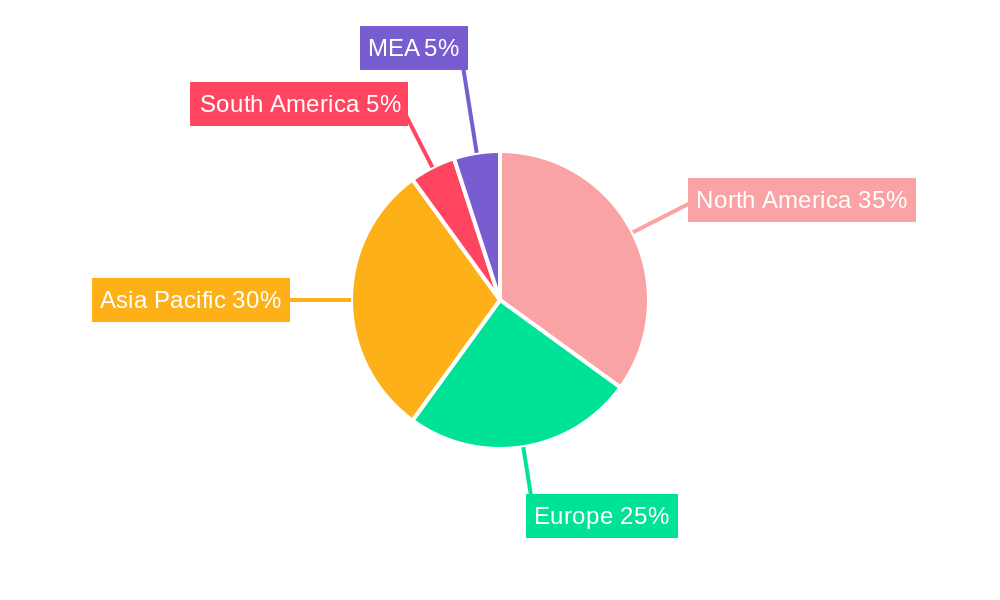
The market segmentation reveals a diverse landscape. The smart speaker segment currently holds the largest market share, primarily due to its affordability and widespread availability. However, smart home displays are witnessing rapid growth, driven by their versatile functionalities including video conferencing, entertainment streaming, and home automation control. Regionally, North America and Asia-Pacific are the key markets, with the United States and China leading the charge. However, significant growth potential exists in emerging economies of Asia-Pacific and South America, spurred by increasing disposable incomes and rising smartphone penetration. Competitive forces are intense, with major players like Amazon, Google, Baidu, and Lenovo vying for market dominance through strategic partnerships, product innovation, and aggressive marketing campaigns. The future growth trajectory hinges on further technological advancements, affordability, and the successful integration of smart displays within broader smart home ecosystems.
Smart Display Industry Market Report: 2019-2033
This comprehensive report provides an in-depth analysis of the smart display market, encompassing smart home displays, smart speakers, smart clocks, and smart glasses across home, business, and industry applications. With a study period spanning 2019-2033, a base year of 2025, and a forecast period of 2025-2033, this report is an invaluable resource for industry professionals, investors, and strategic decision-makers. The report analyzes key players like Baidu Inc, Lenovo Group Limited, Google LLC, Amazon.com Inc, Facebook Inc, JBL (Harman International), and LG Electronics Inc, providing crucial insights for navigating this rapidly evolving market. The projected market size (in Million units) will be revealed within the full report.
Smart Display Industry Market Dynamics & Structure
The smart display market is characterized by increasing market concentration among key players, driven by technological innovation and aggressive M&A activity. Regulatory frameworks, varying across different regions, significantly impact market entry and growth. The presence of substitute products, such as traditional displays and audio devices, presents ongoing competitive pressure. End-user demographics, particularly the adoption rate among younger generations, are crucial to market expansion.
- Market Concentration: xx% market share held by top 5 players in 2024 (xx Million units). Expected to increase to xx% by 2033.
- Technological Innovation: Continuous development in areas such as display technology (OLED, MicroLED), voice recognition, and AI integration are major drivers. However, innovation barriers, such as high R&D costs and complex supply chains, exist.
- Regulatory Landscape: Differing data privacy regulations and safety standards across countries create challenges for global market expansion. xx number of significant regulatory changes impacted the market between 2019 and 2024.
- Competitive Substitutes: Traditional displays and audio devices pose a competitive threat, particularly in price-sensitive segments. The report quantifies the market share of substitute products.
- M&A Activity: An estimated xx M&A deals occurred in the smart display sector between 2019 and 2024, primarily focused on technology acquisition and market expansion. Future M&A activity is projected to remain strong.
- End-User Demographics: Growing adoption among younger demographics (18-35) and increasing disposable income in emerging markets are driving growth. The report provides detailed demographic segmentation.
Smart Display Industry Growth Trends & Insights
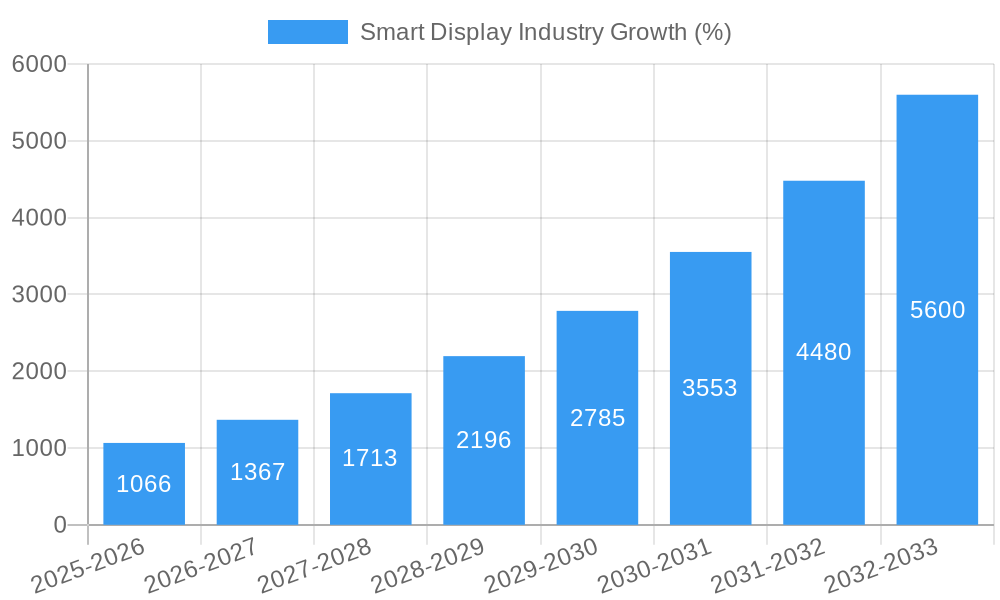
The smart display market experienced significant growth between 2019 and 2024, driven by factors such as increasing affordability, improved functionality, and broader application across various sectors. This trend is projected to continue throughout the forecast period, with a projected CAGR of xx% from 2025 to 2033. Market penetration in key regions like North America and Asia-Pacific is expected to significantly increase. Technological disruptions, such as the introduction of advanced display technologies and AI-powered features, are further fueling market growth. Changing consumer preferences, particularly a demand for seamless integration with smart homes and enhanced user experience, are key drivers. Detailed analysis of CAGR, market penetration rates, and adoption patterns across various segments will be provided.
Dominant Regions, Countries, or Segments in Smart Display Industry
North America and Asia-Pacific are the leading regions in the smart display market, exhibiting high adoption rates and strong growth potential. Within these regions, specific countries like the United States, China, and India are driving market expansion. The smart home display segment currently holds the largest market share (xx Million units in 2024), followed by smart speakers and smart glasses.
- Key Drivers in North America: High disposable income, advanced technological infrastructure, and early adoption of smart home technologies.
- Key Drivers in Asia-Pacific: Rapid urbanization, growing middle class, and government initiatives promoting technological advancement.
- Smart Home Displays: Dominance driven by increasing demand for smart home automation and entertainment. Projected growth driven by integration with IoT devices.
- Smart Speakers: High adoption fueled by voice-activated functionalities, convenience, and affordable pricing.
- Smart Glasses: Emerging segment with significant growth potential driven by advancements in display technology and potential applications in various sectors.
Smart Display Industry Product Landscape
The smart display market offers a wide range of products, each with unique selling propositions (USPs). Innovations focus on enhancing display quality (higher resolution, improved color accuracy), integrating advanced features (AI assistants, gesture control), and improving overall user experience. Technological advancements include the incorporation of MicroLED and OLED displays, advanced voice recognition, and enhanced connectivity options. The report will detail specific product features and compare the performance metrics of various devices.
Key Drivers, Barriers & Challenges in Smart Display Industry
Key Drivers:
- Increasing demand for smart home automation.
- Technological advancements in display technology and AI.
- Growing consumer preference for convenience and seamless integration.
- Government initiatives promoting the adoption of smart technologies.
Challenges & Restraints:
- High initial costs of smart display devices.
- Concerns about data privacy and security.
- Dependence on robust internet connectivity.
- Intense competition among various players in the market.
- xx% of consumers cite concerns about data security as a barrier to adoption (2024 data).
Emerging Opportunities in Smart Display Industry
- Expansion into untapped markets in developing economies.
- Development of specialized smart displays for niche applications (e.g., healthcare, education).
- Integration of augmented reality (AR) and virtual reality (VR) functionalities in smart glasses.
- Growing demand for personalized smart display experiences.
Growth Accelerators in the Smart Display Industry
The smart display market's long-term growth will be propelled by technological breakthroughs in display technology, particularly mini-LED and MicroLED advancements. Strategic partnerships between technology companies and hardware manufacturers will play a vital role in expanding market reach and driving innovation. Aggressive marketing and expansion into new geographic markets will further accelerate growth.
Key Players Shaping the Smart Display Industry Market
- Baidu Inc
- Lenovo Group Limited
- Google LLC
- Amazon.com Inc
- Facebook Inc
- JBL (Harman International)
- LG Electronics Inc
Notable Milestones in Smart Display Industry Sector
- September 2022: Lenovo launched Lenovo Glasses T1, featuring two micro OLED displays, a USB-C port, and built-in speakers. This launch signifies an expansion into the smart glasses market.
- January 2022: Google launched its second-generation Nest Hub in India, featuring a floating glass display and Nest Audio technology. This expansion into new markets underscores the growing global demand for smart displays.
In-Depth Smart Display Industry Market Outlook
The future of the smart display market is promising, with continued growth driven by technological advancements, strategic partnerships, and expanding applications across various sectors. Strategic opportunities lie in developing innovative products tailored to specific consumer needs and expanding into untapped markets. The market is poised for significant expansion, driven by the convergence of AI, IoT, and advanced display technologies.
Smart Display Industry Segmentation
-
1. Product Type
- 1.1. Smart home displays
- 1.2. Smart speakers
- 1.3. Smart clocks
- 1.4. Smart glasses
-
2. Application
- 2.1. Home
- 2.2. Business
- 2.3. Industry
Smart Display Industry Segmentation By Geography
- 1. North America
- 2. Europe
- 3. Asia Pacific
- 4. Rest of the World
Smart Display Industry REPORT HIGHLIGHTS
| Aspects | Details |
|---|---|
| Study Period | 2019-2033 |
| Base Year | 2024 |
| Estimated Year | 2025 |
| Forecast Period | 2025-2033 |
| Historical Period | 2019-2024 |
| Growth Rate | CAGR of 28.40% from 2019-2033 |
| Segmentation |
|
Table of Contents
- 1. Introduction
- 1.1. Research Scope
- 1.2. Market Segmentation
- 1.3. Research Methodology
- 1.4. Definitions and Assumptions
- 2. Executive Summary
- 2.1. Introduction
- 3. Market Dynamics
- 3.1. Introduction
- 3.2. Market Drivers
- 3.2.1. Increasing Demand of Smart Home Devices
- 3.3. Market Restrains
- 3.3.1. High Cost and Limited Set of Vocabulary
- 3.4. Market Trends
- 3.4.1. Connected Device to Drive the Market Growth
- 4. Market Factor Analysis
- 4.1. Porters Five Forces
- 4.2. Supply/Value Chain
- 4.3. PESTEL analysis
- 4.4. Market Entropy
- 4.5. Patent/Trademark Analysis
- 5. Global Smart Display Industry Analysis, Insights and Forecast, 2019-2031
- 5.1. Market Analysis, Insights and Forecast - by Product Type
- 5.1.1. Smart home displays
- 5.1.2. Smart speakers
- 5.1.3. Smart clocks
- 5.1.4. Smart glasses
- 5.2. Market Analysis, Insights and Forecast - by Application
- 5.2.1. Home
- 5.2.2. Business
- 5.2.3. Industry
- 5.3. Market Analysis, Insights and Forecast - by Region
- 5.3.1. North America
- 5.3.2. Europe
- 5.3.3. Asia Pacific
- 5.3.4. Rest of the World
- 5.1. Market Analysis, Insights and Forecast - by Product Type
- 6. North America Smart Display Industry Analysis, Insights and Forecast, 2019-2031
- 6.1. Market Analysis, Insights and Forecast - by Product Type
- 6.1.1. Smart home displays
- 6.1.2. Smart speakers
- 6.1.3. Smart clocks
- 6.1.4. Smart glasses
- 6.2. Market Analysis, Insights and Forecast - by Application
- 6.2.1. Home
- 6.2.2. Business
- 6.2.3. Industry
- 6.1. Market Analysis, Insights and Forecast - by Product Type
- 7. Europe Smart Display Industry Analysis, Insights and Forecast, 2019-2031
- 7.1. Market Analysis, Insights and Forecast - by Product Type
- 7.1.1. Smart home displays
- 7.1.2. Smart speakers
- 7.1.3. Smart clocks
- 7.1.4. Smart glasses
- 7.2. Market Analysis, Insights and Forecast - by Application
- 7.2.1. Home
- 7.2.2. Business
- 7.2.3. Industry
- 7.1. Market Analysis, Insights and Forecast - by Product Type
- 8. Asia Pacific Smart Display Industry Analysis, Insights and Forecast, 2019-2031
- 8.1. Market Analysis, Insights and Forecast - by Product Type
- 8.1.1. Smart home displays
- 8.1.2. Smart speakers
- 8.1.3. Smart clocks
- 8.1.4. Smart glasses
- 8.2. Market Analysis, Insights and Forecast - by Application
- 8.2.1. Home
- 8.2.2. Business
- 8.2.3. Industry
- 8.1. Market Analysis, Insights and Forecast - by Product Type
- 9. Rest of the World Smart Display Industry Analysis, Insights and Forecast, 2019-2031
- 9.1. Market Analysis, Insights and Forecast - by Product Type
- 9.1.1. Smart home displays
- 9.1.2. Smart speakers
- 9.1.3. Smart clocks
- 9.1.4. Smart glasses
- 9.2. Market Analysis, Insights and Forecast - by Application
- 9.2.1. Home
- 9.2.2. Business
- 9.2.3. Industry
- 9.1. Market Analysis, Insights and Forecast - by Product Type
- 10. North America Smart Display Industry Analysis, Insights and Forecast, 2019-2031
- 10.1. Market Analysis, Insights and Forecast - By Country/Sub-region
- 10.1.1 United States
- 10.1.2 Canada
- 10.1.3 Mexico
- 11. Europe Smart Display Industry Analysis, Insights and Forecast, 2019-2031
- 11.1. Market Analysis, Insights and Forecast - By Country/Sub-region
- 11.1.1 Germany
- 11.1.2 United Kingdom
- 11.1.3 France
- 11.1.4 Spain
- 11.1.5 Italy
- 11.1.6 Spain
- 11.1.7 Belgium
- 11.1.8 Netherland
- 11.1.9 Nordics
- 11.1.10 Rest of Europe
- 12. Asia Pacific Smart Display Industry Analysis, Insights and Forecast, 2019-2031
- 12.1. Market Analysis, Insights and Forecast - By Country/Sub-region
- 12.1.1 China
- 12.1.2 Japan
- 12.1.3 India
- 12.1.4 South Korea
- 12.1.5 Southeast Asia
- 12.1.6 Australia
- 12.1.7 Indonesia
- 12.1.8 Phillipes
- 12.1.9 Singapore
- 12.1.10 Thailandc
- 12.1.11 Rest of Asia Pacific
- 13. South America Smart Display Industry Analysis, Insights and Forecast, 2019-2031
- 13.1. Market Analysis, Insights and Forecast - By Country/Sub-region
- 13.1.1 Brazil
- 13.1.2 Argentina
- 13.1.3 Peru
- 13.1.4 Chile
- 13.1.5 Colombia
- 13.1.6 Ecuador
- 13.1.7 Venezuela
- 13.1.8 Rest of South America
- 14. MEA Smart Display Industry Analysis, Insights and Forecast, 2019-2031
- 14.1. Market Analysis, Insights and Forecast - By Country/Sub-region
- 14.1.1 United Arab Emirates
- 14.1.2 Saudi Arabia
- 14.1.3 South Africa
- 14.1.4 Rest of Middle East and Africa
- 15. Competitive Analysis
- 15.1. Global Market Share Analysis 2024
- 15.2. Company Profiles
- 15.2.1 Baidu Inc
- 15.2.1.1. Overview
- 15.2.1.2. Products
- 15.2.1.3. SWOT Analysis
- 15.2.1.4. Recent Developments
- 15.2.1.5. Financials (Based on Availability)
- 15.2.2 Lenovo Group Limited
- 15.2.2.1. Overview
- 15.2.2.2. Products
- 15.2.2.3. SWOT Analysis
- 15.2.2.4. Recent Developments
- 15.2.2.5. Financials (Based on Availability)
- 15.2.3 Google LLC
- 15.2.3.1. Overview
- 15.2.3.2. Products
- 15.2.3.3. SWOT Analysis
- 15.2.3.4. Recent Developments
- 15.2.3.5. Financials (Based on Availability)
- 15.2.4 Amazon com Inc
- 15.2.4.1. Overview
- 15.2.4.2. Products
- 15.2.4.3. SWOT Analysis
- 15.2.4.4. Recent Developments
- 15.2.4.5. Financials (Based on Availability)
- 15.2.5 Facebook Inc
- 15.2.5.1. Overview
- 15.2.5.2. Products
- 15.2.5.3. SWOT Analysis
- 15.2.5.4. Recent Developments
- 15.2.5.5. Financials (Based on Availability)
- 15.2.6 JBL ( Harman International)
- 15.2.6.1. Overview
- 15.2.6.2. Products
- 15.2.6.3. SWOT Analysis
- 15.2.6.4. Recent Developments
- 15.2.6.5. Financials (Based on Availability)
- 15.2.7 LG Electronics Inc
- 15.2.7.1. Overview
- 15.2.7.2. Products
- 15.2.7.3. SWOT Analysis
- 15.2.7.4. Recent Developments
- 15.2.7.5. Financials (Based on Availability)
- 15.2.1 Baidu Inc
List of Figures
- Figure 1: Global Smart Display Industry Revenue Breakdown (Million, %) by Region 2024 & 2032
- Figure 2: Global Smart Display Industry Volume Breakdown (K Unit, %) by Region 2024 & 2032
- Figure 3: North America Smart Display Industry Revenue (Million), by Country 2024 & 2032
- Figure 4: North America Smart Display Industry Volume (K Unit), by Country 2024 & 2032
- Figure 5: North America Smart Display Industry Revenue Share (%), by Country 2024 & 2032
- Figure 6: North America Smart Display Industry Volume Share (%), by Country 2024 & 2032
- Figure 7: Europe Smart Display Industry Revenue (Million), by Country 2024 & 2032
- Figure 8: Europe Smart Display Industry Volume (K Unit), by Country 2024 & 2032
- Figure 9: Europe Smart Display Industry Revenue Share (%), by Country 2024 & 2032
- Figure 10: Europe Smart Display Industry Volume Share (%), by Country 2024 & 2032
- Figure 11: Asia Pacific Smart Display Industry Revenue (Million), by Country 2024 & 2032
- Figure 12: Asia Pacific Smart Display Industry Volume (K Unit), by Country 2024 & 2032
- Figure 13: Asia Pacific Smart Display Industry Revenue Share (%), by Country 2024 & 2032
- Figure 14: Asia Pacific Smart Display Industry Volume Share (%), by Country 2024 & 2032
- Figure 15: South America Smart Display Industry Revenue (Million), by Country 2024 & 2032
- Figure 16: South America Smart Display Industry Volume (K Unit), by Country 2024 & 2032
- Figure 17: South America Smart Display Industry Revenue Share (%), by Country 2024 & 2032
- Figure 18: South America Smart Display Industry Volume Share (%), by Country 2024 & 2032
- Figure 19: MEA Smart Display Industry Revenue (Million), by Country 2024 & 2032
- Figure 20: MEA Smart Display Industry Volume (K Unit), by Country 2024 & 2032
- Figure 21: MEA Smart Display Industry Revenue Share (%), by Country 2024 & 2032
- Figure 22: MEA Smart Display Industry Volume Share (%), by Country 2024 & 2032
- Figure 23: North America Smart Display Industry Revenue (Million), by Product Type 2024 & 2032
- Figure 24: North America Smart Display Industry Volume (K Unit), by Product Type 2024 & 2032
- Figure 25: North America Smart Display Industry Revenue Share (%), by Product Type 2024 & 2032
- Figure 26: North America Smart Display Industry Volume Share (%), by Product Type 2024 & 2032
- Figure 27: North America Smart Display Industry Revenue (Million), by Application 2024 & 2032
- Figure 28: North America Smart Display Industry Volume (K Unit), by Application 2024 & 2032
- Figure 29: North America Smart Display Industry Revenue Share (%), by Application 2024 & 2032
- Figure 30: North America Smart Display Industry Volume Share (%), by Application 2024 & 2032
- Figure 31: North America Smart Display Industry Revenue (Million), by Country 2024 & 2032
- Figure 32: North America Smart Display Industry Volume (K Unit), by Country 2024 & 2032
- Figure 33: North America Smart Display Industry Revenue Share (%), by Country 2024 & 2032
- Figure 34: North America Smart Display Industry Volume Share (%), by Country 2024 & 2032
- Figure 35: Europe Smart Display Industry Revenue (Million), by Product Type 2024 & 2032
- Figure 36: Europe Smart Display Industry Volume (K Unit), by Product Type 2024 & 2032
- Figure 37: Europe Smart Display Industry Revenue Share (%), by Product Type 2024 & 2032
- Figure 38: Europe Smart Display Industry Volume Share (%), by Product Type 2024 & 2032
- Figure 39: Europe Smart Display Industry Revenue (Million), by Application 2024 & 2032
- Figure 40: Europe Smart Display Industry Volume (K Unit), by Application 2024 & 2032
- Figure 41: Europe Smart Display Industry Revenue Share (%), by Application 2024 & 2032
- Figure 42: Europe Smart Display Industry Volume Share (%), by Application 2024 & 2032
- Figure 43: Europe Smart Display Industry Revenue (Million), by Country 2024 & 2032
- Figure 44: Europe Smart Display Industry Volume (K Unit), by Country 2024 & 2032
- Figure 45: Europe Smart Display Industry Revenue Share (%), by Country 2024 & 2032
- Figure 46: Europe Smart Display Industry Volume Share (%), by Country 2024 & 2032
- Figure 47: Asia Pacific Smart Display Industry Revenue (Million), by Product Type 2024 & 2032
- Figure 48: Asia Pacific Smart Display Industry Volume (K Unit), by Product Type 2024 & 2032
- Figure 49: Asia Pacific Smart Display Industry Revenue Share (%), by Product Type 2024 & 2032
- Figure 50: Asia Pacific Smart Display Industry Volume Share (%), by Product Type 2024 & 2032
- Figure 51: Asia Pacific Smart Display Industry Revenue (Million), by Application 2024 & 2032
- Figure 52: Asia Pacific Smart Display Industry Volume (K Unit), by Application 2024 & 2032
- Figure 53: Asia Pacific Smart Display Industry Revenue Share (%), by Application 2024 & 2032
- Figure 54: Asia Pacific Smart Display Industry Volume Share (%), by Application 2024 & 2032
- Figure 55: Asia Pacific Smart Display Industry Revenue (Million), by Country 2024 & 2032
- Figure 56: Asia Pacific Smart Display Industry Volume (K Unit), by Country 2024 & 2032
- Figure 57: Asia Pacific Smart Display Industry Revenue Share (%), by Country 2024 & 2032
- Figure 58: Asia Pacific Smart Display Industry Volume Share (%), by Country 2024 & 2032
- Figure 59: Rest of the World Smart Display Industry Revenue (Million), by Product Type 2024 & 2032
- Figure 60: Rest of the World Smart Display Industry Volume (K Unit), by Product Type 2024 & 2032
- Figure 61: Rest of the World Smart Display Industry Revenue Share (%), by Product Type 2024 & 2032
- Figure 62: Rest of the World Smart Display Industry Volume Share (%), by Product Type 2024 & 2032
- Figure 63: Rest of the World Smart Display Industry Revenue (Million), by Application 2024 & 2032
- Figure 64: Rest of the World Smart Display Industry Volume (K Unit), by Application 2024 & 2032
- Figure 65: Rest of the World Smart Display Industry Revenue Share (%), by Application 2024 & 2032
- Figure 66: Rest of the World Smart Display Industry Volume Share (%), by Application 2024 & 2032
- Figure 67: Rest of the World Smart Display Industry Revenue (Million), by Country 2024 & 2032
- Figure 68: Rest of the World Smart Display Industry Volume (K Unit), by Country 2024 & 2032
- Figure 69: Rest of the World Smart Display Industry Revenue Share (%), by Country 2024 & 2032
- Figure 70: Rest of the World Smart Display Industry Volume Share (%), by Country 2024 & 2032
List of Tables
- Table 1: Global Smart Display Industry Revenue Million Forecast, by Region 2019 & 2032
- Table 2: Global Smart Display Industry Volume K Unit Forecast, by Region 2019 & 2032
- Table 3: Global Smart Display Industry Revenue Million Forecast, by Product Type 2019 & 2032
- Table 4: Global Smart Display Industry Volume K Unit Forecast, by Product Type 2019 & 2032
- Table 5: Global Smart Display Industry Revenue Million Forecast, by Application 2019 & 2032
- Table 6: Global Smart Display Industry Volume K Unit Forecast, by Application 2019 & 2032
- Table 7: Global Smart Display Industry Revenue Million Forecast, by Region 2019 & 2032
- Table 8: Global Smart Display Industry Volume K Unit Forecast, by Region 2019 & 2032
- Table 9: Global Smart Display Industry Revenue Million Forecast, by Country 2019 & 2032
- Table 10: Global Smart Display Industry Volume K Unit Forecast, by Country 2019 & 2032
- Table 11: United States Smart Display Industry Revenue (Million) Forecast, by Application 2019 & 2032
- Table 12: United States Smart Display Industry Volume (K Unit) Forecast, by Application 2019 & 2032
- Table 13: Canada Smart Display Industry Revenue (Million) Forecast, by Application 2019 & 2032
- Table 14: Canada Smart Display Industry Volume (K Unit) Forecast, by Application 2019 & 2032
- Table 15: Mexico Smart Display Industry Revenue (Million) Forecast, by Application 2019 & 2032
- Table 16: Mexico Smart Display Industry Volume (K Unit) Forecast, by Application 2019 & 2032
- Table 17: Global Smart Display Industry Revenue Million Forecast, by Country 2019 & 2032
- Table 18: Global Smart Display Industry Volume K Unit Forecast, by Country 2019 & 2032
- Table 19: Germany Smart Display Industry Revenue (Million) Forecast, by Application 2019 & 2032
- Table 20: Germany Smart Display Industry Volume (K Unit) Forecast, by Application 2019 & 2032
- Table 21: United Kingdom Smart Display Industry Revenue (Million) Forecast, by Application 2019 & 2032
- Table 22: United Kingdom Smart Display Industry Volume (K Unit) Forecast, by Application 2019 & 2032
- Table 23: France Smart Display Industry Revenue (Million) Forecast, by Application 2019 & 2032
- Table 24: France Smart Display Industry Volume (K Unit) Forecast, by Application 2019 & 2032
- Table 25: Spain Smart Display Industry Revenue (Million) Forecast, by Application 2019 & 2032
- Table 26: Spain Smart Display Industry Volume (K Unit) Forecast, by Application 2019 & 2032
- Table 27: Italy Smart Display Industry Revenue (Million) Forecast, by Application 2019 & 2032
- Table 28: Italy Smart Display Industry Volume (K Unit) Forecast, by Application 2019 & 2032
- Table 29: Spain Smart Display Industry Revenue (Million) Forecast, by Application 2019 & 2032
- Table 30: Spain Smart Display Industry Volume (K Unit) Forecast, by Application 2019 & 2032
- Table 31: Belgium Smart Display Industry Revenue (Million) Forecast, by Application 2019 & 2032
- Table 32: Belgium Smart Display Industry Volume (K Unit) Forecast, by Application 2019 & 2032
- Table 33: Netherland Smart Display Industry Revenue (Million) Forecast, by Application 2019 & 2032
- Table 34: Netherland Smart Display Industry Volume (K Unit) Forecast, by Application 2019 & 2032
- Table 35: Nordics Smart Display Industry Revenue (Million) Forecast, by Application 2019 & 2032
- Table 36: Nordics Smart Display Industry Volume (K Unit) Forecast, by Application 2019 & 2032
- Table 37: Rest of Europe Smart Display Industry Revenue (Million) Forecast, by Application 2019 & 2032
- Table 38: Rest of Europe Smart Display Industry Volume (K Unit) Forecast, by Application 2019 & 2032
- Table 39: Global Smart Display Industry Revenue Million Forecast, by Country 2019 & 2032
- Table 40: Global Smart Display Industry Volume K Unit Forecast, by Country 2019 & 2032
- Table 41: China Smart Display Industry Revenue (Million) Forecast, by Application 2019 & 2032
- Table 42: China Smart Display Industry Volume (K Unit) Forecast, by Application 2019 & 2032
- Table 43: Japan Smart Display Industry Revenue (Million) Forecast, by Application 2019 & 2032
- Table 44: Japan Smart Display Industry Volume (K Unit) Forecast, by Application 2019 & 2032
- Table 45: India Smart Display Industry Revenue (Million) Forecast, by Application 2019 & 2032
- Table 46: India Smart Display Industry Volume (K Unit) Forecast, by Application 2019 & 2032
- Table 47: South Korea Smart Display Industry Revenue (Million) Forecast, by Application 2019 & 2032
- Table 48: South Korea Smart Display Industry Volume (K Unit) Forecast, by Application 2019 & 2032
- Table 49: Southeast Asia Smart Display Industry Revenue (Million) Forecast, by Application 2019 & 2032
- Table 50: Southeast Asia Smart Display Industry Volume (K Unit) Forecast, by Application 2019 & 2032
- Table 51: Australia Smart Display Industry Revenue (Million) Forecast, by Application 2019 & 2032
- Table 52: Australia Smart Display Industry Volume (K Unit) Forecast, by Application 2019 & 2032
- Table 53: Indonesia Smart Display Industry Revenue (Million) Forecast, by Application 2019 & 2032
- Table 54: Indonesia Smart Display Industry Volume (K Unit) Forecast, by Application 2019 & 2032
- Table 55: Phillipes Smart Display Industry Revenue (Million) Forecast, by Application 2019 & 2032
- Table 56: Phillipes Smart Display Industry Volume (K Unit) Forecast, by Application 2019 & 2032
- Table 57: Singapore Smart Display Industry Revenue (Million) Forecast, by Application 2019 & 2032
- Table 58: Singapore Smart Display Industry Volume (K Unit) Forecast, by Application 2019 & 2032
- Table 59: Thailandc Smart Display Industry Revenue (Million) Forecast, by Application 2019 & 2032
- Table 60: Thailandc Smart Display Industry Volume (K Unit) Forecast, by Application 2019 & 2032
- Table 61: Rest of Asia Pacific Smart Display Industry Revenue (Million) Forecast, by Application 2019 & 2032
- Table 62: Rest of Asia Pacific Smart Display Industry Volume (K Unit) Forecast, by Application 2019 & 2032
- Table 63: Global Smart Display Industry Revenue Million Forecast, by Country 2019 & 2032
- Table 64: Global Smart Display Industry Volume K Unit Forecast, by Country 2019 & 2032
- Table 65: Brazil Smart Display Industry Revenue (Million) Forecast, by Application 2019 & 2032
- Table 66: Brazil Smart Display Industry Volume (K Unit) Forecast, by Application 2019 & 2032
- Table 67: Argentina Smart Display Industry Revenue (Million) Forecast, by Application 2019 & 2032
- Table 68: Argentina Smart Display Industry Volume (K Unit) Forecast, by Application 2019 & 2032
- Table 69: Peru Smart Display Industry Revenue (Million) Forecast, by Application 2019 & 2032
- Table 70: Peru Smart Display Industry Volume (K Unit) Forecast, by Application 2019 & 2032
- Table 71: Chile Smart Display Industry Revenue (Million) Forecast, by Application 2019 & 2032
- Table 72: Chile Smart Display Industry Volume (K Unit) Forecast, by Application 2019 & 2032
- Table 73: Colombia Smart Display Industry Revenue (Million) Forecast, by Application 2019 & 2032
- Table 74: Colombia Smart Display Industry Volume (K Unit) Forecast, by Application 2019 & 2032
- Table 75: Ecuador Smart Display Industry Revenue (Million) Forecast, by Application 2019 & 2032
- Table 76: Ecuador Smart Display Industry Volume (K Unit) Forecast, by Application 2019 & 2032
- Table 77: Venezuela Smart Display Industry Revenue (Million) Forecast, by Application 2019 & 2032
- Table 78: Venezuela Smart Display Industry Volume (K Unit) Forecast, by Application 2019 & 2032
- Table 79: Rest of South America Smart Display Industry Revenue (Million) Forecast, by Application 2019 & 2032
- Table 80: Rest of South America Smart Display Industry Volume (K Unit) Forecast, by Application 2019 & 2032
- Table 81: Global Smart Display Industry Revenue Million Forecast, by Country 2019 & 2032
- Table 82: Global Smart Display Industry Volume K Unit Forecast, by Country 2019 & 2032
- Table 83: United Arab Emirates Smart Display Industry Revenue (Million) Forecast, by Application 2019 & 2032
- Table 84: United Arab Emirates Smart Display Industry Volume (K Unit) Forecast, by Application 2019 & 2032
- Table 85: Saudi Arabia Smart Display Industry Revenue (Million) Forecast, by Application 2019 & 2032
- Table 86: Saudi Arabia Smart Display Industry Volume (K Unit) Forecast, by Application 2019 & 2032
- Table 87: South Africa Smart Display Industry Revenue (Million) Forecast, by Application 2019 & 2032
- Table 88: South Africa Smart Display Industry Volume (K Unit) Forecast, by Application 2019 & 2032
- Table 89: Rest of Middle East and Africa Smart Display Industry Revenue (Million) Forecast, by Application 2019 & 2032
- Table 90: Rest of Middle East and Africa Smart Display Industry Volume (K Unit) Forecast, by Application 2019 & 2032
- Table 91: Global Smart Display Industry Revenue Million Forecast, by Product Type 2019 & 2032
- Table 92: Global Smart Display Industry Volume K Unit Forecast, by Product Type 2019 & 2032
- Table 93: Global Smart Display Industry Revenue Million Forecast, by Application 2019 & 2032
- Table 94: Global Smart Display Industry Volume K Unit Forecast, by Application 2019 & 2032
- Table 95: Global Smart Display Industry Revenue Million Forecast, by Country 2019 & 2032
- Table 96: Global Smart Display Industry Volume K Unit Forecast, by Country 2019 & 2032
- Table 97: Global Smart Display Industry Revenue Million Forecast, by Product Type 2019 & 2032
- Table 98: Global Smart Display Industry Volume K Unit Forecast, by Product Type 2019 & 2032
- Table 99: Global Smart Display Industry Revenue Million Forecast, by Application 2019 & 2032
- Table 100: Global Smart Display Industry Volume K Unit Forecast, by Application 2019 & 2032
- Table 101: Global Smart Display Industry Revenue Million Forecast, by Country 2019 & 2032
- Table 102: Global Smart Display Industry Volume K Unit Forecast, by Country 2019 & 2032
- Table 103: Global Smart Display Industry Revenue Million Forecast, by Product Type 2019 & 2032
- Table 104: Global Smart Display Industry Volume K Unit Forecast, by Product Type 2019 & 2032
- Table 105: Global Smart Display Industry Revenue Million Forecast, by Application 2019 & 2032
- Table 106: Global Smart Display Industry Volume K Unit Forecast, by Application 2019 & 2032
- Table 107: Global Smart Display Industry Revenue Million Forecast, by Country 2019 & 2032
- Table 108: Global Smart Display Industry Volume K Unit Forecast, by Country 2019 & 2032
- Table 109: Global Smart Display Industry Revenue Million Forecast, by Product Type 2019 & 2032
- Table 110: Global Smart Display Industry Volume K Unit Forecast, by Product Type 2019 & 2032
- Table 111: Global Smart Display Industry Revenue Million Forecast, by Application 2019 & 2032
- Table 112: Global Smart Display Industry Volume K Unit Forecast, by Application 2019 & 2032
- Table 113: Global Smart Display Industry Revenue Million Forecast, by Country 2019 & 2032
- Table 114: Global Smart Display Industry Volume K Unit Forecast, by Country 2019 & 2032
Frequently Asked Questions
1. What is the projected Compound Annual Growth Rate (CAGR) of the Smart Display Industry?
The projected CAGR is approximately 28.40%.
2. Which companies are prominent players in the Smart Display Industry?
Key companies in the market include Baidu Inc, Lenovo Group Limited, Google LLC, Amazon com Inc, Facebook Inc, JBL ( Harman International), LG Electronics Inc .
3. What are the main segments of the Smart Display Industry?
The market segments include Product Type, Application.
4. Can you provide details about the market size?
The market size is estimated to be USD 3.74 Million as of 2022.
5. What are some drivers contributing to market growth?
Increasing Demand of Smart Home Devices.
6. What are the notable trends driving market growth?
Connected Device to Drive the Market Growth.
7. Are there any restraints impacting market growth?
High Cost and Limited Set of Vocabulary.
8. Can you provide examples of recent developments in the market?
September 2022: Lenovo launched its first smart glasses called Lenovo Glasses T1. The highlights of the smart glasses include two micro OLED displays, a USB-C port for connectivity, and built-in speakers. The Lenovo smart glasses are also called Lenovo Yoga Glasses in China.
9. What pricing options are available for accessing the report?
Pricing options include single-user, multi-user, and enterprise licenses priced at USD 4750, USD 5250, and USD 8750 respectively.
10. Is the market size provided in terms of value or volume?
The market size is provided in terms of value, measured in Million and volume, measured in K Unit.
11. Are there any specific market keywords associated with the report?
Yes, the market keyword associated with the report is "Smart Display Industry," which aids in identifying and referencing the specific market segment covered.
12. How do I determine which pricing option suits my needs best?
The pricing options vary based on user requirements and access needs. Individual users may opt for single-user licenses, while businesses requiring broader access may choose multi-user or enterprise licenses for cost-effective access to the report.
13. Are there any additional resources or data provided in the Smart Display Industry report?
While the report offers comprehensive insights, it's advisable to review the specific contents or supplementary materials provided to ascertain if additional resources or data are available.
14. How can I stay updated on further developments or reports in the Smart Display Industry?
To stay informed about further developments, trends, and reports in the Smart Display Industry, consider subscribing to industry newsletters, following relevant companies and organizations, or regularly checking reputable industry news sources and publications.
Methodology
Step 1 - Identification of Relevant Samples Size from Population Database


Step 2 - Approaches for Defining Global Market Size (Value, Volume* & Price*)

Note*: In applicable scenarios
Step 3 - Data Sources
Primary Research
- Web Analytics
- Survey Reports
- Research Institute
- Latest Research Reports
- Opinion Leaders
Secondary Research
- Annual Reports
- White Paper
- Latest Press Release
- Industry Association
- Paid Database
- Investor Presentations

Step 4 - Data Triangulation
Involves using different sources of information in order to increase the validity of a study
These sources are likely to be stakeholders in a program - participants, other researchers, program staff, other community members, and so on.
Then we put all data in single framework & apply various statistical tools to find out the dynamic on the market.
During the analysis stage, feedback from the stakeholder groups would be compared to determine areas of agreement as well as areas of divergence


