
Key Insights
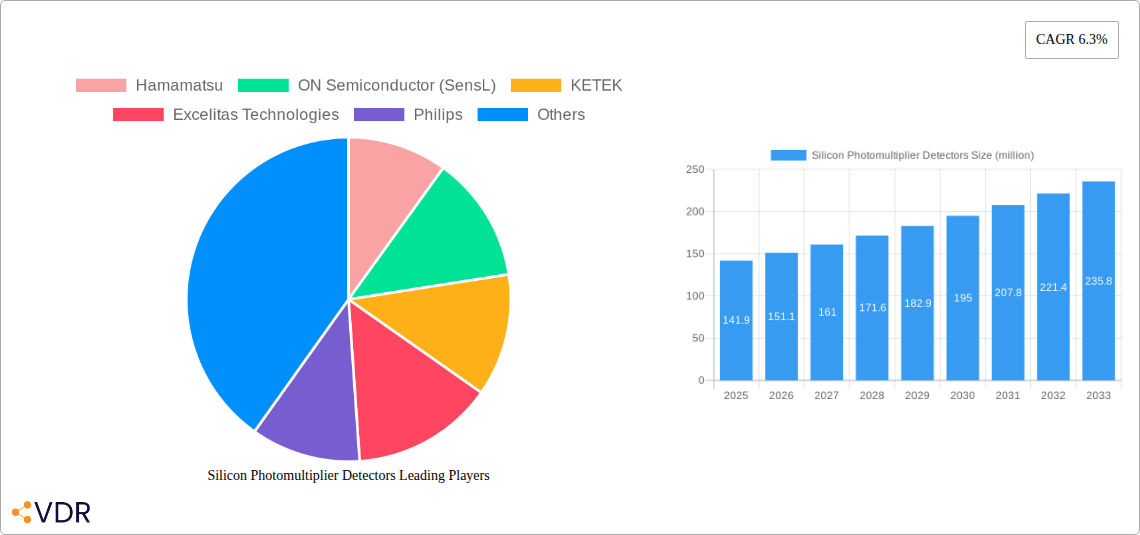
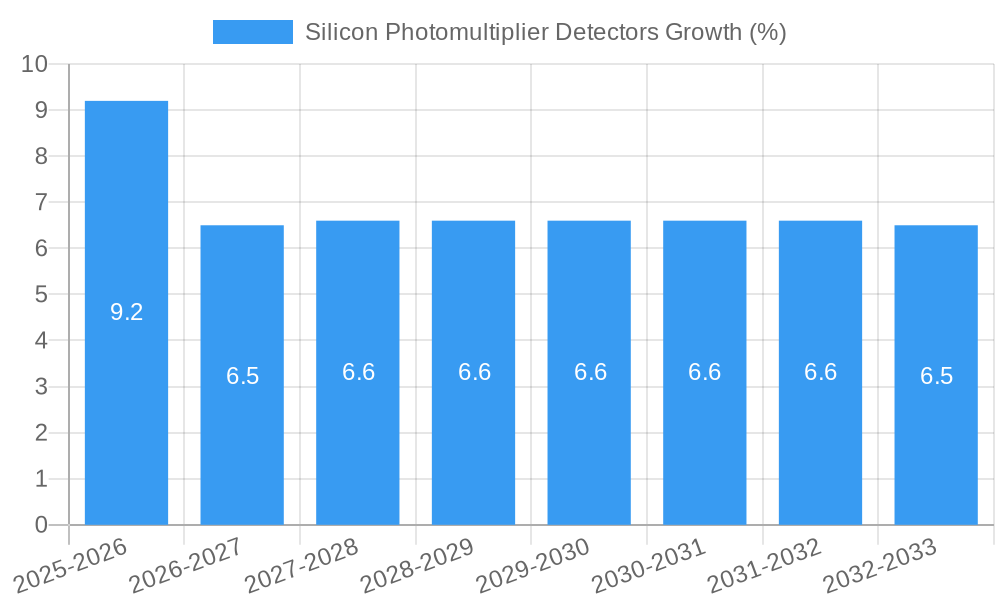
The global Silicon Photomultiplier (SiPM) detector market is experiencing robust growth, projected to reach a value of $141.9 million in 2025 and maintain a Compound Annual Growth Rate (CAGR) of 6.3% from 2025 to 2033. This expansion is driven by increasing demand across diverse sectors. The healthcare industry, particularly in medical imaging and diagnostics (e.g., PET and SPECT scanners), is a significant driver, fueled by advancements in precision medicine and the rising prevalence of chronic diseases. Furthermore, the high sensitivity and low noise characteristics of SiPM detectors are making them increasingly attractive in high-energy physics experiments, contributing to advancements in fundamental scientific research. The growth is also supported by the expanding use of SiPMs in various industrial applications, such as environmental monitoring (radiation detection) and industrial automation (precise optical sensing). The strong performance in low-light conditions makes them ideal in these contexts.
However, the market faces some challenges. High manufacturing costs and potential limitations in terms of the overall size and form factor of SiPM detectors can restrict their wider adoption in certain applications. Nevertheless, ongoing technological advancements focused on enhancing efficiency, reducing costs, and improving performance are anticipated to mitigate these restraints. The leading companies in the SiPM detector market, including Hamamatsu, ON Semiconductor (SensL), KETEK, Excelitas Technologies, and others, are actively engaged in R&D efforts to address these issues and expand their market share. Competition is expected to intensify further as new players enter the market, leading to innovation and diversification of products and applications. This continuous development and innovation will be key factors in driving continued market growth in the coming years.
Silicon Photomultiplier Detectors Market Report: 2019-2033
This comprehensive report provides an in-depth analysis of the Silicon Photomultiplier Detectors (SiPM) market, encompassing market dynamics, growth trends, regional analysis, product landscape, and key player strategies. The report covers the period from 2019 to 2033, with a focus on the forecast period 2025-2033, and uses 2025 as the base year. The study includes detailed market sizing in million units and offers valuable insights for industry professionals, investors, and stakeholders.
Parent Market: Semiconductor Detectors Child Market: Photomultiplier Tubes (PMTs)
Silicon Photomultiplier Detectors Market Dynamics & Structure
The global Silicon Photomultiplier Detectors market is characterized by moderate concentration, with key players like Hamamatsu, ON Semiconductor (SensL), and KETEK holding significant market share. The market size in 2025 is estimated at xx million units, with a projected CAGR of xx% during 2025-2033. Technological innovations, particularly in higher sensitivity and lower noise SiPMs, are major growth drivers. Stringent regulatory frameworks concerning radiation safety in various applications influence market development. Competitive pressure from alternative technologies like APDs is present, albeit limited due to SiPM's superior performance in certain applications. End-user demographics are diverse, spanning medical imaging, high-energy physics, and industrial sensing. The historical period (2019-2024) witnessed a steady increase in M&A activity, with approximately xx deals recorded, primarily focused on consolidating technology and expanding market reach.
- Market Concentration: Moderately concentrated, with top 5 players holding approximately xx% market share in 2025.
- Technological Innovation: Focus on improving sensitivity, reducing noise, and increasing operating temperature range.
- Regulatory Framework: Compliance with radiation safety standards varies across regions and applications.
- Competitive Substitutes: Avalanche photodiodes (APDs) pose a limited competitive threat.
- End-User Demographics: Diverse, encompassing healthcare, scientific research, industrial automation, and security.
- M&A Trends: xx M&A deals between 2019 and 2024, indicating market consolidation.
Silicon Photomultiplier Detectors Growth Trends & Insights
The SiPM market exhibits robust growth, driven by increasing demand across diverse applications. The market size experienced a CAGR of xx% during the historical period (2019-2024), growing from xx million units in 2019 to xx million units in 2024. The adoption rate is accelerating, particularly in medical imaging and high-energy physics, due to the superior performance of SiPMs compared to traditional photomultiplier tubes. Technological disruptions, such as the development of high-performance SiPM arrays, are further fueling market expansion. Consumer behavior shifts, driven by the need for improved sensitivity and faster response times, are also impacting market growth. The forecast period (2025-2033) is projected to witness a CAGR of xx%, reaching xx million units by 2033. This growth is supported by ongoing technological advancements and the expansion of SiPM applications into new markets. Market penetration is expected to increase significantly, driven by favorable cost-performance ratios and the increasing adoption of SiPMs in new applications.
Dominant Regions, Countries, or Segments in Silicon Photomultiplier Detectors
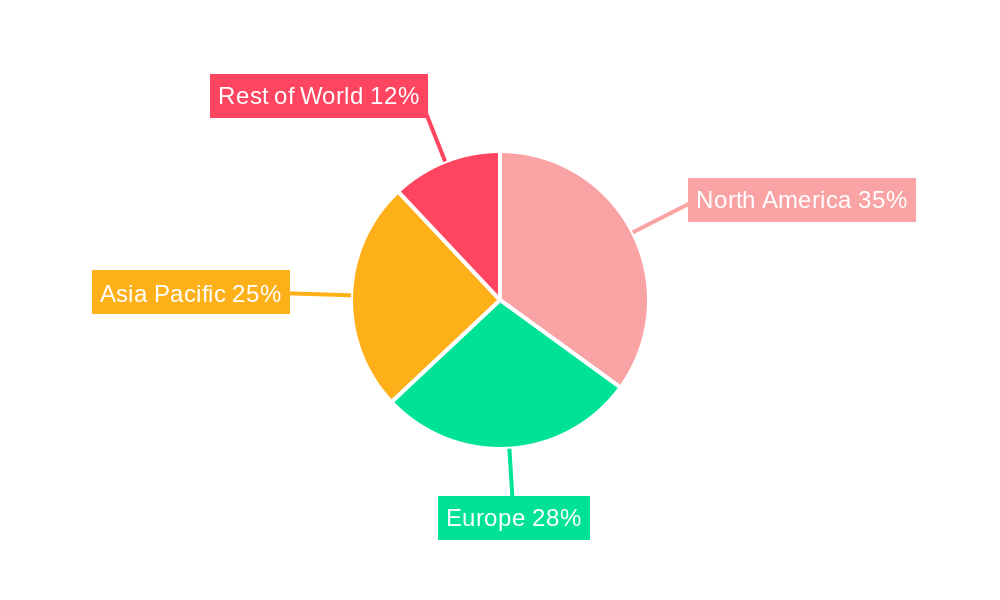
North America currently holds the largest market share, driven by significant investments in medical imaging and scientific research. Europe follows closely, propelled by strong growth in industrial automation and security applications. Asia-Pacific is experiencing rapid growth, fueled by increasing adoption in medical and scientific fields.
- North America: Strong growth driven by investments in advanced medical imaging and research.
- Europe: High demand from industrial applications and increasing adoption in scientific research.
- Asia-Pacific: Rapid growth fueled by expanding healthcare infrastructure and scientific research initiatives.
- Key Drivers: Government funding for research and development, investments in healthcare infrastructure, and increasing demand for advanced sensing technologies.
Silicon Photomultiplier Detectors Product Landscape
Silicon Photomultiplier Detectors are available in various formats, including single-pixel and multi-pixel arrays, with a range of active areas and sensitivities. Recent innovations focus on improved performance metrics like higher photon detection efficiency (PDE), lower dark count rates, and broader spectral response. These advancements are enhancing the applicability of SiPMs across diverse sectors, including medical imaging (PET, SPECT), high-energy physics, and industrial sensing. Unique selling propositions include their compact size, high gain, and excellent timing resolution, offering advantages over conventional PMTs.
Key Drivers, Barriers & Challenges in Silicon Photomultiplier Detectors
Key Drivers:
- Increasing demand for high-sensitivity and fast-response detectors in medical imaging.
- Growing adoption in high-energy physics experiments for particle detection.
- Technological advancements leading to improved performance and reduced costs.
Key Challenges:
- High production costs compared to alternative technologies, limiting widespread adoption in certain price-sensitive applications.
- Supply chain disruptions can impact availability and pricing.
- Competition from alternative technologies like APDs. The market share of SiPMs compared to APDs is currently at xx% but may decline to xx% by 2033 due to price competition.
Emerging Opportunities in Silicon Photomultiplier Detectors
- Expansion into new markets, such as environmental monitoring and consumer electronics.
- Development of integrated SiPM-based systems for improved ease of use and reduced costs.
- Customization of SiPMs to meet specific application requirements.
Growth Accelerators in the Silicon Photomultiplier Detectors Industry
Technological breakthroughs in materials science and fabrication techniques are driving cost reduction and performance enhancement. Strategic partnerships between SiPM manufacturers and system integrators are accelerating market adoption. Market expansion strategies targeting emerging applications, particularly in consumer electronics and environmental monitoring, are fueling long-term growth.
Key Players Shaping the Silicon Photomultiplier Detectors Market
- Hamamatsu
- ON Semiconductor (SensL)
- KETEK
- Excelitas Technologies
- Philips
- Broadcom
- First Sensor
- AdvanSiD
- Cremat
- Radiation Monitoring Devices
- TE Connectivity
Notable Milestones in Silicon Photomultiplier Detectors Sector
- 2020: Introduction of high-performance SiPM arrays by Hamamatsu.
- 2021: Acquisition of SensL by ON Semiconductor.
- 2022: Development of low-noise SiPMs for improved medical imaging applications by KETEK.
- 2023: Launch of cost-effective SiPMs for industrial applications by Excelitas Technologies.
- 2024: Partnership between Hamamatsu and a major medical imaging equipment manufacturer.
In-Depth Silicon Photomultiplier Detectors Market Outlook
The SiPM market is poised for substantial growth in the coming years, driven by technological advancements, expanding applications, and strategic partnerships. The market is expected to witness significant expansion into new sectors, resulting in increased market penetration and significant revenue growth. Companies focusing on innovation, strategic collaborations, and addressing emerging market demands are well-positioned to capture significant market share and drive long-term success.
Silicon Photomultiplier Detectors Segmentation
-
1. Application
- 1.1. Medical Imaging
- 1.2. Lidar & 3D-Ranging
- 1.3. Sorting & Recycling
- 1.4. Hazard & Threat Detection
- 1.5. Biophotonics & Sciences
- 1.6. High Energy Physics
- 1.7. Others
-
2. Types
- 2.1. Analog Silicon Photomultiplier
- 2.2. Digital Silicon Photomultiplier
Silicon Photomultiplier Detectors Segmentation By Geography
-
1. North America
- 1.1. United States
- 1.2. Canada
- 1.3. Mexico
-
2. South America
- 2.1. Brazil
- 2.2. Argentina
- 2.3. Rest of South America
-
3. Europe
- 3.1. United Kingdom
- 3.2. Germany
- 3.3. France
- 3.4. Italy
- 3.5. Spain
- 3.6. Russia
- 3.7. Benelux
- 3.8. Nordics
- 3.9. Rest of Europe
-
4. Middle East & Africa
- 4.1. Turkey
- 4.2. Israel
- 4.3. GCC
- 4.4. North Africa
- 4.5. South Africa
- 4.6. Rest of Middle East & Africa
-
5. Asia Pacific
- 5.1. China
- 5.2. India
- 5.3. Japan
- 5.4. South Korea
- 5.5. ASEAN
- 5.6. Oceania
- 5.7. Rest of Asia Pacific
Silicon Photomultiplier Detectors REPORT HIGHLIGHTS
| Aspects | Details |
|---|---|
| Study Period | 2019-2033 |
| Base Year | 2024 |
| Estimated Year | 2025 |
| Forecast Period | 2025-2033 |
| Historical Period | 2019-2024 |
| Growth Rate | CAGR of 6.3% from 2019-2033 |
| Segmentation |
|
Table of Contents
- 1. Introduction
- 1.1. Research Scope
- 1.2. Market Segmentation
- 1.3. Research Methodology
- 1.4. Definitions and Assumptions
- 2. Executive Summary
- 2.1. Introduction
- 3. Market Dynamics
- 3.1. Introduction
- 3.2. Market Drivers
- 3.3. Market Restrains
- 3.4. Market Trends
- 4. Market Factor Analysis
- 4.1. Porters Five Forces
- 4.2. Supply/Value Chain
- 4.3. PESTEL analysis
- 4.4. Market Entropy
- 4.5. Patent/Trademark Analysis
- 5. Global Silicon Photomultiplier Detectors Analysis, Insights and Forecast, 2019-2031
- 5.1. Market Analysis, Insights and Forecast - by Application
- 5.1.1. Medical Imaging
- 5.1.2. Lidar & 3D-Ranging
- 5.1.3. Sorting & Recycling
- 5.1.4. Hazard & Threat Detection
- 5.1.5. Biophotonics & Sciences
- 5.1.6. High Energy Physics
- 5.1.7. Others
- 5.2. Market Analysis, Insights and Forecast - by Types
- 5.2.1. Analog Silicon Photomultiplier
- 5.2.2. Digital Silicon Photomultiplier
- 5.3. Market Analysis, Insights and Forecast - by Region
- 5.3.1. North America
- 5.3.2. South America
- 5.3.3. Europe
- 5.3.4. Middle East & Africa
- 5.3.5. Asia Pacific
- 5.1. Market Analysis, Insights and Forecast - by Application
- 6. North America Silicon Photomultiplier Detectors Analysis, Insights and Forecast, 2019-2031
- 6.1. Market Analysis, Insights and Forecast - by Application
- 6.1.1. Medical Imaging
- 6.1.2. Lidar & 3D-Ranging
- 6.1.3. Sorting & Recycling
- 6.1.4. Hazard & Threat Detection
- 6.1.5. Biophotonics & Sciences
- 6.1.6. High Energy Physics
- 6.1.7. Others
- 6.2. Market Analysis, Insights and Forecast - by Types
- 6.2.1. Analog Silicon Photomultiplier
- 6.2.2. Digital Silicon Photomultiplier
- 6.1. Market Analysis, Insights and Forecast - by Application
- 7. South America Silicon Photomultiplier Detectors Analysis, Insights and Forecast, 2019-2031
- 7.1. Market Analysis, Insights and Forecast - by Application
- 7.1.1. Medical Imaging
- 7.1.2. Lidar & 3D-Ranging
- 7.1.3. Sorting & Recycling
- 7.1.4. Hazard & Threat Detection
- 7.1.5. Biophotonics & Sciences
- 7.1.6. High Energy Physics
- 7.1.7. Others
- 7.2. Market Analysis, Insights and Forecast - by Types
- 7.2.1. Analog Silicon Photomultiplier
- 7.2.2. Digital Silicon Photomultiplier
- 7.1. Market Analysis, Insights and Forecast - by Application
- 8. Europe Silicon Photomultiplier Detectors Analysis, Insights and Forecast, 2019-2031
- 8.1. Market Analysis, Insights and Forecast - by Application
- 8.1.1. Medical Imaging
- 8.1.2. Lidar & 3D-Ranging
- 8.1.3. Sorting & Recycling
- 8.1.4. Hazard & Threat Detection
- 8.1.5. Biophotonics & Sciences
- 8.1.6. High Energy Physics
- 8.1.7. Others
- 8.2. Market Analysis, Insights and Forecast - by Types
- 8.2.1. Analog Silicon Photomultiplier
- 8.2.2. Digital Silicon Photomultiplier
- 8.1. Market Analysis, Insights and Forecast - by Application
- 9. Middle East & Africa Silicon Photomultiplier Detectors Analysis, Insights and Forecast, 2019-2031
- 9.1. Market Analysis, Insights and Forecast - by Application
- 9.1.1. Medical Imaging
- 9.1.2. Lidar & 3D-Ranging
- 9.1.3. Sorting & Recycling
- 9.1.4. Hazard & Threat Detection
- 9.1.5. Biophotonics & Sciences
- 9.1.6. High Energy Physics
- 9.1.7. Others
- 9.2. Market Analysis, Insights and Forecast - by Types
- 9.2.1. Analog Silicon Photomultiplier
- 9.2.2. Digital Silicon Photomultiplier
- 9.1. Market Analysis, Insights and Forecast - by Application
- 10. Asia Pacific Silicon Photomultiplier Detectors Analysis, Insights and Forecast, 2019-2031
- 10.1. Market Analysis, Insights and Forecast - by Application
- 10.1.1. Medical Imaging
- 10.1.2. Lidar & 3D-Ranging
- 10.1.3. Sorting & Recycling
- 10.1.4. Hazard & Threat Detection
- 10.1.5. Biophotonics & Sciences
- 10.1.6. High Energy Physics
- 10.1.7. Others
- 10.2. Market Analysis, Insights and Forecast - by Types
- 10.2.1. Analog Silicon Photomultiplier
- 10.2.2. Digital Silicon Photomultiplier
- 10.1. Market Analysis, Insights and Forecast - by Application
- 11. Competitive Analysis
- 11.1. Global Market Share Analysis 2024
- 11.2. Company Profiles
- 11.2.1 Hamamatsu
- 11.2.1.1. Overview
- 11.2.1.2. Products
- 11.2.1.3. SWOT Analysis
- 11.2.1.4. Recent Developments
- 11.2.1.5. Financials (Based on Availability)
- 11.2.2 ON Semiconductor (SensL)
- 11.2.2.1. Overview
- 11.2.2.2. Products
- 11.2.2.3. SWOT Analysis
- 11.2.2.4. Recent Developments
- 11.2.2.5. Financials (Based on Availability)
- 11.2.3 KETEK
- 11.2.3.1. Overview
- 11.2.3.2. Products
- 11.2.3.3. SWOT Analysis
- 11.2.3.4. Recent Developments
- 11.2.3.5. Financials (Based on Availability)
- 11.2.4 Excelitas Technologies
- 11.2.4.1. Overview
- 11.2.4.2. Products
- 11.2.4.3. SWOT Analysis
- 11.2.4.4. Recent Developments
- 11.2.4.5. Financials (Based on Availability)
- 11.2.5 Philips
- 11.2.5.1. Overview
- 11.2.5.2. Products
- 11.2.5.3. SWOT Analysis
- 11.2.5.4. Recent Developments
- 11.2.5.5. Financials (Based on Availability)
- 11.2.6 Broadcom
- 11.2.6.1. Overview
- 11.2.6.2. Products
- 11.2.6.3. SWOT Analysis
- 11.2.6.4. Recent Developments
- 11.2.6.5. Financials (Based on Availability)
- 11.2.7 First Sensor
- 11.2.7.1. Overview
- 11.2.7.2. Products
- 11.2.7.3. SWOT Analysis
- 11.2.7.4. Recent Developments
- 11.2.7.5. Financials (Based on Availability)
- 11.2.8 AdvanSiD
- 11.2.8.1. Overview
- 11.2.8.2. Products
- 11.2.8.3. SWOT Analysis
- 11.2.8.4. Recent Developments
- 11.2.8.5. Financials (Based on Availability)
- 11.2.9 Cremat
- 11.2.9.1. Overview
- 11.2.9.2. Products
- 11.2.9.3. SWOT Analysis
- 11.2.9.4. Recent Developments
- 11.2.9.5. Financials (Based on Availability)
- 11.2.10 Radiation Monitoring Devices
- 11.2.10.1. Overview
- 11.2.10.2. Products
- 11.2.10.3. SWOT Analysis
- 11.2.10.4. Recent Developments
- 11.2.10.5. Financials (Based on Availability)
- 11.2.11 TE Connectivity
- 11.2.11.1. Overview
- 11.2.11.2. Products
- 11.2.11.3. SWOT Analysis
- 11.2.11.4. Recent Developments
- 11.2.11.5. Financials (Based on Availability)
- 11.2.1 Hamamatsu
List of Figures
- Figure 1: Global Silicon Photomultiplier Detectors Revenue Breakdown (million, %) by Region 2024 & 2032
- Figure 2: North America Silicon Photomultiplier Detectors Revenue (million), by Application 2024 & 2032
- Figure 3: North America Silicon Photomultiplier Detectors Revenue Share (%), by Application 2024 & 2032
- Figure 4: North America Silicon Photomultiplier Detectors Revenue (million), by Types 2024 & 2032
- Figure 5: North America Silicon Photomultiplier Detectors Revenue Share (%), by Types 2024 & 2032
- Figure 6: North America Silicon Photomultiplier Detectors Revenue (million), by Country 2024 & 2032
- Figure 7: North America Silicon Photomultiplier Detectors Revenue Share (%), by Country 2024 & 2032
- Figure 8: South America Silicon Photomultiplier Detectors Revenue (million), by Application 2024 & 2032
- Figure 9: South America Silicon Photomultiplier Detectors Revenue Share (%), by Application 2024 & 2032
- Figure 10: South America Silicon Photomultiplier Detectors Revenue (million), by Types 2024 & 2032
- Figure 11: South America Silicon Photomultiplier Detectors Revenue Share (%), by Types 2024 & 2032
- Figure 12: South America Silicon Photomultiplier Detectors Revenue (million), by Country 2024 & 2032
- Figure 13: South America Silicon Photomultiplier Detectors Revenue Share (%), by Country 2024 & 2032
- Figure 14: Europe Silicon Photomultiplier Detectors Revenue (million), by Application 2024 & 2032
- Figure 15: Europe Silicon Photomultiplier Detectors Revenue Share (%), by Application 2024 & 2032
- Figure 16: Europe Silicon Photomultiplier Detectors Revenue (million), by Types 2024 & 2032
- Figure 17: Europe Silicon Photomultiplier Detectors Revenue Share (%), by Types 2024 & 2032
- Figure 18: Europe Silicon Photomultiplier Detectors Revenue (million), by Country 2024 & 2032
- Figure 19: Europe Silicon Photomultiplier Detectors Revenue Share (%), by Country 2024 & 2032
- Figure 20: Middle East & Africa Silicon Photomultiplier Detectors Revenue (million), by Application 2024 & 2032
- Figure 21: Middle East & Africa Silicon Photomultiplier Detectors Revenue Share (%), by Application 2024 & 2032
- Figure 22: Middle East & Africa Silicon Photomultiplier Detectors Revenue (million), by Types 2024 & 2032
- Figure 23: Middle East & Africa Silicon Photomultiplier Detectors Revenue Share (%), by Types 2024 & 2032
- Figure 24: Middle East & Africa Silicon Photomultiplier Detectors Revenue (million), by Country 2024 & 2032
- Figure 25: Middle East & Africa Silicon Photomultiplier Detectors Revenue Share (%), by Country 2024 & 2032
- Figure 26: Asia Pacific Silicon Photomultiplier Detectors Revenue (million), by Application 2024 & 2032
- Figure 27: Asia Pacific Silicon Photomultiplier Detectors Revenue Share (%), by Application 2024 & 2032
- Figure 28: Asia Pacific Silicon Photomultiplier Detectors Revenue (million), by Types 2024 & 2032
- Figure 29: Asia Pacific Silicon Photomultiplier Detectors Revenue Share (%), by Types 2024 & 2032
- Figure 30: Asia Pacific Silicon Photomultiplier Detectors Revenue (million), by Country 2024 & 2032
- Figure 31: Asia Pacific Silicon Photomultiplier Detectors Revenue Share (%), by Country 2024 & 2032
List of Tables
- Table 1: Global Silicon Photomultiplier Detectors Revenue million Forecast, by Region 2019 & 2032
- Table 2: Global Silicon Photomultiplier Detectors Revenue million Forecast, by Application 2019 & 2032
- Table 3: Global Silicon Photomultiplier Detectors Revenue million Forecast, by Types 2019 & 2032
- Table 4: Global Silicon Photomultiplier Detectors Revenue million Forecast, by Region 2019 & 2032
- Table 5: Global Silicon Photomultiplier Detectors Revenue million Forecast, by Application 2019 & 2032
- Table 6: Global Silicon Photomultiplier Detectors Revenue million Forecast, by Types 2019 & 2032
- Table 7: Global Silicon Photomultiplier Detectors Revenue million Forecast, by Country 2019 & 2032
- Table 8: United States Silicon Photomultiplier Detectors Revenue (million) Forecast, by Application 2019 & 2032
- Table 9: Canada Silicon Photomultiplier Detectors Revenue (million) Forecast, by Application 2019 & 2032
- Table 10: Mexico Silicon Photomultiplier Detectors Revenue (million) Forecast, by Application 2019 & 2032
- Table 11: Global Silicon Photomultiplier Detectors Revenue million Forecast, by Application 2019 & 2032
- Table 12: Global Silicon Photomultiplier Detectors Revenue million Forecast, by Types 2019 & 2032
- Table 13: Global Silicon Photomultiplier Detectors Revenue million Forecast, by Country 2019 & 2032
- Table 14: Brazil Silicon Photomultiplier Detectors Revenue (million) Forecast, by Application 2019 & 2032
- Table 15: Argentina Silicon Photomultiplier Detectors Revenue (million) Forecast, by Application 2019 & 2032
- Table 16: Rest of South America Silicon Photomultiplier Detectors Revenue (million) Forecast, by Application 2019 & 2032
- Table 17: Global Silicon Photomultiplier Detectors Revenue million Forecast, by Application 2019 & 2032
- Table 18: Global Silicon Photomultiplier Detectors Revenue million Forecast, by Types 2019 & 2032
- Table 19: Global Silicon Photomultiplier Detectors Revenue million Forecast, by Country 2019 & 2032
- Table 20: United Kingdom Silicon Photomultiplier Detectors Revenue (million) Forecast, by Application 2019 & 2032
- Table 21: Germany Silicon Photomultiplier Detectors Revenue (million) Forecast, by Application 2019 & 2032
- Table 22: France Silicon Photomultiplier Detectors Revenue (million) Forecast, by Application 2019 & 2032
- Table 23: Italy Silicon Photomultiplier Detectors Revenue (million) Forecast, by Application 2019 & 2032
- Table 24: Spain Silicon Photomultiplier Detectors Revenue (million) Forecast, by Application 2019 & 2032
- Table 25: Russia Silicon Photomultiplier Detectors Revenue (million) Forecast, by Application 2019 & 2032
- Table 26: Benelux Silicon Photomultiplier Detectors Revenue (million) Forecast, by Application 2019 & 2032
- Table 27: Nordics Silicon Photomultiplier Detectors Revenue (million) Forecast, by Application 2019 & 2032
- Table 28: Rest of Europe Silicon Photomultiplier Detectors Revenue (million) Forecast, by Application 2019 & 2032
- Table 29: Global Silicon Photomultiplier Detectors Revenue million Forecast, by Application 2019 & 2032
- Table 30: Global Silicon Photomultiplier Detectors Revenue million Forecast, by Types 2019 & 2032
- Table 31: Global Silicon Photomultiplier Detectors Revenue million Forecast, by Country 2019 & 2032
- Table 32: Turkey Silicon Photomultiplier Detectors Revenue (million) Forecast, by Application 2019 & 2032
- Table 33: Israel Silicon Photomultiplier Detectors Revenue (million) Forecast, by Application 2019 & 2032
- Table 34: GCC Silicon Photomultiplier Detectors Revenue (million) Forecast, by Application 2019 & 2032
- Table 35: North Africa Silicon Photomultiplier Detectors Revenue (million) Forecast, by Application 2019 & 2032
- Table 36: South Africa Silicon Photomultiplier Detectors Revenue (million) Forecast, by Application 2019 & 2032
- Table 37: Rest of Middle East & Africa Silicon Photomultiplier Detectors Revenue (million) Forecast, by Application 2019 & 2032
- Table 38: Global Silicon Photomultiplier Detectors Revenue million Forecast, by Application 2019 & 2032
- Table 39: Global Silicon Photomultiplier Detectors Revenue million Forecast, by Types 2019 & 2032
- Table 40: Global Silicon Photomultiplier Detectors Revenue million Forecast, by Country 2019 & 2032
- Table 41: China Silicon Photomultiplier Detectors Revenue (million) Forecast, by Application 2019 & 2032
- Table 42: India Silicon Photomultiplier Detectors Revenue (million) Forecast, by Application 2019 & 2032
- Table 43: Japan Silicon Photomultiplier Detectors Revenue (million) Forecast, by Application 2019 & 2032
- Table 44: South Korea Silicon Photomultiplier Detectors Revenue (million) Forecast, by Application 2019 & 2032
- Table 45: ASEAN Silicon Photomultiplier Detectors Revenue (million) Forecast, by Application 2019 & 2032
- Table 46: Oceania Silicon Photomultiplier Detectors Revenue (million) Forecast, by Application 2019 & 2032
- Table 47: Rest of Asia Pacific Silicon Photomultiplier Detectors Revenue (million) Forecast, by Application 2019 & 2032
Frequently Asked Questions
1. What is the projected Compound Annual Growth Rate (CAGR) of the Silicon Photomultiplier Detectors?
The projected CAGR is approximately 6.3%.
2. Which companies are prominent players in the Silicon Photomultiplier Detectors?
Key companies in the market include Hamamatsu, ON Semiconductor (SensL), KETEK, Excelitas Technologies, Philips, Broadcom, First Sensor, AdvanSiD, Cremat, Radiation Monitoring Devices, TE Connectivity.
3. What are the main segments of the Silicon Photomultiplier Detectors?
The market segments include Application, Types.
4. Can you provide details about the market size?
The market size is estimated to be USD 141.9 million as of 2022.
5. What are some drivers contributing to market growth?
N/A
6. What are the notable trends driving market growth?
N/A
7. Are there any restraints impacting market growth?
N/A
8. Can you provide examples of recent developments in the market?
N/A
9. What pricing options are available for accessing the report?
Pricing options include single-user, multi-user, and enterprise licenses priced at USD 2900.00, USD 4350.00, and USD 5800.00 respectively.
10. Is the market size provided in terms of value or volume?
The market size is provided in terms of value, measured in million.
11. Are there any specific market keywords associated with the report?
Yes, the market keyword associated with the report is "Silicon Photomultiplier Detectors," which aids in identifying and referencing the specific market segment covered.
12. How do I determine which pricing option suits my needs best?
The pricing options vary based on user requirements and access needs. Individual users may opt for single-user licenses, while businesses requiring broader access may choose multi-user or enterprise licenses for cost-effective access to the report.
13. Are there any additional resources or data provided in the Silicon Photomultiplier Detectors report?
While the report offers comprehensive insights, it's advisable to review the specific contents or supplementary materials provided to ascertain if additional resources or data are available.
14. How can I stay updated on further developments or reports in the Silicon Photomultiplier Detectors?
To stay informed about further developments, trends, and reports in the Silicon Photomultiplier Detectors, consider subscribing to industry newsletters, following relevant companies and organizations, or regularly checking reputable industry news sources and publications.
Methodology
Step 1 - Identification of Relevant Samples Size from Population Database


Step 2 - Approaches for Defining Global Market Size (Value, Volume* & Price*)

Note*: In applicable scenarios
Step 3 - Data Sources
Primary Research
- Web Analytics
- Survey Reports
- Research Institute
- Latest Research Reports
- Opinion Leaders
Secondary Research
- Annual Reports
- White Paper
- Latest Press Release
- Industry Association
- Paid Database
- Investor Presentations

Step 4 - Data Triangulation
Involves using different sources of information in order to increase the validity of a study
These sources are likely to be stakeholders in a program - participants, other researchers, program staff, other community members, and so on.
Then we put all data in single framework & apply various statistical tools to find out the dynamic on the market.
During the analysis stage, feedback from the stakeholder groups would be compared to determine areas of agreement as well as areas of divergence


