
Key Insights
The ServiceNow Store Apps market is experiencing robust growth, fueled by increasing enterprise adoption of cloud-based solutions and a rising demand for workflow automation and improved operational efficiency. The market's Compound Annual Growth Rate (CAGR) of 32.73% from 2019 to 2024 indicates a significant upward trajectory, projecting substantial expansion through 2033. This growth is driven by several key factors: the proliferation of Software as a Service (SaaS) models, the need for customizable solutions to meet unique business requirements, and the ongoing digital transformation initiatives undertaken by organizations of all sizes. The market is segmented by enterprise size (SMEs and large enterprises) and application type (cloud-based and web-based), with cloud-based solutions leading the market due to their scalability and accessibility. Major players like ServiceNow itself, IBM, Microsoft, and Okta are driving innovation and competition within the ecosystem, leading to a diverse range of applications addressing various business needs, from IT service management to human resources and customer service. Geographic distribution shows strong market presence in North America and Europe, with Asia Pacific exhibiting significant growth potential given the increasing adoption of digital technologies in the region. The restraints on market growth primarily involve integration complexities and the need for skilled personnel to manage and optimize these applications.
The forecast period (2025-2033) promises continued expansion, driven by increasing investments in digital transformation and the development of sophisticated, niche applications. The large enterprise segment is expected to dominate due to its higher budget allocations and complex needs. However, the SME segment is also exhibiting promising growth, driven by the availability of cost-effective and easily deployable solutions. Future growth will likely be influenced by advancements in artificial intelligence (AI) and machine learning (ML) integration within ServiceNow apps, offering enhanced automation and predictive capabilities. The ongoing development of robust APIs and integration frameworks will also be pivotal in fostering further growth and adoption within the market. Competitive activity will remain high, with existing players expanding their offerings and new entrants seeking to carve out market share through innovation and strategic partnerships.
ServiceNow Store Apps Market: A Comprehensive Report (2019-2033)
This in-depth report provides a comprehensive analysis of the ServiceNow Store Apps Market, encompassing market dynamics, growth trends, regional performance, product landscape, key players, and future outlook. The study period covers 2019-2033, with 2025 as the base and estimated year. The report offers invaluable insights for businesses, investors, and industry professionals seeking to navigate this dynamic market. The market is segmented by enterprise size (SMEs and Large Enterprises) and by type (Cloud-Based and Web-Based). The parent market is the broader ServiceNow ecosystem, while the child market focuses specifically on applications available via the ServiceNow Store. The total market size in 2025 is estimated at xx Million.
ServiceNow Store Apps Market Dynamics & Structure
The ServiceNow Store Apps Market exhibits a moderately concentrated structure, with several key players holding significant market share. Technological innovation, particularly in areas like AI-driven automation and enhanced user experience, is a primary growth driver. Regulatory compliance requirements, especially concerning data privacy and security, significantly influence market development. While direct substitutes are limited, alternative ITSM solutions pose indirect competition. The market is largely driven by large enterprises, but SME adoption is steadily increasing. M&A activity has been moderate, with approximately xx deals recorded in the historical period (2019-2024), contributing to market consolidation.
- Market Concentration: Moderately concentrated, with top 5 players holding approximately xx% of the market share in 2025.
- Technological Innovation: AI-powered automation, improved UI/UX, and integration with other platforms are key drivers.
- Regulatory Framework: Compliance with data privacy regulations (GDPR, CCPA) is a significant factor.
- Competitive Substitutes: Alternative ITSM platforms and custom-built solutions pose indirect competition.
- End-User Demographics: Large Enterprises currently dominate, but SME adoption is growing rapidly.
- M&A Trends: Moderate M&A activity observed, with xx deals concluded between 2019 and 2024.
ServiceNow Store Apps Market Growth Trends & Insights
The ServiceNow Store Apps Market is experiencing robust growth, driven by increasing demand for efficient IT Service Management (ITSM) solutions and the growing popularity of the ServiceNow platform. The market size has expanded significantly from xx Million in 2019 to an estimated xx Million in 2025, exhibiting a Compound Annual Growth Rate (CAGR) of xx% during the historical period. Market penetration is high amongst large enterprises, while there's significant untapped potential within the SME sector. Technological disruptions, particularly the rise of cloud-based solutions and AI integration, are further accelerating market expansion. Consumer behavior shifts towards digitalization and automation are fueling demand for ServiceNow apps.
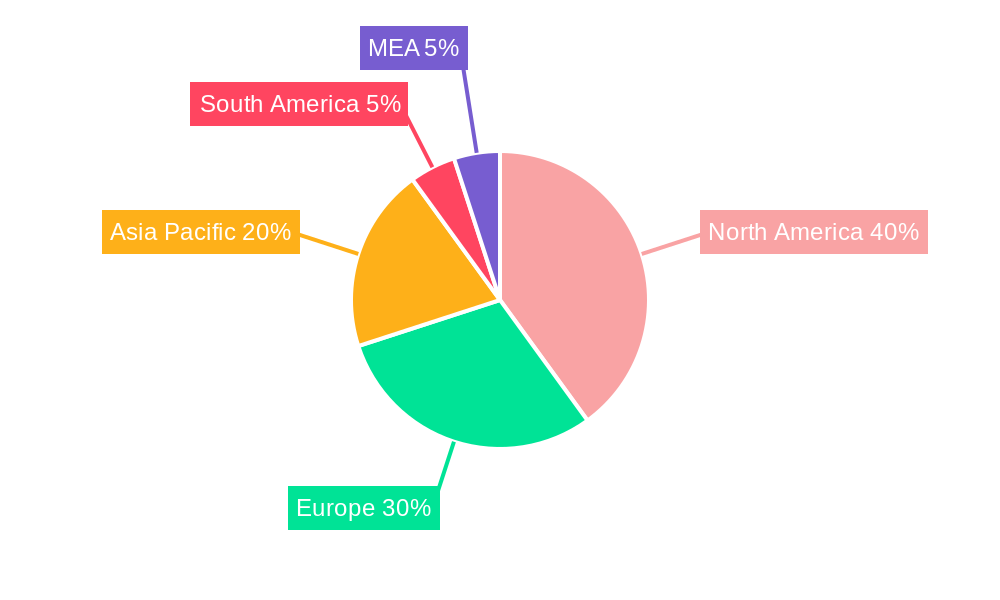
Dominant Regions, Countries, or Segments in ServiceNow Store Apps Market
North America currently dominates the ServiceNow Store Apps Market, driven by high IT spending, early adoption of cloud technologies, and a mature ITSM landscape. Large enterprises are the primary contributors to market growth in this region, followed by SMEs. Cloud-based solutions hold a greater market share compared to web-based options due to their scalability and flexibility.
- North America Dominance: High IT spending, early cloud adoption, and mature ITSM sector.
- Large Enterprise Segment: High adoption rates and substantial IT budgets.
- Cloud-Based Solutions: Superior scalability and flexibility compared to web-based alternatives.
- Europe and Asia-Pacific: Showing promising growth, driven by increasing digitalization and government initiatives.
ServiceNow Store Apps Market Product Landscape
The ServiceNow Store offers a diverse range of applications catering to various ITSM needs, including incident management, problem management, change management, and asset management. Recent innovations focus on AI-powered automation, enhanced analytics, and seamless integration with other enterprise systems. Many apps offer unique selling propositions such as tailored workflows, customizable dashboards, and real-time monitoring capabilities. Technological advancements are driving the creation of more sophisticated and user-friendly applications.
Key Drivers, Barriers & Challenges in ServiceNow Store Apps Market
Key Drivers:
- Growing demand for efficient ITSM solutions.
- Increasing adoption of cloud-based technologies.
- Rising need for automation and digital transformation.
- Strategic partnerships and integrations with other platforms.
Key Challenges:
- High initial investment costs for large-scale deployments.
- Complexity in integrating apps with existing IT infrastructure.
- Competition from alternative ITSM solutions.
- Security and data privacy concerns.
Emerging Opportunities in ServiceNow Store Apps Market
- Untapped potential within the SME sector.
- Growing demand for AI-powered ITSM solutions.
- Development of niche applications catering to specific industry needs.
- Expansion into emerging markets in Asia-Pacific and Latin America.
Growth Accelerators in the ServiceNow Store Apps Market Industry
The ServiceNow Store Apps Market's long-term growth is propelled by continuous technological innovation, strategic partnerships with leading technology providers, and the expanding global demand for streamlined and automated IT service management. The increasing adoption of cloud computing and the development of advanced analytics capabilities further contribute to market expansion.
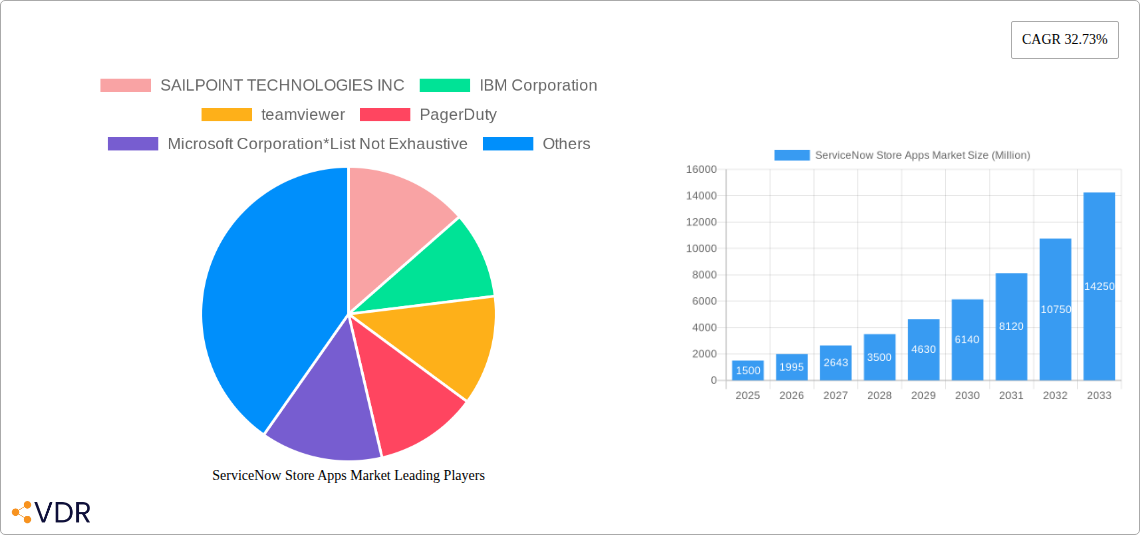
Key Players Shaping the ServiceNow Store Apps Market Market
- SAILPOINT TECHNOLOGIES INC
- IBM Corporation
- teamviewer
- PagerDuty
- Microsoft Corporation
- xMatters Inc
- Cisco Systems Inc
- Okta Inc
- Talkdesk Inc
- Dynatrace LLC
Notable Milestones in ServiceNow Store Apps Market Sector
- May 2023: xtype launches xtype View, a multi-instance dashboard for ServiceNow, improving plugin monitoring.
- March 2023: Anglepoint launches a ServiceNow app for IBM software asset management, enhancing IBM software tracking within the ServiceNow ecosystem.
In-Depth ServiceNow Store Apps Market Market Outlook
The ServiceNow Store Apps Market is poised for sustained growth, driven by ongoing technological advancements, increasing digital transformation initiatives, and the expanding global demand for efficient IT service management solutions. Strategic partnerships, market expansion into emerging economies, and the continuous development of innovative applications will further fuel market growth. The market is expected to reach xx Million by 2033.
ServiceNow Store Apps Market Segmentation
-
1. Type
- 1.1. Cloud-Based
- 1.2. Web- Based
-
2. Enterprise Size
- 2.1. Small and Medium Enterprises (SMEs)
- 2.2. Large Enterprises
ServiceNow Store Apps Market Segmentation By Geography
- 1. North America
- 2. Europe
- 3. Asia
- 4. Latin America
- 5. Middle East and Africa
ServiceNow Store Apps Market REPORT HIGHLIGHTS
| Aspects | Details |
|---|---|
| Study Period | 2019-2033 |
| Base Year | 2024 |
| Estimated Year | 2025 |
| Forecast Period | 2025-2033 |
| Historical Period | 2019-2024 |
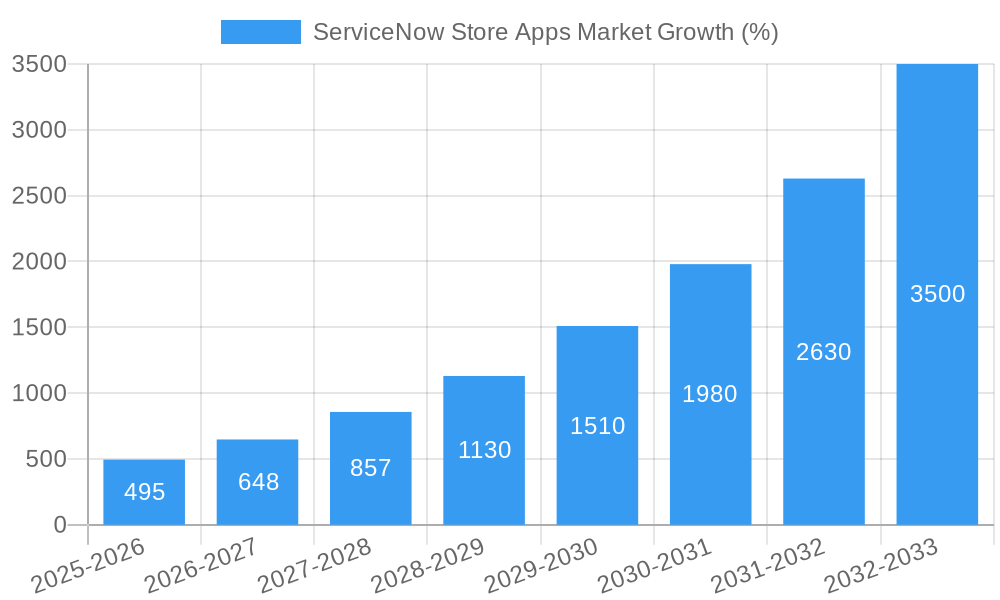
| Growth Rate | CAGR of 32.73% from 2019-2033 |
| Segmentation |
|
Table of Contents
- 1. Introduction
- 1.1. Research Scope
- 1.2. Market Segmentation
- 1.3. Research Methodology
- 1.4. Definitions and Assumptions
- 2. Executive Summary
- 2.1. Introduction
- 3. Market Dynamics
- 3.1. Introduction
- 3.2. Market Drivers
- 3.2.1. Rise in adoption of cloud services and cloud computing; Rise in digital platforms and adoption of advance technologies
- 3.3. Market Restrains
- 3.3.1. High upfront and licensing costs
- 3.4. Market Trends
- 3.4.1. Cloud-Based is Expected to Hold Significant Share of the Market
- 4. Market Factor Analysis
- 4.1. Porters Five Forces
- 4.2. Supply/Value Chain
- 4.3. PESTEL analysis
- 4.4. Market Entropy
- 4.5. Patent/Trademark Analysis
- 5. Global ServiceNow Store Apps Market Analysis, Insights and Forecast, 2019-2031
- 5.1. Market Analysis, Insights and Forecast - by Type
- 5.1.1. Cloud-Based
- 5.1.2. Web- Based
- 5.2. Market Analysis, Insights and Forecast - by Enterprise Size
- 5.2.1. Small and Medium Enterprises (SMEs)
- 5.2.2. Large Enterprises
- 5.3. Market Analysis, Insights and Forecast - by Region
- 5.3.1. North America
- 5.3.2. Europe
- 5.3.3. Asia
- 5.3.4. Latin America
- 5.3.5. Middle East and Africa
- 5.1. Market Analysis, Insights and Forecast - by Type
- 6. North America ServiceNow Store Apps Market Analysis, Insights and Forecast, 2019-2031
- 6.1. Market Analysis, Insights and Forecast - by Type
- 6.1.1. Cloud-Based
- 6.1.2. Web- Based
- 6.2. Market Analysis, Insights and Forecast - by Enterprise Size
- 6.2.1. Small and Medium Enterprises (SMEs)
- 6.2.2. Large Enterprises
- 6.1. Market Analysis, Insights and Forecast - by Type
- 7. Europe ServiceNow Store Apps Market Analysis, Insights and Forecast, 2019-2031
- 7.1. Market Analysis, Insights and Forecast - by Type
- 7.1.1. Cloud-Based
- 7.1.2. Web- Based
- 7.2. Market Analysis, Insights and Forecast - by Enterprise Size
- 7.2.1. Small and Medium Enterprises (SMEs)
- 7.2.2. Large Enterprises
- 7.1. Market Analysis, Insights and Forecast - by Type
- 8. Asia ServiceNow Store Apps Market Analysis, Insights and Forecast, 2019-2031
- 8.1. Market Analysis, Insights and Forecast - by Type
- 8.1.1. Cloud-Based
- 8.1.2. Web- Based
- 8.2. Market Analysis, Insights and Forecast - by Enterprise Size
- 8.2.1. Small and Medium Enterprises (SMEs)
- 8.2.2. Large Enterprises
- 8.1. Market Analysis, Insights and Forecast - by Type
- 9. Latin America ServiceNow Store Apps Market Analysis, Insights and Forecast, 2019-2031
- 9.1. Market Analysis, Insights and Forecast - by Type
- 9.1.1. Cloud-Based
- 9.1.2. Web- Based
- 9.2. Market Analysis, Insights and Forecast - by Enterprise Size
- 9.2.1. Small and Medium Enterprises (SMEs)
- 9.2.2. Large Enterprises
- 9.1. Market Analysis, Insights and Forecast - by Type
- 10. Middle East and Africa ServiceNow Store Apps Market Analysis, Insights and Forecast, 2019-2031
- 10.1. Market Analysis, Insights and Forecast - by Type
- 10.1.1. Cloud-Based
- 10.1.2. Web- Based
- 10.2. Market Analysis, Insights and Forecast - by Enterprise Size
- 10.2.1. Small and Medium Enterprises (SMEs)
- 10.2.2. Large Enterprises
- 10.1. Market Analysis, Insights and Forecast - by Type
- 11. North America ServiceNow Store Apps Market Analysis, Insights and Forecast, 2019-2031
- 11.1. Market Analysis, Insights and Forecast - By Country/Sub-region
- 11.1.1 United States
- 11.1.2 Canada
- 11.1.3 Mexico
- 12. Europe ServiceNow Store Apps Market Analysis, Insights and Forecast, 2019-2031
- 12.1. Market Analysis, Insights and Forecast - By Country/Sub-region
- 12.1.1 Germany
- 12.1.2 United Kingdom
- 12.1.3 France
- 12.1.4 Spain
- 12.1.5 Italy
- 12.1.6 Spain
- 12.1.7 Belgium
- 12.1.8 Netherland
- 12.1.9 Nordics
- 12.1.10 Rest of Europe
- 13. Asia Pacific ServiceNow Store Apps Market Analysis, Insights and Forecast, 2019-2031
- 13.1. Market Analysis, Insights and Forecast - By Country/Sub-region
- 13.1.1 China
- 13.1.2 Japan
- 13.1.3 India
- 13.1.4 South Korea
- 13.1.5 Southeast Asia
- 13.1.6 Australia
- 13.1.7 Indonesia
- 13.1.8 Phillipes
- 13.1.9 Singapore
- 13.1.10 Thailandc
- 13.1.11 Rest of Asia Pacific
- 14. South America ServiceNow Store Apps Market Analysis, Insights and Forecast, 2019-2031
- 14.1. Market Analysis, Insights and Forecast - By Country/Sub-region
- 14.1.1 Brazil
- 14.1.2 Argentina
- 14.1.3 Peru
- 14.1.4 Chile
- 14.1.5 Colombia
- 14.1.6 Ecuador
- 14.1.7 Venezuela
- 14.1.8 Rest of South America
- 15. North America ServiceNow Store Apps Market Analysis, Insights and Forecast, 2019-2031
- 15.1. Market Analysis, Insights and Forecast - By Country/Sub-region
- 15.1.1 United States
- 15.1.2 Canada
- 15.1.3 Mexico
- 16. MEA ServiceNow Store Apps Market Analysis, Insights and Forecast, 2019-2031
- 16.1. Market Analysis, Insights and Forecast - By Country/Sub-region
- 16.1.1 United Arab Emirates
- 16.1.2 Saudi Arabia
- 16.1.3 South Africa
- 16.1.4 Rest of Middle East and Africa
- 17. Competitive Analysis
- 17.1. Global Market Share Analysis 2024
- 17.2. Company Profiles
- 17.2.1 SAILPOINT TECHNOLOGIES INC
- 17.2.1.1. Overview
- 17.2.1.2. Products
- 17.2.1.3. SWOT Analysis
- 17.2.1.4. Recent Developments
- 17.2.1.5. Financials (Based on Availability)
- 17.2.2 IBM Corporation
- 17.2.2.1. Overview
- 17.2.2.2. Products
- 17.2.2.3. SWOT Analysis
- 17.2.2.4. Recent Developments
- 17.2.2.5. Financials (Based on Availability)
- 17.2.3 teamviewer
- 17.2.3.1. Overview
- 17.2.3.2. Products
- 17.2.3.3. SWOT Analysis
- 17.2.3.4. Recent Developments
- 17.2.3.5. Financials (Based on Availability)
- 17.2.4 PagerDuty
- 17.2.4.1. Overview
- 17.2.4.2. Products
- 17.2.4.3. SWOT Analysis
- 17.2.4.4. Recent Developments
- 17.2.4.5. Financials (Based on Availability)
- 17.2.5 Microsoft Corporation*List Not Exhaustive
- 17.2.5.1. Overview
- 17.2.5.2. Products
- 17.2.5.3. SWOT Analysis
- 17.2.5.4. Recent Developments
- 17.2.5.5. Financials (Based on Availability)
- 17.2.6 xMatters Inc
- 17.2.6.1. Overview
- 17.2.6.2. Products
- 17.2.6.3. SWOT Analysis
- 17.2.6.4. Recent Developments
- 17.2.6.5. Financials (Based on Availability)
- 17.2.7 Cisco Systems Inc
- 17.2.7.1. Overview
- 17.2.7.2. Products
- 17.2.7.3. SWOT Analysis
- 17.2.7.4. Recent Developments
- 17.2.7.5. Financials (Based on Availability)
- 17.2.8 Okta Inc
- 17.2.8.1. Overview
- 17.2.8.2. Products
- 17.2.8.3. SWOT Analysis
- 17.2.8.4. Recent Developments
- 17.2.8.5. Financials (Based on Availability)
- 17.2.9 Talkdesk Inc
- 17.2.9.1. Overview
- 17.2.9.2. Products
- 17.2.9.3. SWOT Analysis
- 17.2.9.4. Recent Developments
- 17.2.9.5. Financials (Based on Availability)
- 17.2.10 Dynatrace LLC
- 17.2.10.1. Overview
- 17.2.10.2. Products
- 17.2.10.3. SWOT Analysis
- 17.2.10.4. Recent Developments
- 17.2.10.5. Financials (Based on Availability)
- 17.2.1 SAILPOINT TECHNOLOGIES INC
List of Figures
- Figure 1: Global ServiceNow Store Apps Market Revenue Breakdown (Million, %) by Region 2024 & 2032
- Figure 2: North America ServiceNow Store Apps Market Revenue (Million), by Country 2024 & 2032
- Figure 3: North America ServiceNow Store Apps Market Revenue Share (%), by Country 2024 & 2032
- Figure 4: Europe ServiceNow Store Apps Market Revenue (Million), by Country 2024 & 2032
- Figure 5: Europe ServiceNow Store Apps Market Revenue Share (%), by Country 2024 & 2032
- Figure 6: Asia Pacific ServiceNow Store Apps Market Revenue (Million), by Country 2024 & 2032
- Figure 7: Asia Pacific ServiceNow Store Apps Market Revenue Share (%), by Country 2024 & 2032
- Figure 8: South America ServiceNow Store Apps Market Revenue (Million), by Country 2024 & 2032
- Figure 9: South America ServiceNow Store Apps Market Revenue Share (%), by Country 2024 & 2032
- Figure 10: North America ServiceNow Store Apps Market Revenue (Million), by Country 2024 & 2032
- Figure 11: North America ServiceNow Store Apps Market Revenue Share (%), by Country 2024 & 2032
- Figure 12: MEA ServiceNow Store Apps Market Revenue (Million), by Country 2024 & 2032
- Figure 13: MEA ServiceNow Store Apps Market Revenue Share (%), by Country 2024 & 2032
- Figure 14: North America ServiceNow Store Apps Market Revenue (Million), by Type 2024 & 2032
- Figure 15: North America ServiceNow Store Apps Market Revenue Share (%), by Type 2024 & 2032
- Figure 16: North America ServiceNow Store Apps Market Revenue (Million), by Enterprise Size 2024 & 2032
- Figure 17: North America ServiceNow Store Apps Market Revenue Share (%), by Enterprise Size 2024 & 2032
- Figure 18: North America ServiceNow Store Apps Market Revenue (Million), by Country 2024 & 2032
- Figure 19: North America ServiceNow Store Apps Market Revenue Share (%), by Country 2024 & 2032
- Figure 20: Europe ServiceNow Store Apps Market Revenue (Million), by Type 2024 & 2032
- Figure 21: Europe ServiceNow Store Apps Market Revenue Share (%), by Type 2024 & 2032
- Figure 22: Europe ServiceNow Store Apps Market Revenue (Million), by Enterprise Size 2024 & 2032
- Figure 23: Europe ServiceNow Store Apps Market Revenue Share (%), by Enterprise Size 2024 & 2032
- Figure 24: Europe ServiceNow Store Apps Market Revenue (Million), by Country 2024 & 2032
- Figure 25: Europe ServiceNow Store Apps Market Revenue Share (%), by Country 2024 & 2032
- Figure 26: Asia ServiceNow Store Apps Market Revenue (Million), by Type 2024 & 2032
- Figure 27: Asia ServiceNow Store Apps Market Revenue Share (%), by Type 2024 & 2032
- Figure 28: Asia ServiceNow Store Apps Market Revenue (Million), by Enterprise Size 2024 & 2032
- Figure 29: Asia ServiceNow Store Apps Market Revenue Share (%), by Enterprise Size 2024 & 2032
- Figure 30: Asia ServiceNow Store Apps Market Revenue (Million), by Country 2024 & 2032
- Figure 31: Asia ServiceNow Store Apps Market Revenue Share (%), by Country 2024 & 2032
- Figure 32: Latin America ServiceNow Store Apps Market Revenue (Million), by Type 2024 & 2032
- Figure 33: Latin America ServiceNow Store Apps Market Revenue Share (%), by Type 2024 & 2032
- Figure 34: Latin America ServiceNow Store Apps Market Revenue (Million), by Enterprise Size 2024 & 2032
- Figure 35: Latin America ServiceNow Store Apps Market Revenue Share (%), by Enterprise Size 2024 & 2032
- Figure 36: Latin America ServiceNow Store Apps Market Revenue (Million), by Country 2024 & 2032
- Figure 37: Latin America ServiceNow Store Apps Market Revenue Share (%), by Country 2024 & 2032
- Figure 38: Middle East and Africa ServiceNow Store Apps Market Revenue (Million), by Type 2024 & 2032
- Figure 39: Middle East and Africa ServiceNow Store Apps Market Revenue Share (%), by Type 2024 & 2032
- Figure 40: Middle East and Africa ServiceNow Store Apps Market Revenue (Million), by Enterprise Size 2024 & 2032
- Figure 41: Middle East and Africa ServiceNow Store Apps Market Revenue Share (%), by Enterprise Size 2024 & 2032
- Figure 42: Middle East and Africa ServiceNow Store Apps Market Revenue (Million), by Country 2024 & 2032
- Figure 43: Middle East and Africa ServiceNow Store Apps Market Revenue Share (%), by Country 2024 & 2032
List of Tables
- Table 1: Global ServiceNow Store Apps Market Revenue Million Forecast, by Region 2019 & 2032
- Table 2: Global ServiceNow Store Apps Market Revenue Million Forecast, by Type 2019 & 2032
- Table 3: Global ServiceNow Store Apps Market Revenue Million Forecast, by Enterprise Size 2019 & 2032
- Table 4: Global ServiceNow Store Apps Market Revenue Million Forecast, by Region 2019 & 2032
- Table 5: Global ServiceNow Store Apps Market Revenue Million Forecast, by Country 2019 & 2032
- Table 6: United States ServiceNow Store Apps Market Revenue (Million) Forecast, by Application 2019 & 2032
- Table 7: Canada ServiceNow Store Apps Market Revenue (Million) Forecast, by Application 2019 & 2032
- Table 8: Mexico ServiceNow Store Apps Market Revenue (Million) Forecast, by Application 2019 & 2032
- Table 9: Global ServiceNow Store Apps Market Revenue Million Forecast, by Country 2019 & 2032
- Table 10: Germany ServiceNow Store Apps Market Revenue (Million) Forecast, by Application 2019 & 2032
- Table 11: United Kingdom ServiceNow Store Apps Market Revenue (Million) Forecast, by Application 2019 & 2032
- Table 12: France ServiceNow Store Apps Market Revenue (Million) Forecast, by Application 2019 & 2032
- Table 13: Spain ServiceNow Store Apps Market Revenue (Million) Forecast, by Application 2019 & 2032
- Table 14: Italy ServiceNow Store Apps Market Revenue (Million) Forecast, by Application 2019 & 2032
- Table 15: Spain ServiceNow Store Apps Market Revenue (Million) Forecast, by Application 2019 & 2032
- Table 16: Belgium ServiceNow Store Apps Market Revenue (Million) Forecast, by Application 2019 & 2032
- Table 17: Netherland ServiceNow Store Apps Market Revenue (Million) Forecast, by Application 2019 & 2032
- Table 18: Nordics ServiceNow Store Apps Market Revenue (Million) Forecast, by Application 2019 & 2032
- Table 19: Rest of Europe ServiceNow Store Apps Market Revenue (Million) Forecast, by Application 2019 & 2032
- Table 20: Global ServiceNow Store Apps Market Revenue Million Forecast, by Country 2019 & 2032
- Table 21: China ServiceNow Store Apps Market Revenue (Million) Forecast, by Application 2019 & 2032
- Table 22: Japan ServiceNow Store Apps Market Revenue (Million) Forecast, by Application 2019 & 2032
- Table 23: India ServiceNow Store Apps Market Revenue (Million) Forecast, by Application 2019 & 2032
- Table 24: South Korea ServiceNow Store Apps Market Revenue (Million) Forecast, by Application 2019 & 2032
- Table 25: Southeast Asia ServiceNow Store Apps Market Revenue (Million) Forecast, by Application 2019 & 2032
- Table 26: Australia ServiceNow Store Apps Market Revenue (Million) Forecast, by Application 2019 & 2032
- Table 27: Indonesia ServiceNow Store Apps Market Revenue (Million) Forecast, by Application 2019 & 2032
- Table 28: Phillipes ServiceNow Store Apps Market Revenue (Million) Forecast, by Application 2019 & 2032
- Table 29: Singapore ServiceNow Store Apps Market Revenue (Million) Forecast, by Application 2019 & 2032
- Table 30: Thailandc ServiceNow Store Apps Market Revenue (Million) Forecast, by Application 2019 & 2032
- Table 31: Rest of Asia Pacific ServiceNow Store Apps Market Revenue (Million) Forecast, by Application 2019 & 2032
- Table 32: Global ServiceNow Store Apps Market Revenue Million Forecast, by Country 2019 & 2032
- Table 33: Brazil ServiceNow Store Apps Market Revenue (Million) Forecast, by Application 2019 & 2032
- Table 34: Argentina ServiceNow Store Apps Market Revenue (Million) Forecast, by Application 2019 & 2032
- Table 35: Peru ServiceNow Store Apps Market Revenue (Million) Forecast, by Application 2019 & 2032
- Table 36: Chile ServiceNow Store Apps Market Revenue (Million) Forecast, by Application 2019 & 2032
- Table 37: Colombia ServiceNow Store Apps Market Revenue (Million) Forecast, by Application 2019 & 2032
- Table 38: Ecuador ServiceNow Store Apps Market Revenue (Million) Forecast, by Application 2019 & 2032
- Table 39: Venezuela ServiceNow Store Apps Market Revenue (Million) Forecast, by Application 2019 & 2032
- Table 40: Rest of South America ServiceNow Store Apps Market Revenue (Million) Forecast, by Application 2019 & 2032
- Table 41: Global ServiceNow Store Apps Market Revenue Million Forecast, by Country 2019 & 2032
- Table 42: United States ServiceNow Store Apps Market Revenue (Million) Forecast, by Application 2019 & 2032
- Table 43: Canada ServiceNow Store Apps Market Revenue (Million) Forecast, by Application 2019 & 2032
- Table 44: Mexico ServiceNow Store Apps Market Revenue (Million) Forecast, by Application 2019 & 2032
- Table 45: Global ServiceNow Store Apps Market Revenue Million Forecast, by Country 2019 & 2032
- Table 46: United Arab Emirates ServiceNow Store Apps Market Revenue (Million) Forecast, by Application 2019 & 2032
- Table 47: Saudi Arabia ServiceNow Store Apps Market Revenue (Million) Forecast, by Application 2019 & 2032
- Table 48: South Africa ServiceNow Store Apps Market Revenue (Million) Forecast, by Application 2019 & 2032
- Table 49: Rest of Middle East and Africa ServiceNow Store Apps Market Revenue (Million) Forecast, by Application 2019 & 2032
- Table 50: Global ServiceNow Store Apps Market Revenue Million Forecast, by Type 2019 & 2032
- Table 51: Global ServiceNow Store Apps Market Revenue Million Forecast, by Enterprise Size 2019 & 2032
- Table 52: Global ServiceNow Store Apps Market Revenue Million Forecast, by Country 2019 & 2032
- Table 53: Global ServiceNow Store Apps Market Revenue Million Forecast, by Type 2019 & 2032
- Table 54: Global ServiceNow Store Apps Market Revenue Million Forecast, by Enterprise Size 2019 & 2032
- Table 55: Global ServiceNow Store Apps Market Revenue Million Forecast, by Country 2019 & 2032
- Table 56: Global ServiceNow Store Apps Market Revenue Million Forecast, by Type 2019 & 2032
- Table 57: Global ServiceNow Store Apps Market Revenue Million Forecast, by Enterprise Size 2019 & 2032
- Table 58: Global ServiceNow Store Apps Market Revenue Million Forecast, by Country 2019 & 2032
- Table 59: Global ServiceNow Store Apps Market Revenue Million Forecast, by Type 2019 & 2032
- Table 60: Global ServiceNow Store Apps Market Revenue Million Forecast, by Enterprise Size 2019 & 2032
- Table 61: Global ServiceNow Store Apps Market Revenue Million Forecast, by Country 2019 & 2032
- Table 62: Global ServiceNow Store Apps Market Revenue Million Forecast, by Type 2019 & 2032
- Table 63: Global ServiceNow Store Apps Market Revenue Million Forecast, by Enterprise Size 2019 & 2032
- Table 64: Global ServiceNow Store Apps Market Revenue Million Forecast, by Country 2019 & 2032
Frequently Asked Questions
1. What is the projected Compound Annual Growth Rate (CAGR) of the ServiceNow Store Apps Market?
The projected CAGR is approximately 32.73%.
2. Which companies are prominent players in the ServiceNow Store Apps Market?
Key companies in the market include SAILPOINT TECHNOLOGIES INC, IBM Corporation, teamviewer, PagerDuty, Microsoft Corporation*List Not Exhaustive, xMatters Inc, Cisco Systems Inc, Okta Inc, Talkdesk Inc, Dynatrace LLC.
3. What are the main segments of the ServiceNow Store Apps Market?
The market segments include Type, Enterprise Size.
4. Can you provide details about the market size?
The market size is estimated to be USD XX Million as of 2022.
5. What are some drivers contributing to market growth?
Rise in adoption of cloud services and cloud computing; Rise in digital platforms and adoption of advance technologies.
6. What are the notable trends driving market growth?
Cloud-Based is Expected to Hold Significant Share of the Market.
7. Are there any restraints impacting market growth?
High upfront and licensing costs.
8. Can you provide examples of recent developments in the market?
May 2023: xtype, the renowned agile software delivery company, announced the launch of xtype View, an innovative multi-instance viewer and platform engineering dashboard exclusively designed for ServiceNow professionals. As the inaugural real-time, multi-instance dashboard tailored specifically for ServiceNow experts, xtype View offers a comprehensive solution to effortlessly monitor all plugins and applications within their ServiceNow ecosystem from a single unified interface. xtype View is available free of charge and is poised to significantly mitigate the challenges associated with configuration discrepancies, ultimately enhancing the ServiceNow experience.
9. What pricing options are available for accessing the report?
Pricing options include single-user, multi-user, and enterprise licenses priced at USD 4750, USD 5250, and USD 8750 respectively.
10. Is the market size provided in terms of value or volume?
The market size is provided in terms of value, measured in Million.
11. Are there any specific market keywords associated with the report?
Yes, the market keyword associated with the report is "ServiceNow Store Apps Market," which aids in identifying and referencing the specific market segment covered.
12. How do I determine which pricing option suits my needs best?
The pricing options vary based on user requirements and access needs. Individual users may opt for single-user licenses, while businesses requiring broader access may choose multi-user or enterprise licenses for cost-effective access to the report.
13. Are there any additional resources or data provided in the ServiceNow Store Apps Market report?
While the report offers comprehensive insights, it's advisable to review the specific contents or supplementary materials provided to ascertain if additional resources or data are available.
14. How can I stay updated on further developments or reports in the ServiceNow Store Apps Market?
To stay informed about further developments, trends, and reports in the ServiceNow Store Apps Market, consider subscribing to industry newsletters, following relevant companies and organizations, or regularly checking reputable industry news sources and publications.
Methodology
Step 1 - Identification of Relevant Samples Size from Population Database


Step 2 - Approaches for Defining Global Market Size (Value, Volume* & Price*)

Note*: In applicable scenarios
Step 3 - Data Sources
Primary Research
- Web Analytics
- Survey Reports
- Research Institute
- Latest Research Reports
- Opinion Leaders
Secondary Research
- Annual Reports
- White Paper
- Latest Press Release
- Industry Association
- Paid Database
- Investor Presentations

Step 4 - Data Triangulation
Involves using different sources of information in order to increase the validity of a study
These sources are likely to be stakeholders in a program - participants, other researchers, program staff, other community members, and so on.
Then we put all data in single framework & apply various statistical tools to find out the dynamic on the market.
During the analysis stage, feedback from the stakeholder groups would be compared to determine areas of agreement as well as areas of divergence


