


Key Insights
The Sell-Side Platform (SSP) market is poised for significant expansion, projected to reach $12.66 billion by 2033, with a Compound Annual Growth Rate (CAGR) of 9.95% from a base year of 2025. This growth is propelled by the escalating demand for programmatic advertising and publishers' imperative to maximize ad revenue. Key growth catalysts include the widespread adoption of mobile and Connected TV (CTV) advertising, alongside advancements in programmatic technology. Publishers are increasingly utilizing SSPs to broaden demand sources, enhance yield optimization, and simplify ad operations. Market dynamics are further influenced by trends such as header bidding, which fosters buyer competition and boosts publisher earnings, and the growing reliance on data-driven targeting for campaign efficacy. Despite challenges like ad fraud and the programmatic ecosystem's complexity, the outlook remains strong.
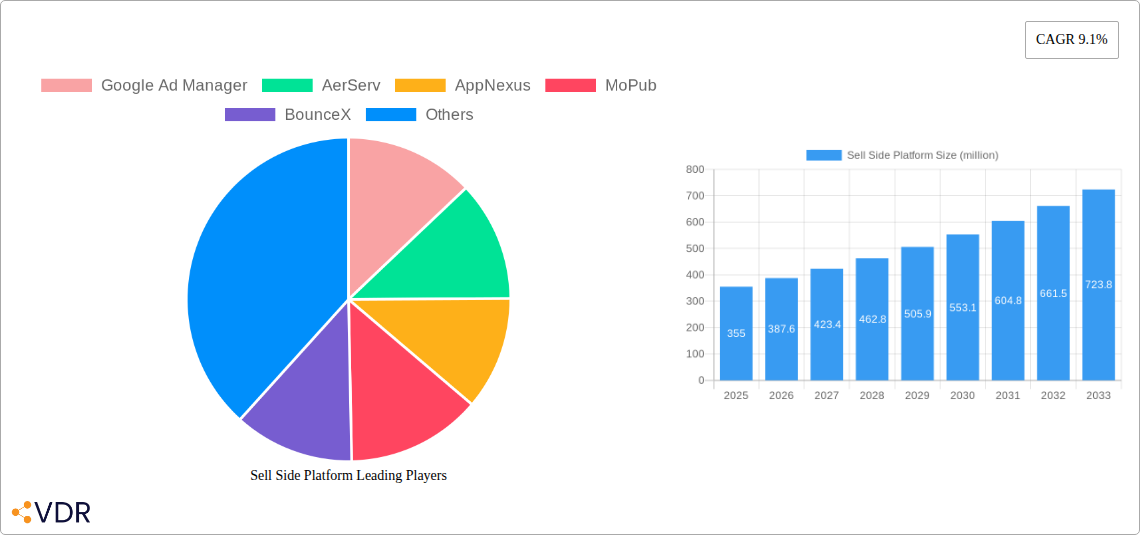
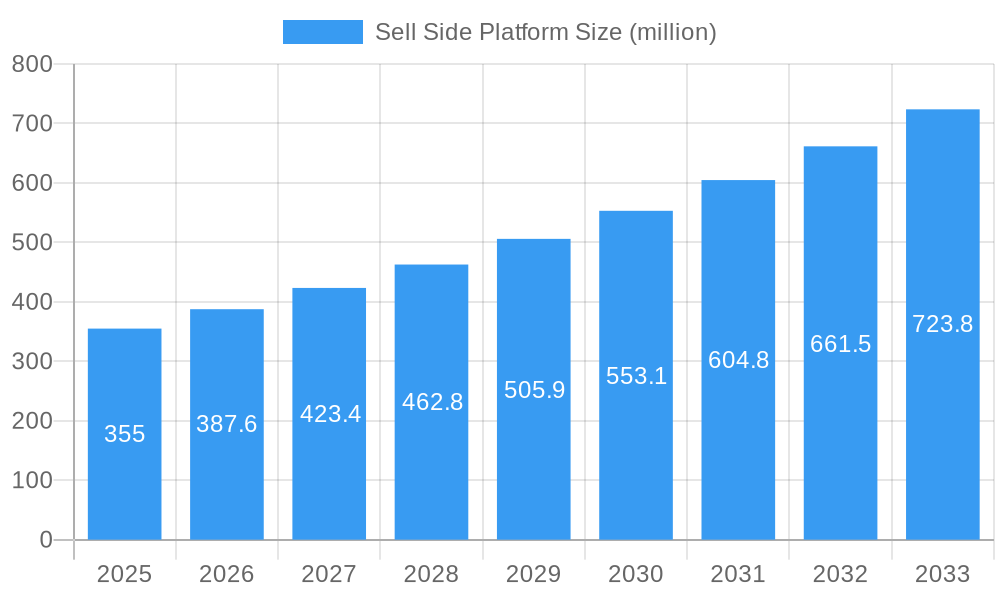
Sell Side Platform Market Size (In Billion)

The competitive environment features established leaders and innovative entrants, fostering continuous improvement in SSP features. Strategic priorities include advancing header bidding, integrating sophisticated analytics, and supporting diverse ad formats. SSP providers are also prioritizing integrations with complementary ad tech solutions and implementing advanced fraud detection. Geographic expansion into emerging markets with rising internet penetration is a key strategic focus. Mergers, acquisitions, and strategic alliances signal industry consolidation and the drive to offer end-to-end programmatic advertising solutions for publishers. The future trajectory will be significantly shaped by the integration of advanced technologies like AI and machine learning for enhanced ad targeting and yield management.
Sell Side Platform Company Market Share
Sell Side Platform Market Report: 2019-2033
This comprehensive report provides an in-depth analysis of the Sell Side Platform (SSP) market, encompassing market dynamics, growth trends, regional dominance, product landscape, key players, and future outlook. The study period spans from 2019 to 2033, with a base year of 2025 and a forecast period from 2025 to 2033. This report is crucial for industry professionals, investors, and businesses seeking to understand and capitalize on the evolving SSP landscape. The report incorporates data in million units where applicable.
Sell Side Platform Market Dynamics & Structure
The SSP market, a crucial component of the broader programmatic advertising ecosystem (parent market), is characterized by a dynamic interplay of technological innovation, regulatory changes, and intense competition. While the parent market shows significant growth, the child market of SSPs is experiencing consolidation, with larger players acquiring smaller firms. The market is characterized by both horizontal and vertical integration, with some SSPs offering comprehensive solutions and others specializing in niche segments such as mobile or video advertising.
Market Concentration: The market shows a moderate concentration, with a few major players holding significant market share, but also a large number of smaller niche players. The top 5 players in 2025 are estimated to hold approximately xx% of the market share.
Technological Innovation: Innovation is driven by the need for improved targeting, real-time bidding (RTB) optimization, and increased transparency and control for publishers. However, interoperability challenges and maintaining data privacy remain significant barriers to widespread adoption of innovative technologies.
Regulatory Frameworks: GDPR, CCPA, and other privacy regulations are significantly shaping the market, influencing data handling practices and requiring increased transparency. This impacts both the technical capabilities and revenue models of SSPs.
Competitive Product Substitutes: While direct substitutes are limited, publishers can opt for direct sales strategies or utilize alternative ad management systems. This limits the market share of SSPs which are unable to innovate.
End-User Demographics: The key end-users are publishers of all sizes, from large media companies to independent bloggers. The increasing demand for programmatic solutions fuels the SSP market growth.
M&A Trends: Significant M&A activity has been observed in recent years, driven by larger companies seeking to expand their market share and capabilities. The total M&A deal volume in the historical period (2019-2024) is estimated at xx million USD.
Sell Side Platform Growth Trends & Insights
The SSP market experienced robust growth during the historical period (2019-2024), driven primarily by the increasing adoption of programmatic advertising by publishers. The market size grew from xx million in 2019 to xx million in 2024, representing a CAGR of xx%. This trend is projected to continue during the forecast period (2025-2033), with the market size expected to reach xx million by 2033, showcasing a CAGR of xx%. This growth is fueled by the increasing demand for automated ad sales, improved efficiency in ad operations, and enhanced monetization strategies for publishers. Technological advancements such as header bidding and server-side ad insertion are further driving market expansion. Changes in consumer behavior, especially a shift towards mobile and video consumption, are also key factors driving market expansion. Increasing focus on data privacy and transparency is expected to lead to a re-evaluation of certain practices and the emergence of innovative solutions.
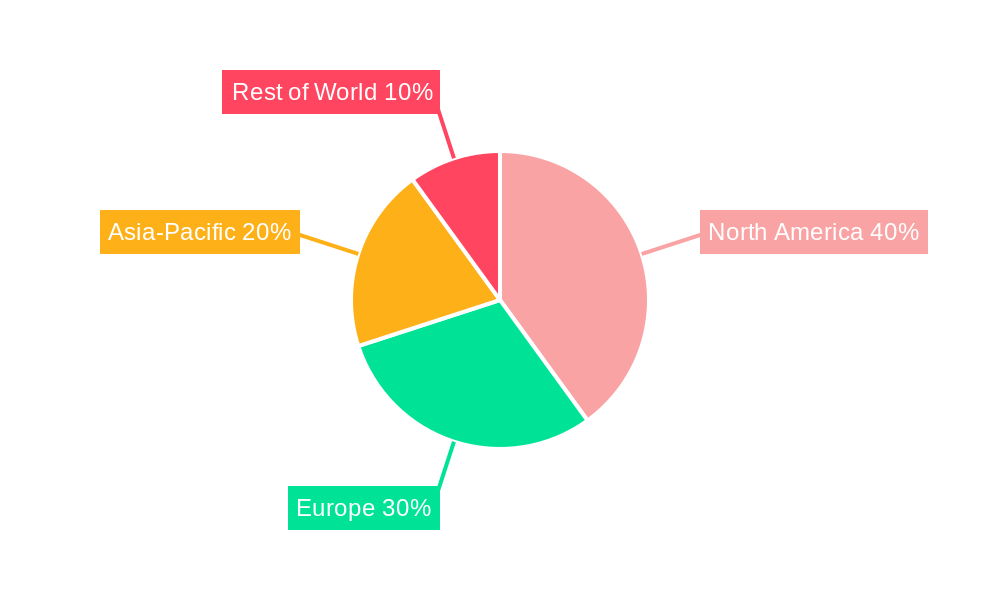
Dominant Regions, Countries, or Segments in Sell Side Platform
North America currently holds the largest market share in the SSP market, driven by high digital advertising spending and the presence of major technology companies. However, the Asia-Pacific region is expected to witness the fastest growth during the forecast period.
Key Drivers for North America:
- High digital advertising spending.
- Advanced technological infrastructure.
- Presence of major SSP providers.
- Strong regulatory framework in place.
Key Drivers for Asia-Pacific:
- Rapid growth of the internet and mobile penetration.
- Increasing adoption of programmatic advertising.
- Favorable government policies promoting digitalization.
Market Share & Growth Potential: While North America maintains a significant market share (xx%), the Asia-Pacific region is projected to experience a higher CAGR (xx%) during the forecast period, potentially closing the gap in the future. Europe also holds a substantial market share, largely influenced by the strict data privacy regulations.
Sell Side Platform Product Landscape
SSPs offer a range of features, including real-time bidding (RTB), header bidding, private marketplaces (PMPs), and advanced analytics dashboards. Innovation is focused on improving yield optimization, enhancing reporting capabilities, and integrating with other ad tech solutions for seamless workflows. Key selling propositions include ease of use, superior yield generation, and granular control over ad inventory. Technological advancements are continuously enhancing the speed and efficiency of ad serving, while also prioritizing data privacy and compliance with relevant regulations.
Key Drivers, Barriers & Challenges in Sell Side Platform
Key Drivers:
The increasing adoption of programmatic advertising by publishers is the primary driver. This is further complemented by the growing demand for efficient ad monetization strategies and the need for advanced analytics tools for better campaign performance. The rise of mobile and video advertising also presents significant growth opportunities.
Key Challenges and Restraints:
The market faces challenges related to data privacy regulations (GDPR, CCPA), increasing competition among SSP providers, and the complexities of integrating with various ad exchanges and demand-side platforms (DSPs). These challenges result in increased operational costs and a need for continuous adaptation. The market is also prone to fraudulent activities and ensuring ad quality poses further challenges. Supply chain disruptions can impact the availability of ad inventory, thus hindering the growth of SSP market.
Emerging Opportunities in Sell Side Platform
Emerging opportunities lie in the expansion into new markets, particularly in developing economies, and in the adoption of advanced technologies such as artificial intelligence (AI) and machine learning (ML) for improved yield optimization and fraud detection. Furthermore, the growing demand for privacy-preserving solutions and the increasing focus on contextual advertising present new avenues for growth. The integration of SSPs with other ad tech solutions (such as CMS and CRM) creates seamless operations and further monetization for publishers.
Growth Accelerators in the Sell Side Platform Industry
The long-term growth of the SSP market will be significantly influenced by technological advancements such as AI-powered optimization and blockchain-based solutions to enhance transparency and security. Strategic partnerships between SSPs and other ad tech companies will streamline workflows and expand access to ad inventory. Expanding into new geographical markets and broadening the range of supported ad formats will further accelerate market growth.
Key Players Shaping the Sell Side Platform Market
- Google Ad Manager
- AerServ
- AppNexus
- MoPub
- BounceX
- OpenX
- RhthymOne
- Rubicon Project
- PubMatic
- ONE by AOL
- Insticator
- 360 Polaris
- Smart AdServer
- Operative.One
- AdBook
- Admixer.SSP
- SmartyAds
- Naviga Ad
Notable Milestones in Sell Side Platform Sector
- 2020, Q3: Google Ad Manager integrates header bidding capabilities, significantly boosting publisher yield.
- 2021, Q1: Rubicon Project acquires a smaller SSP, expanding its market share and capabilities.
- 2022, Q4: New privacy regulations come into effect, influencing the strategies of all key players.
- 2023, Q2: Several key players launch AI-driven yield optimization tools.
- 2024, Q1: A major SSP integrates blockchain technology to increase ad inventory transparency.
In-Depth Sell Side Platform Market Outlook
The future of the SSP market is bright, driven by ongoing technological advancements, increasing demand for programmatic advertising, and the continuous expansion into new markets. Strategic partnerships and acquisitions will continue shaping the market landscape. The focus on data privacy and transparency will further drive innovation and reshape business models. The adoption of AI and ML will revolutionize yield optimization, fraud detection, and targeting, leading to greater efficiency and revenue generation for publishers. This ultimately strengthens the value proposition for publishers and encourages further growth within this dynamic segment of the advertising technology ecosystem.
Sell Side Platform Segmentation
-
1. Application
- 1.1. Large Enterprises
- 1.2. SMEs
-
2. Types
- 2.1. Cloud Based
- 2.2. Web Based
Sell Side Platform Segmentation By Geography
-
1. North America
- 1.1. United States
- 1.2. Canada
- 1.3. Mexico
-
2. South America
- 2.1. Brazil
- 2.2. Argentina
- 2.3. Rest of South America
-
3. Europe
- 3.1. United Kingdom
- 3.2. Germany
- 3.3. France
- 3.4. Italy
- 3.5. Spain
- 3.6. Russia
- 3.7. Benelux
- 3.8. Nordics
- 3.9. Rest of Europe
-
4. Middle East & Africa
- 4.1. Turkey
- 4.2. Israel
- 4.3. GCC
- 4.4. North Africa
- 4.5. South Africa
- 4.6. Rest of Middle East & Africa
-
5. Asia Pacific
- 5.1. China
- 5.2. India
- 5.3. Japan
- 5.4. South Korea
- 5.5. ASEAN
- 5.6. Oceania
- 5.7. Rest of Asia Pacific
Sell Side Platform Regional Market Share
Geographic Coverage of Sell Side Platform
Sell Side Platform REPORT HIGHLIGHTS
| Aspects | Details |
|---|---|
| Study Period | 2020-2034 |
| Base Year | 2025 |
| Estimated Year | 2026 |
| Forecast Period | 2026-2034 |
| Historical Period | 2020-2025 |
| Growth Rate | CAGR of 9.95% from 2020-2034 |
| Segmentation |
|
Table of Contents
- 1. Introduction
- 1.1. Research Scope
- 1.2. Market Segmentation
- 1.3. Research Methodology
- 1.4. Definitions and Assumptions
- 2. Executive Summary
- 2.1. Introduction
- 3. Market Dynamics
- 3.1. Introduction
- 3.2. Market Drivers
- 3.3. Market Restrains
- 3.4. Market Trends
- 4. Market Factor Analysis
- 4.1. Porters Five Forces
- 4.2. Supply/Value Chain
- 4.3. PESTEL analysis
- 4.4. Market Entropy
- 4.5. Patent/Trademark Analysis
- 5. Global Sell Side Platform Analysis, Insights and Forecast, 2020-2032
- 5.1. Market Analysis, Insights and Forecast - by Application
- 5.1.1. Large Enterprises
- 5.1.2. SMEs
- 5.2. Market Analysis, Insights and Forecast - by Types
- 5.2.1. Cloud Based
- 5.2.2. Web Based
- 5.3. Market Analysis, Insights and Forecast - by Region
- 5.3.1. North America
- 5.3.2. South America
- 5.3.3. Europe
- 5.3.4. Middle East & Africa
- 5.3.5. Asia Pacific
- 5.1. Market Analysis, Insights and Forecast - by Application
- 6. North America Sell Side Platform Analysis, Insights and Forecast, 2020-2032
- 6.1. Market Analysis, Insights and Forecast - by Application
- 6.1.1. Large Enterprises
- 6.1.2. SMEs
- 6.2. Market Analysis, Insights and Forecast - by Types
- 6.2.1. Cloud Based
- 6.2.2. Web Based
- 6.1. Market Analysis, Insights and Forecast - by Application
- 7. South America Sell Side Platform Analysis, Insights and Forecast, 2020-2032
- 7.1. Market Analysis, Insights and Forecast - by Application
- 7.1.1. Large Enterprises
- 7.1.2. SMEs
- 7.2. Market Analysis, Insights and Forecast - by Types
- 7.2.1. Cloud Based
- 7.2.2. Web Based
- 7.1. Market Analysis, Insights and Forecast - by Application
- 8. Europe Sell Side Platform Analysis, Insights and Forecast, 2020-2032
- 8.1. Market Analysis, Insights and Forecast - by Application
- 8.1.1. Large Enterprises
- 8.1.2. SMEs
- 8.2. Market Analysis, Insights and Forecast - by Types
- 8.2.1. Cloud Based
- 8.2.2. Web Based
- 8.1. Market Analysis, Insights and Forecast - by Application
- 9. Middle East & Africa Sell Side Platform Analysis, Insights and Forecast, 2020-2032
- 9.1. Market Analysis, Insights and Forecast - by Application
- 9.1.1. Large Enterprises
- 9.1.2. SMEs
- 9.2. Market Analysis, Insights and Forecast - by Types
- 9.2.1. Cloud Based
- 9.2.2. Web Based
- 9.1. Market Analysis, Insights and Forecast - by Application
- 10. Asia Pacific Sell Side Platform Analysis, Insights and Forecast, 2020-2032
- 10.1. Market Analysis, Insights and Forecast - by Application
- 10.1.1. Large Enterprises
- 10.1.2. SMEs
- 10.2. Market Analysis, Insights and Forecast - by Types
- 10.2.1. Cloud Based
- 10.2.2. Web Based
- 10.1. Market Analysis, Insights and Forecast - by Application
- 11. Competitive Analysis
- 11.1. Global Market Share Analysis 2025
- 11.2. Company Profiles
- 11.2.1 Google Ad Manager
- 11.2.1.1. Overview
- 11.2.1.2. Products
- 11.2.1.3. SWOT Analysis
- 11.2.1.4. Recent Developments
- 11.2.1.5. Financials (Based on Availability)
- 11.2.2 AerServ
- 11.2.2.1. Overview
- 11.2.2.2. Products
- 11.2.2.3. SWOT Analysis
- 11.2.2.4. Recent Developments
- 11.2.2.5. Financials (Based on Availability)
- 11.2.3 AppNexus
- 11.2.3.1. Overview
- 11.2.3.2. Products
- 11.2.3.3. SWOT Analysis
- 11.2.3.4. Recent Developments
- 11.2.3.5. Financials (Based on Availability)
- 11.2.4 MoPub
- 11.2.4.1. Overview
- 11.2.4.2. Products
- 11.2.4.3. SWOT Analysis
- 11.2.4.4. Recent Developments
- 11.2.4.5. Financials (Based on Availability)
- 11.2.5 BounceX
- 11.2.5.1. Overview
- 11.2.5.2. Products
- 11.2.5.3. SWOT Analysis
- 11.2.5.4. Recent Developments
- 11.2.5.5. Financials (Based on Availability)
- 11.2.6 OpenX
- 11.2.6.1. Overview
- 11.2.6.2. Products
- 11.2.6.3. SWOT Analysis
- 11.2.6.4. Recent Developments
- 11.2.6.5. Financials (Based on Availability)
- 11.2.7 RhthymOne
- 11.2.7.1. Overview
- 11.2.7.2. Products
- 11.2.7.3. SWOT Analysis
- 11.2.7.4. Recent Developments
- 11.2.7.5. Financials (Based on Availability)
- 11.2.8 Rubicon Project
- 11.2.8.1. Overview
- 11.2.8.2. Products
- 11.2.8.3. SWOT Analysis
- 11.2.8.4. Recent Developments
- 11.2.8.5. Financials (Based on Availability)
- 11.2.9 PubMatic
- 11.2.9.1. Overview
- 11.2.9.2. Products
- 11.2.9.3. SWOT Analysis
- 11.2.9.4. Recent Developments
- 11.2.9.5. Financials (Based on Availability)
- 11.2.10 ONE by AOL
- 11.2.10.1. Overview
- 11.2.10.2. Products
- 11.2.10.3. SWOT Analysis
- 11.2.10.4. Recent Developments
- 11.2.10.5. Financials (Based on Availability)
- 11.2.11 Insticator
- 11.2.11.1. Overview
- 11.2.11.2. Products
- 11.2.11.3. SWOT Analysis
- 11.2.11.4. Recent Developments
- 11.2.11.5. Financials (Based on Availability)
- 11.2.12 360 Polaris
- 11.2.12.1. Overview
- 11.2.12.2. Products
- 11.2.12.3. SWOT Analysis
- 11.2.12.4. Recent Developments
- 11.2.12.5. Financials (Based on Availability)
- 11.2.13 Smart AdServer
- 11.2.13.1. Overview
- 11.2.13.2. Products
- 11.2.13.3. SWOT Analysis
- 11.2.13.4. Recent Developments
- 11.2.13.5. Financials (Based on Availability)
- 11.2.14 Operative.One
- 11.2.14.1. Overview
- 11.2.14.2. Products
- 11.2.14.3. SWOT Analysis
- 11.2.14.4. Recent Developments
- 11.2.14.5. Financials (Based on Availability)
- 11.2.15 AdBook
- 11.2.15.1. Overview
- 11.2.15.2. Products
- 11.2.15.3. SWOT Analysis
- 11.2.15.4. Recent Developments
- 11.2.15.5. Financials (Based on Availability)
- 11.2.16 Admixer.SSP
- 11.2.16.1. Overview
- 11.2.16.2. Products
- 11.2.16.3. SWOT Analysis
- 11.2.16.4. Recent Developments
- 11.2.16.5. Financials (Based on Availability)
- 11.2.17 SmartyAds
- 11.2.17.1. Overview
- 11.2.17.2. Products
- 11.2.17.3. SWOT Analysis
- 11.2.17.4. Recent Developments
- 11.2.17.5. Financials (Based on Availability)
- 11.2.18 Naviga Ad
- 11.2.18.1. Overview
- 11.2.18.2. Products
- 11.2.18.3. SWOT Analysis
- 11.2.18.4. Recent Developments
- 11.2.18.5. Financials (Based on Availability)
- 11.2.1 Google Ad Manager
List of Figures
- Figure 1: Global Sell Side Platform Revenue Breakdown (billion, %) by Region 2025 & 2033
- Figure 2: North America Sell Side Platform Revenue (billion), by Application 2025 & 2033
- Figure 3: North America Sell Side Platform Revenue Share (%), by Application 2025 & 2033
- Figure 4: North America Sell Side Platform Revenue (billion), by Types 2025 & 2033
- Figure 5: North America Sell Side Platform Revenue Share (%), by Types 2025 & 2033
- Figure 6: North America Sell Side Platform Revenue (billion), by Country 2025 & 2033
- Figure 7: North America Sell Side Platform Revenue Share (%), by Country 2025 & 2033
- Figure 8: South America Sell Side Platform Revenue (billion), by Application 2025 & 2033
- Figure 9: South America Sell Side Platform Revenue Share (%), by Application 2025 & 2033
- Figure 10: South America Sell Side Platform Revenue (billion), by Types 2025 & 2033
- Figure 11: South America Sell Side Platform Revenue Share (%), by Types 2025 & 2033
- Figure 12: South America Sell Side Platform Revenue (billion), by Country 2025 & 2033
- Figure 13: South America Sell Side Platform Revenue Share (%), by Country 2025 & 2033
- Figure 14: Europe Sell Side Platform Revenue (billion), by Application 2025 & 2033
- Figure 15: Europe Sell Side Platform Revenue Share (%), by Application 2025 & 2033
- Figure 16: Europe Sell Side Platform Revenue (billion), by Types 2025 & 2033
- Figure 17: Europe Sell Side Platform Revenue Share (%), by Types 2025 & 2033
- Figure 18: Europe Sell Side Platform Revenue (billion), by Country 2025 & 2033
- Figure 19: Europe Sell Side Platform Revenue Share (%), by Country 2025 & 2033
- Figure 20: Middle East & Africa Sell Side Platform Revenue (billion), by Application 2025 & 2033
- Figure 21: Middle East & Africa Sell Side Platform Revenue Share (%), by Application 2025 & 2033
- Figure 22: Middle East & Africa Sell Side Platform Revenue (billion), by Types 2025 & 2033
- Figure 23: Middle East & Africa Sell Side Platform Revenue Share (%), by Types 2025 & 2033
- Figure 24: Middle East & Africa Sell Side Platform Revenue (billion), by Country 2025 & 2033
- Figure 25: Middle East & Africa Sell Side Platform Revenue Share (%), by Country 2025 & 2033
- Figure 26: Asia Pacific Sell Side Platform Revenue (billion), by Application 2025 & 2033
- Figure 27: Asia Pacific Sell Side Platform Revenue Share (%), by Application 2025 & 2033
- Figure 28: Asia Pacific Sell Side Platform Revenue (billion), by Types 2025 & 2033
- Figure 29: Asia Pacific Sell Side Platform Revenue Share (%), by Types 2025 & 2033
- Figure 30: Asia Pacific Sell Side Platform Revenue (billion), by Country 2025 & 2033
- Figure 31: Asia Pacific Sell Side Platform Revenue Share (%), by Country 2025 & 2033
List of Tables
- Table 1: Global Sell Side Platform Revenue billion Forecast, by Application 2020 & 2033
- Table 2: Global Sell Side Platform Revenue billion Forecast, by Types 2020 & 2033
- Table 3: Global Sell Side Platform Revenue billion Forecast, by Region 2020 & 2033
- Table 4: Global Sell Side Platform Revenue billion Forecast, by Application 2020 & 2033
- Table 5: Global Sell Side Platform Revenue billion Forecast, by Types 2020 & 2033
- Table 6: Global Sell Side Platform Revenue billion Forecast, by Country 2020 & 2033
- Table 7: United States Sell Side Platform Revenue (billion) Forecast, by Application 2020 & 2033
- Table 8: Canada Sell Side Platform Revenue (billion) Forecast, by Application 2020 & 2033
- Table 9: Mexico Sell Side Platform Revenue (billion) Forecast, by Application 2020 & 2033
- Table 10: Global Sell Side Platform Revenue billion Forecast, by Application 2020 & 2033
- Table 11: Global Sell Side Platform Revenue billion Forecast, by Types 2020 & 2033
- Table 12: Global Sell Side Platform Revenue billion Forecast, by Country 2020 & 2033
- Table 13: Brazil Sell Side Platform Revenue (billion) Forecast, by Application 2020 & 2033
- Table 14: Argentina Sell Side Platform Revenue (billion) Forecast, by Application 2020 & 2033
- Table 15: Rest of South America Sell Side Platform Revenue (billion) Forecast, by Application 2020 & 2033
- Table 16: Global Sell Side Platform Revenue billion Forecast, by Application 2020 & 2033
- Table 17: Global Sell Side Platform Revenue billion Forecast, by Types 2020 & 2033
- Table 18: Global Sell Side Platform Revenue billion Forecast, by Country 2020 & 2033
- Table 19: United Kingdom Sell Side Platform Revenue (billion) Forecast, by Application 2020 & 2033
- Table 20: Germany Sell Side Platform Revenue (billion) Forecast, by Application 2020 & 2033
- Table 21: France Sell Side Platform Revenue (billion) Forecast, by Application 2020 & 2033
- Table 22: Italy Sell Side Platform Revenue (billion) Forecast, by Application 2020 & 2033
- Table 23: Spain Sell Side Platform Revenue (billion) Forecast, by Application 2020 & 2033
- Table 24: Russia Sell Side Platform Revenue (billion) Forecast, by Application 2020 & 2033
- Table 25: Benelux Sell Side Platform Revenue (billion) Forecast, by Application 2020 & 2033
- Table 26: Nordics Sell Side Platform Revenue (billion) Forecast, by Application 2020 & 2033
- Table 27: Rest of Europe Sell Side Platform Revenue (billion) Forecast, by Application 2020 & 2033
- Table 28: Global Sell Side Platform Revenue billion Forecast, by Application 2020 & 2033
- Table 29: Global Sell Side Platform Revenue billion Forecast, by Types 2020 & 2033
- Table 30: Global Sell Side Platform Revenue billion Forecast, by Country 2020 & 2033
- Table 31: Turkey Sell Side Platform Revenue (billion) Forecast, by Application 2020 & 2033
- Table 32: Israel Sell Side Platform Revenue (billion) Forecast, by Application 2020 & 2033
- Table 33: GCC Sell Side Platform Revenue (billion) Forecast, by Application 2020 & 2033
- Table 34: North Africa Sell Side Platform Revenue (billion) Forecast, by Application 2020 & 2033
- Table 35: South Africa Sell Side Platform Revenue (billion) Forecast, by Application 2020 & 2033
- Table 36: Rest of Middle East & Africa Sell Side Platform Revenue (billion) Forecast, by Application 2020 & 2033
- Table 37: Global Sell Side Platform Revenue billion Forecast, by Application 2020 & 2033
- Table 38: Global Sell Side Platform Revenue billion Forecast, by Types 2020 & 2033
- Table 39: Global Sell Side Platform Revenue billion Forecast, by Country 2020 & 2033
- Table 40: China Sell Side Platform Revenue (billion) Forecast, by Application 2020 & 2033
- Table 41: India Sell Side Platform Revenue (billion) Forecast, by Application 2020 & 2033
- Table 42: Japan Sell Side Platform Revenue (billion) Forecast, by Application 2020 & 2033
- Table 43: South Korea Sell Side Platform Revenue (billion) Forecast, by Application 2020 & 2033
- Table 44: ASEAN Sell Side Platform Revenue (billion) Forecast, by Application 2020 & 2033
- Table 45: Oceania Sell Side Platform Revenue (billion) Forecast, by Application 2020 & 2033
- Table 46: Rest of Asia Pacific Sell Side Platform Revenue (billion) Forecast, by Application 2020 & 2033
Frequently Asked Questions
1. What is the projected Compound Annual Growth Rate (CAGR) of the Sell Side Platform?
The projected CAGR is approximately 9.95%.
2. Which companies are prominent players in the Sell Side Platform?
Key companies in the market include Google Ad Manager, AerServ, AppNexus, MoPub, BounceX, OpenX, RhthymOne, Rubicon Project, PubMatic, ONE by AOL, Insticator, 360 Polaris, Smart AdServer, Operative.One, AdBook, Admixer.SSP, SmartyAds, Naviga Ad.
3. What are the main segments of the Sell Side Platform?
The market segments include Application, Types.
4. Can you provide details about the market size?
The market size is estimated to be USD 12.66 billion as of 2022.
5. What are some drivers contributing to market growth?
N/A
6. What are the notable trends driving market growth?
N/A
7. Are there any restraints impacting market growth?
N/A
8. Can you provide examples of recent developments in the market?
N/A
9. What pricing options are available for accessing the report?
Pricing options include single-user, multi-user, and enterprise licenses priced at USD 2900.00, USD 4350.00, and USD 5800.00 respectively.
10. Is the market size provided in terms of value or volume?
The market size is provided in terms of value, measured in billion.
11. Are there any specific market keywords associated with the report?
Yes, the market keyword associated with the report is "Sell Side Platform," which aids in identifying and referencing the specific market segment covered.
12. How do I determine which pricing option suits my needs best?
The pricing options vary based on user requirements and access needs. Individual users may opt for single-user licenses, while businesses requiring broader access may choose multi-user or enterprise licenses for cost-effective access to the report.
13. Are there any additional resources or data provided in the Sell Side Platform report?
While the report offers comprehensive insights, it's advisable to review the specific contents or supplementary materials provided to ascertain if additional resources or data are available.
14. How can I stay updated on further developments or reports in the Sell Side Platform?
To stay informed about further developments, trends, and reports in the Sell Side Platform, consider subscribing to industry newsletters, following relevant companies and organizations, or regularly checking reputable industry news sources and publications.
Methodology
Step 1 - Identification of Relevant Samples Size from Population Database


Step 2 - Approaches for Defining Global Market Size (Value, Volume* & Price*)

Note*: In applicable scenarios
Step 3 - Data Sources
Primary Research
- Web Analytics
- Survey Reports
- Research Institute
- Latest Research Reports
- Opinion Leaders
Secondary Research
- Annual Reports
- White Paper
- Latest Press Release
- Industry Association
- Paid Database
- Investor Presentations

Step 4 - Data Triangulation
Involves using different sources of information in order to increase the validity of a study
These sources are likely to be stakeholders in a program - participants, other researchers, program staff, other community members, and so on.
Then we put all data in single framework & apply various statistical tools to find out the dynamic on the market.
During the analysis stage, feedback from the stakeholder groups would be compared to determine areas of agreement as well as areas of divergence