
Key Insights
The global rolling stock traction converter market is experiencing robust growth, driven by the increasing demand for high-speed and efficient rail transportation systems worldwide. The market is projected to expand significantly over the forecast period (2025-2033), fueled by several key factors. Government initiatives promoting sustainable transportation, coupled with rising urbanization and the need for improved public transit infrastructure, are major contributors to this growth. Technological advancements in power electronics, leading to the development of more efficient and reliable traction converters, further bolster market expansion. The shift towards electric and hybrid rolling stock is a primary driver, as these vehicles necessitate the use of advanced traction converters for optimal performance and energy efficiency. Furthermore, the growing adoption of regenerative braking systems, which recapture energy during deceleration and feed it back into the system, is contributing to the market's expansion. Competition among established players like ABB, Siemens, and Bombardier, along with the emergence of innovative companies, is fostering innovation and driving down costs, making traction converters more accessible for various rolling stock applications.
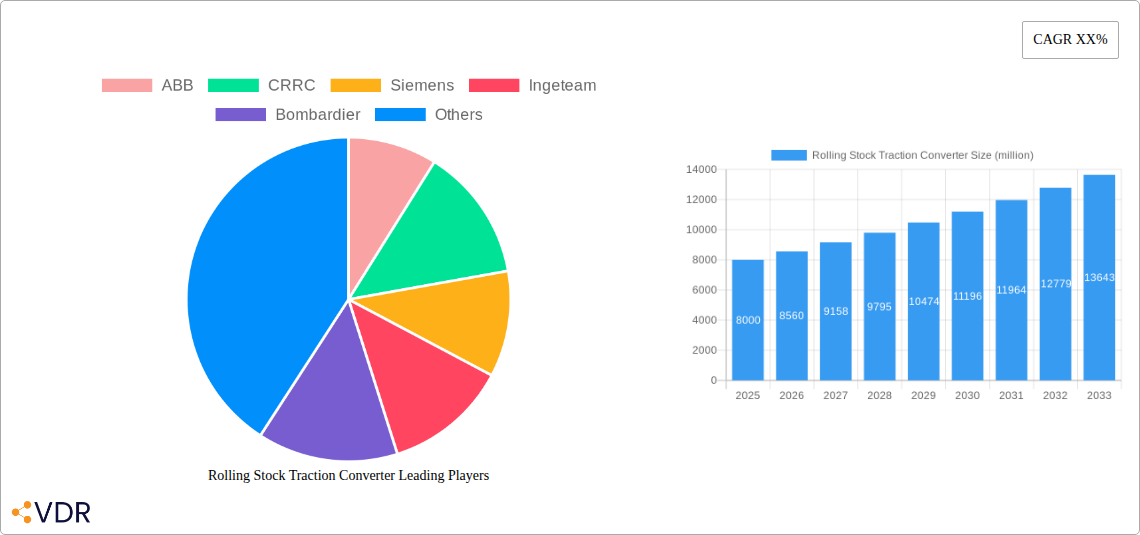
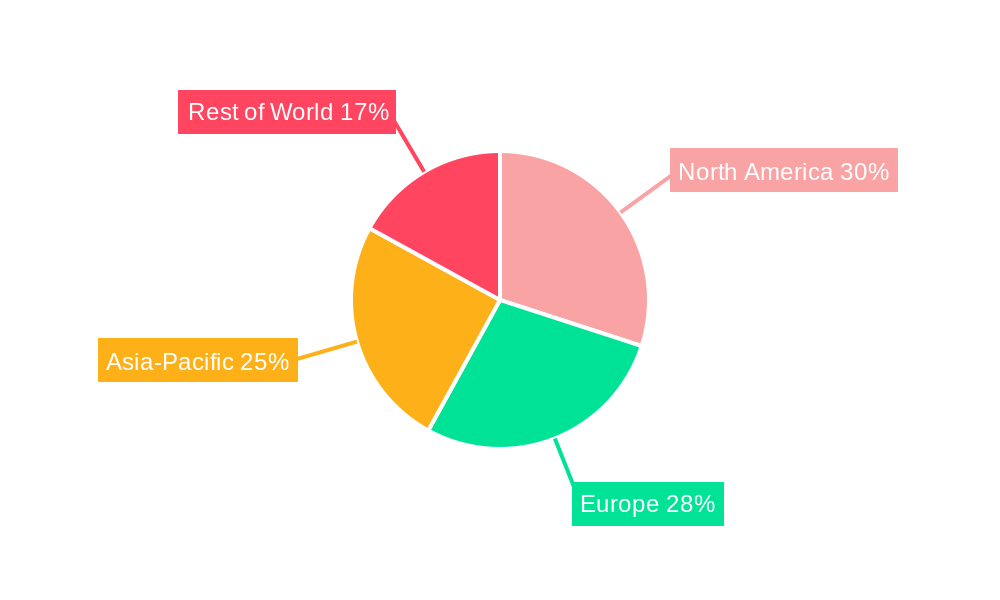
Market segmentation reveals strong growth across different regions, with North America and Europe currently holding substantial market shares. However, rapid infrastructure development in Asia-Pacific and other emerging economies is expected to fuel significant growth in these regions in the coming years. While the market faces challenges like high initial investment costs and the need for skilled technicians for installation and maintenance, the long-term benefits of improved efficiency, reduced emissions, and enhanced operational performance are likely to outweigh these restraints. This positive outlook, coupled with ongoing technological innovation and supportive government policies, ensures sustained growth for the rolling stock traction converter market throughout the forecast period. We estimate the market size in 2025 to be $8 billion, growing at a Compound Annual Growth Rate (CAGR) of 7% until 2033. This estimation is based on analyzing historical data and current market trends in related sectors.
Rolling Stock Traction Converter Market Report: 2019-2033
This comprehensive report provides an in-depth analysis of the global Rolling Stock Traction Converter market, encompassing market dynamics, growth trends, regional analysis, competitive landscape, and future outlook. The study period covers 2019-2033, with 2025 as the base and estimated year. The forecast period spans 2025-2033, and the historical period encompasses 2019-2024. This report is crucial for industry professionals, investors, and stakeholders seeking a detailed understanding of this rapidly evolving market, valued at xx million USD in 2025 and projected to reach xx million USD by 2033. The parent market is the Rolling Stock Market and the child market is the Traction System market.
Rolling Stock Traction Converter Market Dynamics & Structure
The Rolling Stock Traction Converter market is characterized by a moderately concentrated landscape, with key players like ABB, Siemens, and CRRC holding significant market share. Technological innovation, particularly in power electronics and energy efficiency, is a primary growth driver. Stringent regulatory frameworks focused on emissions and safety are shaping product development. The market witnesses continuous innovation in power semiconductor technology, IGBTs, and SiC-based converters leading to higher efficiency and compact designs. Competition from alternative technologies remains limited, with the primary substitute being older, less efficient converter designs. The market exhibits a global presence with growth primarily concentrated in regions with large-scale infrastructure development projects. M&A activity has been moderate in recent years, with a focus on strategic partnerships and technology acquisitions rather than large-scale mergers.
- Market Concentration: Moderately concentrated, with top 5 players holding approximately 60% market share in 2025.
- Technological Innovation: Focus on SiC-based converters, improved power density, and advanced control algorithms.
- Regulatory Landscape: Stricter emission norms and safety standards driving innovation.
- M&A Activity: Strategic partnerships and technology acquisitions are prevalent, with approximately xx deals in the last 5 years (value: xx million USD).
- Innovation Barriers: High R&D costs, stringent certification processes, and the need for specialized expertise.
Rolling Stock Traction Converter Growth Trends & Insights
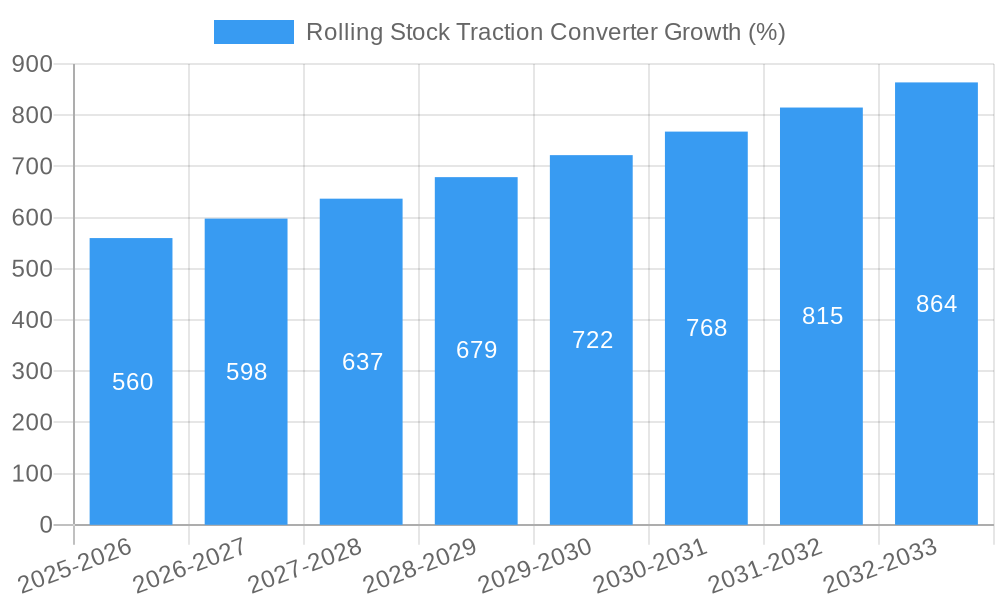
The global Rolling Stock Traction Converter market experienced robust growth during the historical period (2019-2024), driven by increasing investments in rail infrastructure globally, especially in developing economies. The market size expanded at a CAGR of xx% during this period, reaching xx million USD in 2024. The adoption rate of advanced traction converters, particularly those incorporating energy-saving features, is steadily increasing. This adoption is propelled by rising fuel costs, environmental concerns, and the need for improved operational efficiency in rail systems. Technological advancements such as the integration of regenerative braking systems and the utilization of silicon carbide (SiC) based inverters are significantly influencing market growth. Furthermore, changing consumer preferences towards sustainable transportation solutions are fueling demand for energy-efficient rolling stock. The forecast period (2025-2033) anticipates continued growth, with a projected CAGR of xx%, driven by sustained infrastructure investments and technological innovations. Market penetration of SiC-based converters is expected to increase from xx% in 2025 to xx% by 2033.
Dominant Regions, Countries, or Segments in Rolling Stock Traction Converter
The Asia-Pacific region is currently the dominant market for Rolling Stock Traction Converters, driven by extensive investments in high-speed rail projects and rapid urbanization. China and India are key contributors, owing to their ambitious railway modernization plans and burgeoning passenger and freight transportation volumes. Europe and North America also contribute significantly to global market growth, mainly propelled by railway upgrades and fleet modernization initiatives. The high-speed rail segment exhibits the highest growth potential owing to its unique power requirements that drive demand for advanced converter technologies.
- Key Drivers in Asia-Pacific: Government investments in high-speed rail, expanding urban transit networks, and growing passenger traffic.
- Dominance Factors: Large-scale infrastructure projects, favorable economic conditions, and substantial government support for railway modernization.
- Growth Potential: Significant opportunities exist in emerging economies, driven by expanding railway networks and modernization of existing systems.
Rolling Stock Traction Converter Product Landscape
The Rolling Stock Traction Converter market offers a diverse range of products, categorized by power rating, voltage level, and cooling technology. Innovations focus on increasing power density, improving efficiency through the use of SiC MOSFETs and GaN devices, and enhancing reliability through advanced control and monitoring systems. Key features include regenerative braking capabilities for energy recovery, compact designs for space optimization, and robust thermal management systems. Unique selling propositions often revolve around higher efficiency, reduced maintenance requirements, and improved system integration.
Key Drivers, Barriers & Challenges in Rolling Stock Traction Converter
Key Drivers:
- Increasing investments in railway infrastructure globally.
- Growing demand for energy-efficient and sustainable transportation.
- Technological advancements in power electronics and energy storage.
- Stringent emission regulations promoting adoption of advanced converters.
Key Challenges and Restraints:
- High initial investment costs for advanced converter technologies.
- Complex integration with existing rolling stock systems.
- Supply chain disruptions impacting component availability and costs.
- Intense competition among established players and new entrants. This leads to price pressure and margin erosion, impacting profitability. The impact is estimated at xx% on average profit margins for the top 5 players.
Emerging Opportunities in Rolling Stock Traction Converter
- Expanding market in developing economies with significant railway infrastructure development plans.
- Growing demand for hybrid and electric rolling stock, creating opportunities for advanced converter technologies.
- Increasing focus on smart grids and integration of renewable energy sources.
- Development of next-generation power semiconductor devices for improved efficiency and performance.
Growth Accelerators in the Rolling Stock Traction Converter Industry
Technological breakthroughs in power electronics and the development of cost-effective SiC-based converters are driving long-term growth. Strategic partnerships between rolling stock manufacturers and power electronics companies facilitate product innovation and market penetration. Expansion into new markets, particularly in regions with burgeoning railway networks, further accelerates market growth.
Key Players Shaping the Rolling Stock Traction Converter Market
- ABB ABB
- CRRC
- Siemens Siemens
- Ingeteam
- Bombardier
- Voith
- Toshiba Toshiba
- CAF Power & Automation
- Končar
- Medha
- Inovance
- Cgglobal
- Titagarh
- INVT
Notable Milestones in Rolling Stock Traction Converter Sector
- 2020: Siemens launched its new generation of SiC-based traction converters for high-speed trains.
- 2021: ABB and CRRC announced a strategic partnership to develop advanced traction systems for the Chinese market.
- 2022: Several key players invested heavily in R&D to improve the power density and efficiency of their converters.
- 2023: The European Union announced new regulations regarding energy efficiency in railway systems, creating new opportunities for advanced converters.
In-Depth Rolling Stock Traction Converter Market Outlook
The future of the Rolling Stock Traction Converter market is bright, propelled by sustained infrastructure investments globally and the continuous advancement of power electronics technology. The market will witness increased adoption of SiC and GaN-based converters, leading to improved efficiency, reduced weight, and enhanced system performance. Strategic partnerships and collaborations between key players will play a pivotal role in shaping the market landscape, driving innovation, and creating new growth opportunities. The market's expansion into developing economies, coupled with ongoing railway modernization efforts in developed countries, will fuel long-term market growth.
Rolling Stock Traction Converter Segmentation
-
1. Application
- 1.1. Diesel Locomotive
- 1.2. Electric Locomotive
- 1.3. EMU
- 1.4. Metro
-
2. Types
- 2.1. Propulsion Converter
- 2.2. Integrated Compact Converter
Rolling Stock Traction Converter Segmentation By Geography
-
1. North America
- 1.1. United States
- 1.2. Canada
- 1.3. Mexico
-
2. South America
- 2.1. Brazil
- 2.2. Argentina
- 2.3. Rest of South America
-
3. Europe
- 3.1. United Kingdom
- 3.2. Germany
- 3.3. France
- 3.4. Italy
- 3.5. Spain
- 3.6. Russia
- 3.7. Benelux
- 3.8. Nordics
- 3.9. Rest of Europe
-
4. Middle East & Africa
- 4.1. Turkey
- 4.2. Israel
- 4.3. GCC
- 4.4. North Africa
- 4.5. South Africa
- 4.6. Rest of Middle East & Africa
-
5. Asia Pacific
- 5.1. China
- 5.2. India
- 5.3. Japan
- 5.4. South Korea
- 5.5. ASEAN
- 5.6. Oceania
- 5.7. Rest of Asia Pacific
Rolling Stock Traction Converter REPORT HIGHLIGHTS
| Aspects | Details |
|---|---|
| Study Period | 2019-2033 |
| Base Year | 2024 |
| Estimated Year | 2025 |
| Forecast Period | 2025-2033 |
| Historical Period | 2019-2024 |
| Growth Rate | CAGR of XX% from 2019-2033 |
| Segmentation |
|
Table of Contents
- 1. Introduction
- 1.1. Research Scope
- 1.2. Market Segmentation
- 1.3. Research Methodology
- 1.4. Definitions and Assumptions
- 2. Executive Summary
- 2.1. Introduction
- 3. Market Dynamics
- 3.1. Introduction
- 3.2. Market Drivers
- 3.3. Market Restrains
- 3.4. Market Trends
- 4. Market Factor Analysis
- 4.1. Porters Five Forces
- 4.2. Supply/Value Chain
- 4.3. PESTEL analysis
- 4.4. Market Entropy
- 4.5. Patent/Trademark Analysis
- 5. Global Rolling Stock Traction Converter Analysis, Insights and Forecast, 2019-2031
- 5.1. Market Analysis, Insights and Forecast - by Application
- 5.1.1. Diesel Locomotive
- 5.1.2. Electric Locomotive
- 5.1.3. EMU
- 5.1.4. Metro
- 5.2. Market Analysis, Insights and Forecast - by Types
- 5.2.1. Propulsion Converter
- 5.2.2. Integrated Compact Converter
- 5.3. Market Analysis, Insights and Forecast - by Region
- 5.3.1. North America
- 5.3.2. South America
- 5.3.3. Europe
- 5.3.4. Middle East & Africa
- 5.3.5. Asia Pacific
- 5.1. Market Analysis, Insights and Forecast - by Application
- 6. North America Rolling Stock Traction Converter Analysis, Insights and Forecast, 2019-2031
- 6.1. Market Analysis, Insights and Forecast - by Application
- 6.1.1. Diesel Locomotive
- 6.1.2. Electric Locomotive
- 6.1.3. EMU
- 6.1.4. Metro
- 6.2. Market Analysis, Insights and Forecast - by Types
- 6.2.1. Propulsion Converter
- 6.2.2. Integrated Compact Converter
- 6.1. Market Analysis, Insights and Forecast - by Application
- 7. South America Rolling Stock Traction Converter Analysis, Insights and Forecast, 2019-2031
- 7.1. Market Analysis, Insights and Forecast - by Application
- 7.1.1. Diesel Locomotive
- 7.1.2. Electric Locomotive
- 7.1.3. EMU
- 7.1.4. Metro
- 7.2. Market Analysis, Insights and Forecast - by Types
- 7.2.1. Propulsion Converter
- 7.2.2. Integrated Compact Converter
- 7.1. Market Analysis, Insights and Forecast - by Application
- 8. Europe Rolling Stock Traction Converter Analysis, Insights and Forecast, 2019-2031
- 8.1. Market Analysis, Insights and Forecast - by Application
- 8.1.1. Diesel Locomotive
- 8.1.2. Electric Locomotive
- 8.1.3. EMU
- 8.1.4. Metro
- 8.2. Market Analysis, Insights and Forecast - by Types
- 8.2.1. Propulsion Converter
- 8.2.2. Integrated Compact Converter
- 8.1. Market Analysis, Insights and Forecast - by Application
- 9. Middle East & Africa Rolling Stock Traction Converter Analysis, Insights and Forecast, 2019-2031
- 9.1. Market Analysis, Insights and Forecast - by Application
- 9.1.1. Diesel Locomotive
- 9.1.2. Electric Locomotive
- 9.1.3. EMU
- 9.1.4. Metro
- 9.2. Market Analysis, Insights and Forecast - by Types
- 9.2.1. Propulsion Converter
- 9.2.2. Integrated Compact Converter
- 9.1. Market Analysis, Insights and Forecast - by Application
- 10. Asia Pacific Rolling Stock Traction Converter Analysis, Insights and Forecast, 2019-2031
- 10.1. Market Analysis, Insights and Forecast - by Application
- 10.1.1. Diesel Locomotive
- 10.1.2. Electric Locomotive
- 10.1.3. EMU
- 10.1.4. Metro
- 10.2. Market Analysis, Insights and Forecast - by Types
- 10.2.1. Propulsion Converter
- 10.2.2. Integrated Compact Converter
- 10.1. Market Analysis, Insights and Forecast - by Application
- 11. Competitive Analysis
- 11.1. Global Market Share Analysis 2024
- 11.2. Company Profiles
- 11.2.1 ABB
- 11.2.1.1. Overview
- 11.2.1.2. Products
- 11.2.1.3. SWOT Analysis
- 11.2.1.4. Recent Developments
- 11.2.1.5. Financials (Based on Availability)
- 11.2.2 CRRC
- 11.2.2.1. Overview
- 11.2.2.2. Products
- 11.2.2.3. SWOT Analysis
- 11.2.2.4. Recent Developments
- 11.2.2.5. Financials (Based on Availability)
- 11.2.3 Siemens
- 11.2.3.1. Overview
- 11.2.3.2. Products
- 11.2.3.3. SWOT Analysis
- 11.2.3.4. Recent Developments
- 11.2.3.5. Financials (Based on Availability)
- 11.2.4 Ingeteam
- 11.2.4.1. Overview
- 11.2.4.2. Products
- 11.2.4.3. SWOT Analysis
- 11.2.4.4. Recent Developments
- 11.2.4.5. Financials (Based on Availability)
- 11.2.5 Bombardier
- 11.2.5.1. Overview
- 11.2.5.2. Products
- 11.2.5.3. SWOT Analysis
- 11.2.5.4. Recent Developments
- 11.2.5.5. Financials (Based on Availability)
- 11.2.6 Voith
- 11.2.6.1. Overview
- 11.2.6.2. Products
- 11.2.6.3. SWOT Analysis
- 11.2.6.4. Recent Developments
- 11.2.6.5. Financials (Based on Availability)
- 11.2.7 Toshiba
- 11.2.7.1. Overview
- 11.2.7.2. Products
- 11.2.7.3. SWOT Analysis
- 11.2.7.4. Recent Developments
- 11.2.7.5. Financials (Based on Availability)
- 11.2.8 CAF Power & Automation
- 11.2.8.1. Overview
- 11.2.8.2. Products
- 11.2.8.3. SWOT Analysis
- 11.2.8.4. Recent Developments
- 11.2.8.5. Financials (Based on Availability)
- 11.2.9 Končar
- 11.2.9.1. Overview
- 11.2.9.2. Products
- 11.2.9.3. SWOT Analysis
- 11.2.9.4. Recent Developments
- 11.2.9.5. Financials (Based on Availability)
- 11.2.10 Medha
- 11.2.10.1. Overview
- 11.2.10.2. Products
- 11.2.10.3. SWOT Analysis
- 11.2.10.4. Recent Developments
- 11.2.10.5. Financials (Based on Availability)
- 11.2.11 Inovance
- 11.2.11.1. Overview
- 11.2.11.2. Products
- 11.2.11.3. SWOT Analysis
- 11.2.11.4. Recent Developments
- 11.2.11.5. Financials (Based on Availability)
- 11.2.12 Cgglobal
- 11.2.12.1. Overview
- 11.2.12.2. Products
- 11.2.12.3. SWOT Analysis
- 11.2.12.4. Recent Developments
- 11.2.12.5. Financials (Based on Availability)
- 11.2.13 Titagarh
- 11.2.13.1. Overview
- 11.2.13.2. Products
- 11.2.13.3. SWOT Analysis
- 11.2.13.4. Recent Developments
- 11.2.13.5. Financials (Based on Availability)
- 11.2.14 INVT
- 11.2.14.1. Overview
- 11.2.14.2. Products
- 11.2.14.3. SWOT Analysis
- 11.2.14.4. Recent Developments
- 11.2.14.5. Financials (Based on Availability)
- 11.2.1 ABB
List of Figures
- Figure 1: Global Rolling Stock Traction Converter Revenue Breakdown (million, %) by Region 2024 & 2032
- Figure 2: Global Rolling Stock Traction Converter Volume Breakdown (K, %) by Region 2024 & 2032
- Figure 3: North America Rolling Stock Traction Converter Revenue (million), by Application 2024 & 2032
- Figure 4: North America Rolling Stock Traction Converter Volume (K), by Application 2024 & 2032
- Figure 5: North America Rolling Stock Traction Converter Revenue Share (%), by Application 2024 & 2032
- Figure 6: North America Rolling Stock Traction Converter Volume Share (%), by Application 2024 & 2032
- Figure 7: North America Rolling Stock Traction Converter Revenue (million), by Types 2024 & 2032
- Figure 8: North America Rolling Stock Traction Converter Volume (K), by Types 2024 & 2032
- Figure 9: North America Rolling Stock Traction Converter Revenue Share (%), by Types 2024 & 2032
- Figure 10: North America Rolling Stock Traction Converter Volume Share (%), by Types 2024 & 2032
- Figure 11: North America Rolling Stock Traction Converter Revenue (million), by Country 2024 & 2032
- Figure 12: North America Rolling Stock Traction Converter Volume (K), by Country 2024 & 2032
- Figure 13: North America Rolling Stock Traction Converter Revenue Share (%), by Country 2024 & 2032
- Figure 14: North America Rolling Stock Traction Converter Volume Share (%), by Country 2024 & 2032
- Figure 15: South America Rolling Stock Traction Converter Revenue (million), by Application 2024 & 2032
- Figure 16: South America Rolling Stock Traction Converter Volume (K), by Application 2024 & 2032
- Figure 17: South America Rolling Stock Traction Converter Revenue Share (%), by Application 2024 & 2032
- Figure 18: South America Rolling Stock Traction Converter Volume Share (%), by Application 2024 & 2032
- Figure 19: South America Rolling Stock Traction Converter Revenue (million), by Types 2024 & 2032
- Figure 20: South America Rolling Stock Traction Converter Volume (K), by Types 2024 & 2032
- Figure 21: South America Rolling Stock Traction Converter Revenue Share (%), by Types 2024 & 2032
- Figure 22: South America Rolling Stock Traction Converter Volume Share (%), by Types 2024 & 2032
- Figure 23: South America Rolling Stock Traction Converter Revenue (million), by Country 2024 & 2032
- Figure 24: South America Rolling Stock Traction Converter Volume (K), by Country 2024 & 2032
- Figure 25: South America Rolling Stock Traction Converter Revenue Share (%), by Country 2024 & 2032
- Figure 26: South America Rolling Stock Traction Converter Volume Share (%), by Country 2024 & 2032
- Figure 27: Europe Rolling Stock Traction Converter Revenue (million), by Application 2024 & 2032
- Figure 28: Europe Rolling Stock Traction Converter Volume (K), by Application 2024 & 2032
- Figure 29: Europe Rolling Stock Traction Converter Revenue Share (%), by Application 2024 & 2032
- Figure 30: Europe Rolling Stock Traction Converter Volume Share (%), by Application 2024 & 2032
- Figure 31: Europe Rolling Stock Traction Converter Revenue (million), by Types 2024 & 2032
- Figure 32: Europe Rolling Stock Traction Converter Volume (K), by Types 2024 & 2032
- Figure 33: Europe Rolling Stock Traction Converter Revenue Share (%), by Types 2024 & 2032
- Figure 34: Europe Rolling Stock Traction Converter Volume Share (%), by Types 2024 & 2032
- Figure 35: Europe Rolling Stock Traction Converter Revenue (million), by Country 2024 & 2032
- Figure 36: Europe Rolling Stock Traction Converter Volume (K), by Country 2024 & 2032
- Figure 37: Europe Rolling Stock Traction Converter Revenue Share (%), by Country 2024 & 2032
- Figure 38: Europe Rolling Stock Traction Converter Volume Share (%), by Country 2024 & 2032
- Figure 39: Middle East & Africa Rolling Stock Traction Converter Revenue (million), by Application 2024 & 2032
- Figure 40: Middle East & Africa Rolling Stock Traction Converter Volume (K), by Application 2024 & 2032
- Figure 41: Middle East & Africa Rolling Stock Traction Converter Revenue Share (%), by Application 2024 & 2032
- Figure 42: Middle East & Africa Rolling Stock Traction Converter Volume Share (%), by Application 2024 & 2032
- Figure 43: Middle East & Africa Rolling Stock Traction Converter Revenue (million), by Types 2024 & 2032
- Figure 44: Middle East & Africa Rolling Stock Traction Converter Volume (K), by Types 2024 & 2032
- Figure 45: Middle East & Africa Rolling Stock Traction Converter Revenue Share (%), by Types 2024 & 2032
- Figure 46: Middle East & Africa Rolling Stock Traction Converter Volume Share (%), by Types 2024 & 2032
- Figure 47: Middle East & Africa Rolling Stock Traction Converter Revenue (million), by Country 2024 & 2032
- Figure 48: Middle East & Africa Rolling Stock Traction Converter Volume (K), by Country 2024 & 2032
- Figure 49: Middle East & Africa Rolling Stock Traction Converter Revenue Share (%), by Country 2024 & 2032
- Figure 50: Middle East & Africa Rolling Stock Traction Converter Volume Share (%), by Country 2024 & 2032
- Figure 51: Asia Pacific Rolling Stock Traction Converter Revenue (million), by Application 2024 & 2032
- Figure 52: Asia Pacific Rolling Stock Traction Converter Volume (K), by Application 2024 & 2032
- Figure 53: Asia Pacific Rolling Stock Traction Converter Revenue Share (%), by Application 2024 & 2032
- Figure 54: Asia Pacific Rolling Stock Traction Converter Volume Share (%), by Application 2024 & 2032
- Figure 55: Asia Pacific Rolling Stock Traction Converter Revenue (million), by Types 2024 & 2032
- Figure 56: Asia Pacific Rolling Stock Traction Converter Volume (K), by Types 2024 & 2032
- Figure 57: Asia Pacific Rolling Stock Traction Converter Revenue Share (%), by Types 2024 & 2032
- Figure 58: Asia Pacific Rolling Stock Traction Converter Volume Share (%), by Types 2024 & 2032
- Figure 59: Asia Pacific Rolling Stock Traction Converter Revenue (million), by Country 2024 & 2032
- Figure 60: Asia Pacific Rolling Stock Traction Converter Volume (K), by Country 2024 & 2032
- Figure 61: Asia Pacific Rolling Stock Traction Converter Revenue Share (%), by Country 2024 & 2032
- Figure 62: Asia Pacific Rolling Stock Traction Converter Volume Share (%), by Country 2024 & 2032
List of Tables
- Table 1: Global Rolling Stock Traction Converter Revenue million Forecast, by Region 2019 & 2032
- Table 2: Global Rolling Stock Traction Converter Volume K Forecast, by Region 2019 & 2032
- Table 3: Global Rolling Stock Traction Converter Revenue million Forecast, by Application 2019 & 2032
- Table 4: Global Rolling Stock Traction Converter Volume K Forecast, by Application 2019 & 2032
- Table 5: Global Rolling Stock Traction Converter Revenue million Forecast, by Types 2019 & 2032
- Table 6: Global Rolling Stock Traction Converter Volume K Forecast, by Types 2019 & 2032
- Table 7: Global Rolling Stock Traction Converter Revenue million Forecast, by Region 2019 & 2032
- Table 8: Global Rolling Stock Traction Converter Volume K Forecast, by Region 2019 & 2032
- Table 9: Global Rolling Stock Traction Converter Revenue million Forecast, by Application 2019 & 2032
- Table 10: Global Rolling Stock Traction Converter Volume K Forecast, by Application 2019 & 2032
- Table 11: Global Rolling Stock Traction Converter Revenue million Forecast, by Types 2019 & 2032
- Table 12: Global Rolling Stock Traction Converter Volume K Forecast, by Types 2019 & 2032
- Table 13: Global Rolling Stock Traction Converter Revenue million Forecast, by Country 2019 & 2032
- Table 14: Global Rolling Stock Traction Converter Volume K Forecast, by Country 2019 & 2032
- Table 15: United States Rolling Stock Traction Converter Revenue (million) Forecast, by Application 2019 & 2032
- Table 16: United States Rolling Stock Traction Converter Volume (K) Forecast, by Application 2019 & 2032
- Table 17: Canada Rolling Stock Traction Converter Revenue (million) Forecast, by Application 2019 & 2032
- Table 18: Canada Rolling Stock Traction Converter Volume (K) Forecast, by Application 2019 & 2032
- Table 19: Mexico Rolling Stock Traction Converter Revenue (million) Forecast, by Application 2019 & 2032
- Table 20: Mexico Rolling Stock Traction Converter Volume (K) Forecast, by Application 2019 & 2032
- Table 21: Global Rolling Stock Traction Converter Revenue million Forecast, by Application 2019 & 2032
- Table 22: Global Rolling Stock Traction Converter Volume K Forecast, by Application 2019 & 2032
- Table 23: Global Rolling Stock Traction Converter Revenue million Forecast, by Types 2019 & 2032
- Table 24: Global Rolling Stock Traction Converter Volume K Forecast, by Types 2019 & 2032
- Table 25: Global Rolling Stock Traction Converter Revenue million Forecast, by Country 2019 & 2032
- Table 26: Global Rolling Stock Traction Converter Volume K Forecast, by Country 2019 & 2032
- Table 27: Brazil Rolling Stock Traction Converter Revenue (million) Forecast, by Application 2019 & 2032
- Table 28: Brazil Rolling Stock Traction Converter Volume (K) Forecast, by Application 2019 & 2032
- Table 29: Argentina Rolling Stock Traction Converter Revenue (million) Forecast, by Application 2019 & 2032
- Table 30: Argentina Rolling Stock Traction Converter Volume (K) Forecast, by Application 2019 & 2032
- Table 31: Rest of South America Rolling Stock Traction Converter Revenue (million) Forecast, by Application 2019 & 2032
- Table 32: Rest of South America Rolling Stock Traction Converter Volume (K) Forecast, by Application 2019 & 2032
- Table 33: Global Rolling Stock Traction Converter Revenue million Forecast, by Application 2019 & 2032
- Table 34: Global Rolling Stock Traction Converter Volume K Forecast, by Application 2019 & 2032
- Table 35: Global Rolling Stock Traction Converter Revenue million Forecast, by Types 2019 & 2032
- Table 36: Global Rolling Stock Traction Converter Volume K Forecast, by Types 2019 & 2032
- Table 37: Global Rolling Stock Traction Converter Revenue million Forecast, by Country 2019 & 2032
- Table 38: Global Rolling Stock Traction Converter Volume K Forecast, by Country 2019 & 2032
- Table 39: United Kingdom Rolling Stock Traction Converter Revenue (million) Forecast, by Application 2019 & 2032
- Table 40: United Kingdom Rolling Stock Traction Converter Volume (K) Forecast, by Application 2019 & 2032
- Table 41: Germany Rolling Stock Traction Converter Revenue (million) Forecast, by Application 2019 & 2032
- Table 42: Germany Rolling Stock Traction Converter Volume (K) Forecast, by Application 2019 & 2032
- Table 43: France Rolling Stock Traction Converter Revenue (million) Forecast, by Application 2019 & 2032
- Table 44: France Rolling Stock Traction Converter Volume (K) Forecast, by Application 2019 & 2032
- Table 45: Italy Rolling Stock Traction Converter Revenue (million) Forecast, by Application 2019 & 2032
- Table 46: Italy Rolling Stock Traction Converter Volume (K) Forecast, by Application 2019 & 2032
- Table 47: Spain Rolling Stock Traction Converter Revenue (million) Forecast, by Application 2019 & 2032
- Table 48: Spain Rolling Stock Traction Converter Volume (K) Forecast, by Application 2019 & 2032
- Table 49: Russia Rolling Stock Traction Converter Revenue (million) Forecast, by Application 2019 & 2032
- Table 50: Russia Rolling Stock Traction Converter Volume (K) Forecast, by Application 2019 & 2032
- Table 51: Benelux Rolling Stock Traction Converter Revenue (million) Forecast, by Application 2019 & 2032
- Table 52: Benelux Rolling Stock Traction Converter Volume (K) Forecast, by Application 2019 & 2032
- Table 53: Nordics Rolling Stock Traction Converter Revenue (million) Forecast, by Application 2019 & 2032
- Table 54: Nordics Rolling Stock Traction Converter Volume (K) Forecast, by Application 2019 & 2032
- Table 55: Rest of Europe Rolling Stock Traction Converter Revenue (million) Forecast, by Application 2019 & 2032
- Table 56: Rest of Europe Rolling Stock Traction Converter Volume (K) Forecast, by Application 2019 & 2032
- Table 57: Global Rolling Stock Traction Converter Revenue million Forecast, by Application 2019 & 2032
- Table 58: Global Rolling Stock Traction Converter Volume K Forecast, by Application 2019 & 2032
- Table 59: Global Rolling Stock Traction Converter Revenue million Forecast, by Types 2019 & 2032
- Table 60: Global Rolling Stock Traction Converter Volume K Forecast, by Types 2019 & 2032
- Table 61: Global Rolling Stock Traction Converter Revenue million Forecast, by Country 2019 & 2032
- Table 62: Global Rolling Stock Traction Converter Volume K Forecast, by Country 2019 & 2032
- Table 63: Turkey Rolling Stock Traction Converter Revenue (million) Forecast, by Application 2019 & 2032
- Table 64: Turkey Rolling Stock Traction Converter Volume (K) Forecast, by Application 2019 & 2032
- Table 65: Israel Rolling Stock Traction Converter Revenue (million) Forecast, by Application 2019 & 2032
- Table 66: Israel Rolling Stock Traction Converter Volume (K) Forecast, by Application 2019 & 2032
- Table 67: GCC Rolling Stock Traction Converter Revenue (million) Forecast, by Application 2019 & 2032
- Table 68: GCC Rolling Stock Traction Converter Volume (K) Forecast, by Application 2019 & 2032
- Table 69: North Africa Rolling Stock Traction Converter Revenue (million) Forecast, by Application 2019 & 2032
- Table 70: North Africa Rolling Stock Traction Converter Volume (K) Forecast, by Application 2019 & 2032
- Table 71: South Africa Rolling Stock Traction Converter Revenue (million) Forecast, by Application 2019 & 2032
- Table 72: South Africa Rolling Stock Traction Converter Volume (K) Forecast, by Application 2019 & 2032
- Table 73: Rest of Middle East & Africa Rolling Stock Traction Converter Revenue (million) Forecast, by Application 2019 & 2032
- Table 74: Rest of Middle East & Africa Rolling Stock Traction Converter Volume (K) Forecast, by Application 2019 & 2032
- Table 75: Global Rolling Stock Traction Converter Revenue million Forecast, by Application 2019 & 2032
- Table 76: Global Rolling Stock Traction Converter Volume K Forecast, by Application 2019 & 2032
- Table 77: Global Rolling Stock Traction Converter Revenue million Forecast, by Types 2019 & 2032
- Table 78: Global Rolling Stock Traction Converter Volume K Forecast, by Types 2019 & 2032
- Table 79: Global Rolling Stock Traction Converter Revenue million Forecast, by Country 2019 & 2032
- Table 80: Global Rolling Stock Traction Converter Volume K Forecast, by Country 2019 & 2032
- Table 81: China Rolling Stock Traction Converter Revenue (million) Forecast, by Application 2019 & 2032
- Table 82: China Rolling Stock Traction Converter Volume (K) Forecast, by Application 2019 & 2032
- Table 83: India Rolling Stock Traction Converter Revenue (million) Forecast, by Application 2019 & 2032
- Table 84: India Rolling Stock Traction Converter Volume (K) Forecast, by Application 2019 & 2032
- Table 85: Japan Rolling Stock Traction Converter Revenue (million) Forecast, by Application 2019 & 2032
- Table 86: Japan Rolling Stock Traction Converter Volume (K) Forecast, by Application 2019 & 2032
- Table 87: South Korea Rolling Stock Traction Converter Revenue (million) Forecast, by Application 2019 & 2032
- Table 88: South Korea Rolling Stock Traction Converter Volume (K) Forecast, by Application 2019 & 2032
- Table 89: ASEAN Rolling Stock Traction Converter Revenue (million) Forecast, by Application 2019 & 2032
- Table 90: ASEAN Rolling Stock Traction Converter Volume (K) Forecast, by Application 2019 & 2032
- Table 91: Oceania Rolling Stock Traction Converter Revenue (million) Forecast, by Application 2019 & 2032
- Table 92: Oceania Rolling Stock Traction Converter Volume (K) Forecast, by Application 2019 & 2032
- Table 93: Rest of Asia Pacific Rolling Stock Traction Converter Revenue (million) Forecast, by Application 2019 & 2032
- Table 94: Rest of Asia Pacific Rolling Stock Traction Converter Volume (K) Forecast, by Application 2019 & 2032
Frequently Asked Questions
1. What is the projected Compound Annual Growth Rate (CAGR) of the Rolling Stock Traction Converter?
The projected CAGR is approximately XX%.
2. Which companies are prominent players in the Rolling Stock Traction Converter?
Key companies in the market include ABB, CRRC, Siemens, Ingeteam, Bombardier, Voith, Toshiba, CAF Power & Automation, Končar, Medha, Inovance, Cgglobal, Titagarh, INVT.
3. What are the main segments of the Rolling Stock Traction Converter?
The market segments include Application, Types.
4. Can you provide details about the market size?
The market size is estimated to be USD XXX million as of 2022.
5. What are some drivers contributing to market growth?
N/A
6. What are the notable trends driving market growth?
N/A
7. Are there any restraints impacting market growth?
N/A
8. Can you provide examples of recent developments in the market?
N/A
9. What pricing options are available for accessing the report?
Pricing options include single-user, multi-user, and enterprise licenses priced at USD 3350.00, USD 5025.00, and USD 6700.00 respectively.
10. Is the market size provided in terms of value or volume?
The market size is provided in terms of value, measured in million and volume, measured in K.
11. Are there any specific market keywords associated with the report?
Yes, the market keyword associated with the report is "Rolling Stock Traction Converter," which aids in identifying and referencing the specific market segment covered.
12. How do I determine which pricing option suits my needs best?
The pricing options vary based on user requirements and access needs. Individual users may opt for single-user licenses, while businesses requiring broader access may choose multi-user or enterprise licenses for cost-effective access to the report.
13. Are there any additional resources or data provided in the Rolling Stock Traction Converter report?
While the report offers comprehensive insights, it's advisable to review the specific contents or supplementary materials provided to ascertain if additional resources or data are available.
14. How can I stay updated on further developments or reports in the Rolling Stock Traction Converter?
To stay informed about further developments, trends, and reports in the Rolling Stock Traction Converter, consider subscribing to industry newsletters, following relevant companies and organizations, or regularly checking reputable industry news sources and publications.
Methodology
Step 1 - Identification of Relevant Samples Size from Population Database


Step 2 - Approaches for Defining Global Market Size (Value, Volume* & Price*)

Note*: In applicable scenarios
Step 3 - Data Sources
Primary Research
- Web Analytics
- Survey Reports
- Research Institute
- Latest Research Reports
- Opinion Leaders
Secondary Research
- Annual Reports
- White Paper
- Latest Press Release
- Industry Association
- Paid Database
- Investor Presentations

Step 4 - Data Triangulation
Involves using different sources of information in order to increase the validity of a study
These sources are likely to be stakeholders in a program - participants, other researchers, program staff, other community members, and so on.
Then we put all data in single framework & apply various statistical tools to find out the dynamic on the market.
During the analysis stage, feedback from the stakeholder groups would be compared to determine areas of agreement as well as areas of divergence


