
Key Insights
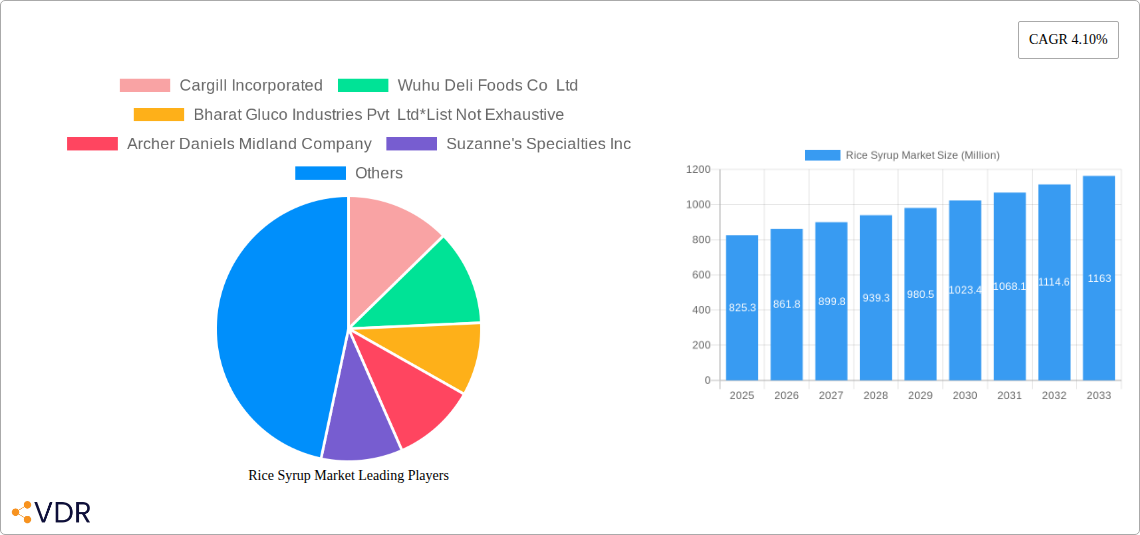
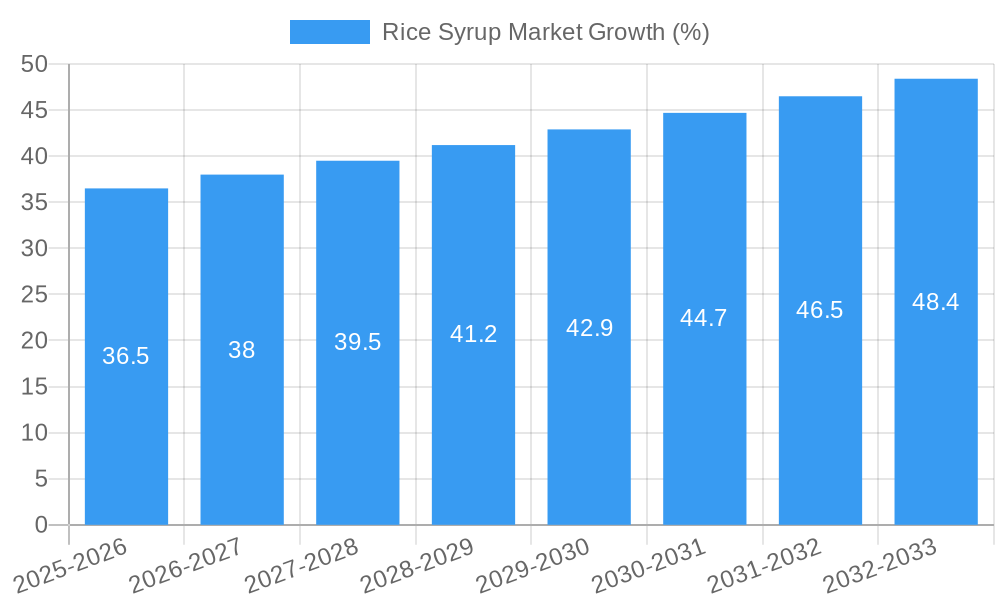
The global rice syrup market, valued at $825.3 million in 2025, is projected to experience steady growth, driven by increasing consumer demand for natural and healthier sweeteners. This growth is fueled by the rising popularity of clean-label products across various food and beverage applications. The bakery and confectionery sector is a major driver, with rice syrup increasingly used as a sugar substitute due to its lower glycemic index and mild sweetness. Furthermore, the growing health-conscious consumer base is seeking alternatives to high-fructose corn syrup and other refined sugars, boosting the market's appeal. The market is segmented by application (bakery, beverages, dairy, meat, etc.), rice type (brown, white), and category (organic, conventional), offering diverse product choices to cater to varying consumer preferences and dietary needs. The organic segment is expected to witness significant growth, driven by increasing awareness of the health benefits associated with organic products. Major players like Cargill, ADM, and others are strategically expanding their product portfolios and exploring new applications to capitalize on the market's potential. Geographical expansion, particularly in developing economies with growing populations and rising disposable incomes, further contributes to market expansion. While challenges exist, such as fluctuations in raw material prices and competition from other sweeteners, the overall market outlook remains positive, projected to maintain a steady CAGR of 4.10% from 2025 to 2033.
The competitive landscape is marked by both established multinational corporations and regional players. Large players benefit from extensive distribution networks and established brand recognition. However, smaller companies are gaining traction by focusing on niche markets and offering specialized products, such as organic or specific rice type syrups. Future market growth will depend on factors such as innovation in product development, strategic partnerships, and successful marketing campaigns to target health-conscious consumers. The market will likely see increasing diversification of product offerings, with a focus on value-added features, such as functional ingredients or unique flavor profiles. Government regulations regarding food labeling and sweetener usage will also play a significant role in shaping the market trajectory in the coming years.
This comprehensive report provides an in-depth analysis of the global Rice Syrup Market, encompassing market dynamics, growth trends, regional dominance, product landscape, key players, and future outlook. The report covers the period from 2019 to 2033, with a focus on the forecast period of 2025-2033 and a base year of 2025. The market is segmented by application (Bakery and Confectionery, Beverages, Dessert and Dairy, Meat, Poultry, and Seafood, Instant Formula, Other Applications), rice type (Brown Rice, White Rice), and category (Organic, Conventional). This detailed analysis will equip industry professionals with actionable insights for strategic decision-making. The market is expected to reach xx Million units by 2033.
Rice Syrup Market Dynamics & Structure
The Rice Syrup Market exhibits a moderately consolidated structure, with key players such as Cargill Incorporated, Archer Daniels Midland Company, and Associated British Foods PLC holding significant market share. Technological innovation, particularly in processing techniques to enhance sweetness and reduce costs, is a major driver. Regulatory frameworks concerning food labeling and additives influence market dynamics. Competitive substitutes include corn syrup and other sweeteners, demanding ongoing product differentiation. End-user demographics, notably the rising preference for healthier alternatives among health-conscious consumers, are shaping market demand. M&A activity within the sector is moderate, with a reported xx number of deals in the historical period (2019-2024), indicating a focus on strategic expansion and consolidation.
- Market Concentration: Moderately consolidated, with top players holding xx% market share (2025).
- Technological Innovation: Focus on improving sweetness profiles and cost reduction.
- Regulatory Landscape: Compliance with food safety and labeling regulations is crucial.
- Competitive Substitutes: Corn syrup and other sweeteners present competitive pressure.
- M&A Activity: xx deals recorded between 2019-2024.
Rice Syrup Market Growth Trends & Insights
The Rice Syrup Market has experienced steady growth throughout the historical period (2019-2024), driven by increasing demand from the food and beverage industry. The market size is estimated at xx Million units in 2025 and is projected to witness a Compound Annual Growth Rate (CAGR) of xx% during the forecast period (2025-2033), reaching xx Million units by 2033. This growth is attributable to several factors, including rising consumer demand for natural and organic sweeteners, expanding applications in diverse food categories, and increasing adoption of rice syrup as a healthier alternative to refined sugar. Technological advancements in processing and production have also contributed to increased efficiency and market penetration. Shifts in consumer preferences towards healthier lifestyle choices are significant drivers.
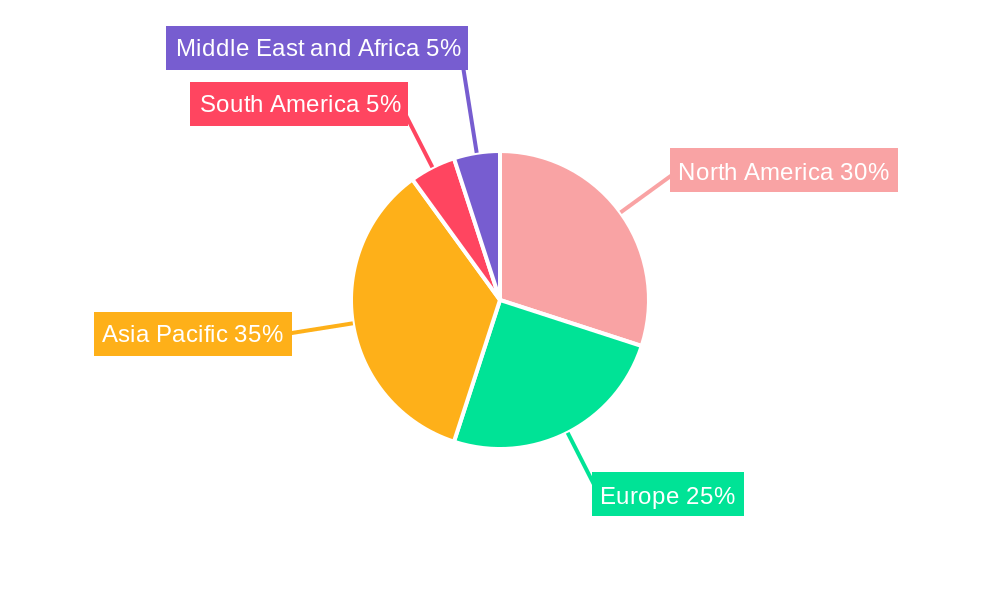
Dominant Regions, Countries, or Segments in Rice Syrup Market
North America currently dominates the Rice Syrup Market, holding approximately xx% market share in 2025, followed by Asia-Pacific. Within applications, the Bakery and Confectionery segment holds the largest market share (xx%), driven by extensive use as a sweetener and humectant. The organic category is exhibiting faster growth, reflecting the increasing consumer preference for natural food products.
- North America: High demand for natural sweeteners and established food processing infrastructure.
- Asia-Pacific: Rapid growth due to rising disposable incomes and growing food processing sector.
- Bakery and Confectionery Segment: Largest application segment due to functional properties.
- Organic Category: Fastest-growing segment driven by health consciousness.
Rice Syrup Market Product Landscape
Rice syrup products are available in various forms, including liquid, powdered, and granular, catering to different applications. Innovations center around enhancing sweetness, improving functionality (e.g., reducing stickiness), and extending shelf life. Technological advancements focus on optimizing extraction processes and refining the syrup's properties to meet specific consumer and industry requirements. Unique selling propositions often highlight the natural origin, low glycemic index, and potential health benefits.
Key Drivers, Barriers & Challenges in Rice Syrup Market
Key Drivers:
- Growing health consciousness and increasing demand for natural sweeteners.
- Expanding applications in various food and beverage segments.
- Technological advancements in processing techniques.
Challenges:
- Price volatility of rice as a raw material.
- Intense competition from other sweeteners (e.g., corn syrup, high-fructose corn syrup).
- Stringent regulatory requirements concerning labeling and food safety. This impacts smaller players disproportionately, estimated to add xx% to production costs for new entrants.
Emerging Opportunities in Rice Syrup Market
Untapped markets in developing economies present significant growth opportunities. Innovative applications in functional foods, health supplements, and specialty food products are emerging. Evolving consumer preferences towards clean-label ingredients and products with reduced sugar content present a significant opportunity for manufacturers to showcase rice syrup's natural attributes and reduced glycemic index.
Growth Accelerators in the Rice Syrup Market Industry
Strategic partnerships and collaborations between rice syrup manufacturers and food and beverage companies are accelerating market growth. Technological breakthroughs leading to higher yields and reduced production costs are crucial. Market expansion strategies focusing on emerging economies and new applications will fuel long-term expansion.
Key Players Shaping the Rice Syrup Market Market
- Cargill Incorporated
- Wuhu Deli Foods Co Ltd
- Bharat Gluco Industries Pvt Ltd
- Archer Daniels Midland Company
- Suzanne's Specialties Inc
- Pure Life Organic Foods Ltd
- Associated British Foods PLC
- Axiom Foods Inc
- California Natural Products Inc
- Gulshan Polyols Ltd
Notable Milestones in Rice Syrup Market Sector
- 2021: Launch of a new organic rice syrup by Suzanne's Specialties Inc.
- 2022: Acquisition of a smaller rice syrup producer by Cargill Incorporated.
- 2023: Introduction of a novel rice syrup processing technology by Archer Daniels Midland Company. (Specific details unavailable; estimated impact on industry efficiency: xx% improvement)
In-Depth Rice Syrup Market Market Outlook
The Rice Syrup Market is poised for continued expansion, driven by favorable demographic trends, increasing health awareness, and ongoing product innovations. Strategic partnerships, technological advancements, and focused market expansion will play key roles in shaping future growth. The market's potential lies in tapping into emerging markets and developing innovative applications that leverage the unique properties of rice syrup as a natural and versatile sweetener.
Rice Syrup Market Segmentation
-
1. Rice Type
- 1.1. Brown Rice
- 1.2. White Rice
-
2. Category
- 2.1. Organic
- 2.2. Conventional
-
3. Application
- 3.1. Bakery and Confectionery
- 3.2. Beverages
- 3.3. Dessert and Dairy
- 3.4. Meat, Poultry, and Seafood
- 3.5. Instant Formula
- 3.6. Other Applications
Rice Syrup Market Segmentation By Geography
-
1. North America
- 1.1. United States
- 1.2. Canada
- 1.3. Mexico
- 1.4. Rest of North America
-
2. Europe
- 2.1. Germany
- 2.2. United Kingdom
- 2.3. France
- 2.4. Russia
- 2.5. Spain
- 2.6. Rest of Europe
-
3. Asia Pacific
- 3.1. China
- 3.2. Japan
- 3.3. India
- 3.4. Australia
- 3.5. Rest of Asia Pacific
-
4. South America
- 4.1. Brazil
- 4.2. Argentina
- 4.3. Rest of South America
-
5. Middle East and Africa
- 5.1. Saudi Arabia
- 5.2. South Africa
- 5.3. Rest of Middle East and Africa
Rice Syrup Market REPORT HIGHLIGHTS
| Aspects | Details |
|---|---|
| Study Period | 2019-2033 |
| Base Year | 2024 |
| Estimated Year | 2025 |
| Forecast Period | 2025-2033 |
| Historical Period | 2019-2024 |
| Growth Rate | CAGR of 4.10% from 2019-2033 |
| Segmentation |
|
Table of Contents
- 1. Introduction
- 1.1. Research Scope
- 1.2. Market Segmentation
- 1.3. Research Methodology
- 1.4. Definitions and Assumptions
- 2. Executive Summary
- 2.1. Introduction
- 3. Market Dynamics
- 3.1. Introduction
- 3.2. Market Drivers
- 3.2.1. Increasing Demand For Convenience & Processed Food
- 3.3. Market Restrains
- 3.3.1. Increased Consumer Awareness On Side-Effects Of Chemical Additives
- 3.4. Market Trends
- 3.4.1. Rising Demand for Natural Sweetener
- 4. Market Factor Analysis
- 4.1. Porters Five Forces
- 4.2. Supply/Value Chain
- 4.3. PESTEL analysis
- 4.4. Market Entropy
- 4.5. Patent/Trademark Analysis
- 5. Global Rice Syrup Market Analysis, Insights and Forecast, 2019-2031
- 5.1. Market Analysis, Insights and Forecast - by Rice Type
- 5.1.1. Brown Rice
- 5.1.2. White Rice
- 5.2. Market Analysis, Insights and Forecast - by Category
- 5.2.1. Organic
- 5.2.2. Conventional
- 5.3. Market Analysis, Insights and Forecast - by Application
- 5.3.1. Bakery and Confectionery
- 5.3.2. Beverages
- 5.3.3. Dessert and Dairy
- 5.3.4. Meat, Poultry, and Seafood
- 5.3.5. Instant Formula
- 5.3.6. Other Applications
- 5.4. Market Analysis, Insights and Forecast - by Region
- 5.4.1. North America
- 5.4.2. Europe
- 5.4.3. Asia Pacific
- 5.4.4. South America
- 5.4.5. Middle East and Africa
- 5.1. Market Analysis, Insights and Forecast - by Rice Type
- 6. North America Rice Syrup Market Analysis, Insights and Forecast, 2019-2031
- 6.1. Market Analysis, Insights and Forecast - by Rice Type
- 6.1.1. Brown Rice
- 6.1.2. White Rice
- 6.2. Market Analysis, Insights and Forecast - by Category
- 6.2.1. Organic
- 6.2.2. Conventional
- 6.3. Market Analysis, Insights and Forecast - by Application
- 6.3.1. Bakery and Confectionery
- 6.3.2. Beverages
- 6.3.3. Dessert and Dairy
- 6.3.4. Meat, Poultry, and Seafood
- 6.3.5. Instant Formula
- 6.3.6. Other Applications
- 6.1. Market Analysis, Insights and Forecast - by Rice Type
- 7. Europe Rice Syrup Market Analysis, Insights and Forecast, 2019-2031
- 7.1. Market Analysis, Insights and Forecast - by Rice Type
- 7.1.1. Brown Rice
- 7.1.2. White Rice
- 7.2. Market Analysis, Insights and Forecast - by Category
- 7.2.1. Organic
- 7.2.2. Conventional
- 7.3. Market Analysis, Insights and Forecast - by Application
- 7.3.1. Bakery and Confectionery
- 7.3.2. Beverages
- 7.3.3. Dessert and Dairy
- 7.3.4. Meat, Poultry, and Seafood
- 7.3.5. Instant Formula
- 7.3.6. Other Applications
- 7.1. Market Analysis, Insights and Forecast - by Rice Type
- 8. Asia Pacific Rice Syrup Market Analysis, Insights and Forecast, 2019-2031
- 8.1. Market Analysis, Insights and Forecast - by Rice Type
- 8.1.1. Brown Rice
- 8.1.2. White Rice
- 8.2. Market Analysis, Insights and Forecast - by Category
- 8.2.1. Organic
- 8.2.2. Conventional
- 8.3. Market Analysis, Insights and Forecast - by Application
- 8.3.1. Bakery and Confectionery
- 8.3.2. Beverages
- 8.3.3. Dessert and Dairy
- 8.3.4. Meat, Poultry, and Seafood
- 8.3.5. Instant Formula
- 8.3.6. Other Applications
- 8.1. Market Analysis, Insights and Forecast - by Rice Type
- 9. South America Rice Syrup Market Analysis, Insights and Forecast, 2019-2031
- 9.1. Market Analysis, Insights and Forecast - by Rice Type
- 9.1.1. Brown Rice
- 9.1.2. White Rice
- 9.2. Market Analysis, Insights and Forecast - by Category
- 9.2.1. Organic
- 9.2.2. Conventional
- 9.3. Market Analysis, Insights and Forecast - by Application
- 9.3.1. Bakery and Confectionery
- 9.3.2. Beverages
- 9.3.3. Dessert and Dairy
- 9.3.4. Meat, Poultry, and Seafood
- 9.3.5. Instant Formula
- 9.3.6. Other Applications
- 9.1. Market Analysis, Insights and Forecast - by Rice Type
- 10. Middle East and Africa Rice Syrup Market Analysis, Insights and Forecast, 2019-2031
- 10.1. Market Analysis, Insights and Forecast - by Rice Type
- 10.1.1. Brown Rice
- 10.1.2. White Rice
- 10.2. Market Analysis, Insights and Forecast - by Category
- 10.2.1. Organic
- 10.2.2. Conventional
- 10.3. Market Analysis, Insights and Forecast - by Application
- 10.3.1. Bakery and Confectionery
- 10.3.2. Beverages
- 10.3.3. Dessert and Dairy
- 10.3.4. Meat, Poultry, and Seafood
- 10.3.5. Instant Formula
- 10.3.6. Other Applications
- 10.1. Market Analysis, Insights and Forecast - by Rice Type
- 11. North America Rice Syrup Market Analysis, Insights and Forecast, 2019-2031
- 11.1. Market Analysis, Insights and Forecast - By Country/Sub-region
- 11.1.1 United States
- 11.1.2 Canada
- 11.1.3 Mexico
- 11.1.4 Rest of North America
- 12. Europe Rice Syrup Market Analysis, Insights and Forecast, 2019-2031
- 12.1. Market Analysis, Insights and Forecast - By Country/Sub-region
- 12.1.1 Germany
- 12.1.2 United Kingdom
- 12.1.3 France
- 12.1.4 Russia
- 12.1.5 Spain
- 12.1.6 Rest of Europe
- 13. Asia Pacific Rice Syrup Market Analysis, Insights and Forecast, 2019-2031
- 13.1. Market Analysis, Insights and Forecast - By Country/Sub-region
- 13.1.1 China
- 13.1.2 Japan
- 13.1.3 India
- 13.1.4 Australia
- 13.1.5 Rest of Asia Pacific
- 14. South America Rice Syrup Market Analysis, Insights and Forecast, 2019-2031
- 14.1. Market Analysis, Insights and Forecast - By Country/Sub-region
- 14.1.1 Brazil
- 14.1.2 Argentina
- 14.1.3 Rest of South America
- 15. Middle East and Africa Rice Syrup Market Analysis, Insights and Forecast, 2019-2031
- 15.1. Market Analysis, Insights and Forecast - By Country/Sub-region
- 15.1.1 Saudi Arabia
- 15.1.2 South Africa
- 15.1.3 Rest of Middle East and Africa
- 16. Competitive Analysis
- 16.1. Global Market Share Analysis 2024
- 16.2. Company Profiles
- 16.2.1 Cargill Incorporated
- 16.2.1.1. Overview
- 16.2.1.2. Products
- 16.2.1.3. SWOT Analysis
- 16.2.1.4. Recent Developments
- 16.2.1.5. Financials (Based on Availability)
- 16.2.2 Wuhu Deli Foods Co Ltd
- 16.2.2.1. Overview
- 16.2.2.2. Products
- 16.2.2.3. SWOT Analysis
- 16.2.2.4. Recent Developments
- 16.2.2.5. Financials (Based on Availability)
- 16.2.3 Bharat Gluco Industries Pvt Ltd*List Not Exhaustive
- 16.2.3.1. Overview
- 16.2.3.2. Products
- 16.2.3.3. SWOT Analysis
- 16.2.3.4. Recent Developments
- 16.2.3.5. Financials (Based on Availability)
- 16.2.4 Archer Daniels Midland Company
- 16.2.4.1. Overview
- 16.2.4.2. Products
- 16.2.4.3. SWOT Analysis
- 16.2.4.4. Recent Developments
- 16.2.4.5. Financials (Based on Availability)
- 16.2.5 Suzanne's Specialties Inc
- 16.2.5.1. Overview
- 16.2.5.2. Products
- 16.2.5.3. SWOT Analysis
- 16.2.5.4. Recent Developments
- 16.2.5.5. Financials (Based on Availability)
- 16.2.6 Pure Life Organic Foods Ltd
- 16.2.6.1. Overview
- 16.2.6.2. Products
- 16.2.6.3. SWOT Analysis
- 16.2.6.4. Recent Developments
- 16.2.6.5. Financials (Based on Availability)
- 16.2.7 Associated British Foods PLC
- 16.2.7.1. Overview
- 16.2.7.2. Products
- 16.2.7.3. SWOT Analysis
- 16.2.7.4. Recent Developments
- 16.2.7.5. Financials (Based on Availability)
- 16.2.8 Axiom Foods Inc
- 16.2.8.1. Overview
- 16.2.8.2. Products
- 16.2.8.3. SWOT Analysis
- 16.2.8.4. Recent Developments
- 16.2.8.5. Financials (Based on Availability)
- 16.2.9 California Natural Products Inc
- 16.2.9.1. Overview
- 16.2.9.2. Products
- 16.2.9.3. SWOT Analysis
- 16.2.9.4. Recent Developments
- 16.2.9.5. Financials (Based on Availability)
- 16.2.10 Gulshan Polyols Ltd
- 16.2.10.1. Overview
- 16.2.10.2. Products
- 16.2.10.3. SWOT Analysis
- 16.2.10.4. Recent Developments
- 16.2.10.5. Financials (Based on Availability)
- 16.2.1 Cargill Incorporated
List of Figures
- Figure 1: Global Rice Syrup Market Revenue Breakdown (Million, %) by Region 2024 & 2032
- Figure 2: Global Rice Syrup Market Volume Breakdown (Liters, %) by Region 2024 & 2032
- Figure 3: North America Rice Syrup Market Revenue (Million), by Country 2024 & 2032
- Figure 4: North America Rice Syrup Market Volume (Liters), by Country 2024 & 2032
- Figure 5: North America Rice Syrup Market Revenue Share (%), by Country 2024 & 2032
- Figure 6: North America Rice Syrup Market Volume Share (%), by Country 2024 & 2032
- Figure 7: Europe Rice Syrup Market Revenue (Million), by Country 2024 & 2032
- Figure 8: Europe Rice Syrup Market Volume (Liters), by Country 2024 & 2032
- Figure 9: Europe Rice Syrup Market Revenue Share (%), by Country 2024 & 2032
- Figure 10: Europe Rice Syrup Market Volume Share (%), by Country 2024 & 2032
- Figure 11: Asia Pacific Rice Syrup Market Revenue (Million), by Country 2024 & 2032
- Figure 12: Asia Pacific Rice Syrup Market Volume (Liters), by Country 2024 & 2032
- Figure 13: Asia Pacific Rice Syrup Market Revenue Share (%), by Country 2024 & 2032
- Figure 14: Asia Pacific Rice Syrup Market Volume Share (%), by Country 2024 & 2032
- Figure 15: South America Rice Syrup Market Revenue (Million), by Country 2024 & 2032
- Figure 16: South America Rice Syrup Market Volume (Liters), by Country 2024 & 2032
- Figure 17: South America Rice Syrup Market Revenue Share (%), by Country 2024 & 2032
- Figure 18: South America Rice Syrup Market Volume Share (%), by Country 2024 & 2032
- Figure 19: Middle East and Africa Rice Syrup Market Revenue (Million), by Country 2024 & 2032
- Figure 20: Middle East and Africa Rice Syrup Market Volume (Liters), by Country 2024 & 2032
- Figure 21: Middle East and Africa Rice Syrup Market Revenue Share (%), by Country 2024 & 2032
- Figure 22: Middle East and Africa Rice Syrup Market Volume Share (%), by Country 2024 & 2032
- Figure 23: North America Rice Syrup Market Revenue (Million), by Rice Type 2024 & 2032
- Figure 24: North America Rice Syrup Market Volume (Liters), by Rice Type 2024 & 2032
- Figure 25: North America Rice Syrup Market Revenue Share (%), by Rice Type 2024 & 2032
- Figure 26: North America Rice Syrup Market Volume Share (%), by Rice Type 2024 & 2032
- Figure 27: North America Rice Syrup Market Revenue (Million), by Category 2024 & 2032
- Figure 28: North America Rice Syrup Market Volume (Liters), by Category 2024 & 2032
- Figure 29: North America Rice Syrup Market Revenue Share (%), by Category 2024 & 2032
- Figure 30: North America Rice Syrup Market Volume Share (%), by Category 2024 & 2032
- Figure 31: North America Rice Syrup Market Revenue (Million), by Application 2024 & 2032
- Figure 32: North America Rice Syrup Market Volume (Liters), by Application 2024 & 2032
- Figure 33: North America Rice Syrup Market Revenue Share (%), by Application 2024 & 2032
- Figure 34: North America Rice Syrup Market Volume Share (%), by Application 2024 & 2032
- Figure 35: North America Rice Syrup Market Revenue (Million), by Country 2024 & 2032
- Figure 36: North America Rice Syrup Market Volume (Liters), by Country 2024 & 2032
- Figure 37: North America Rice Syrup Market Revenue Share (%), by Country 2024 & 2032
- Figure 38: North America Rice Syrup Market Volume Share (%), by Country 2024 & 2032
- Figure 39: Europe Rice Syrup Market Revenue (Million), by Rice Type 2024 & 2032
- Figure 40: Europe Rice Syrup Market Volume (Liters), by Rice Type 2024 & 2032
- Figure 41: Europe Rice Syrup Market Revenue Share (%), by Rice Type 2024 & 2032
- Figure 42: Europe Rice Syrup Market Volume Share (%), by Rice Type 2024 & 2032
- Figure 43: Europe Rice Syrup Market Revenue (Million), by Category 2024 & 2032
- Figure 44: Europe Rice Syrup Market Volume (Liters), by Category 2024 & 2032
- Figure 45: Europe Rice Syrup Market Revenue Share (%), by Category 2024 & 2032
- Figure 46: Europe Rice Syrup Market Volume Share (%), by Category 2024 & 2032
- Figure 47: Europe Rice Syrup Market Revenue (Million), by Application 2024 & 2032
- Figure 48: Europe Rice Syrup Market Volume (Liters), by Application 2024 & 2032
- Figure 49: Europe Rice Syrup Market Revenue Share (%), by Application 2024 & 2032
- Figure 50: Europe Rice Syrup Market Volume Share (%), by Application 2024 & 2032
- Figure 51: Europe Rice Syrup Market Revenue (Million), by Country 2024 & 2032
- Figure 52: Europe Rice Syrup Market Volume (Liters), by Country 2024 & 2032
- Figure 53: Europe Rice Syrup Market Revenue Share (%), by Country 2024 & 2032
- Figure 54: Europe Rice Syrup Market Volume Share (%), by Country 2024 & 2032
- Figure 55: Asia Pacific Rice Syrup Market Revenue (Million), by Rice Type 2024 & 2032
- Figure 56: Asia Pacific Rice Syrup Market Volume (Liters), by Rice Type 2024 & 2032
- Figure 57: Asia Pacific Rice Syrup Market Revenue Share (%), by Rice Type 2024 & 2032
- Figure 58: Asia Pacific Rice Syrup Market Volume Share (%), by Rice Type 2024 & 2032
- Figure 59: Asia Pacific Rice Syrup Market Revenue (Million), by Category 2024 & 2032
- Figure 60: Asia Pacific Rice Syrup Market Volume (Liters), by Category 2024 & 2032
- Figure 61: Asia Pacific Rice Syrup Market Revenue Share (%), by Category 2024 & 2032
- Figure 62: Asia Pacific Rice Syrup Market Volume Share (%), by Category 2024 & 2032
- Figure 63: Asia Pacific Rice Syrup Market Revenue (Million), by Application 2024 & 2032
- Figure 64: Asia Pacific Rice Syrup Market Volume (Liters), by Application 2024 & 2032
- Figure 65: Asia Pacific Rice Syrup Market Revenue Share (%), by Application 2024 & 2032
- Figure 66: Asia Pacific Rice Syrup Market Volume Share (%), by Application 2024 & 2032
- Figure 67: Asia Pacific Rice Syrup Market Revenue (Million), by Country 2024 & 2032
- Figure 68: Asia Pacific Rice Syrup Market Volume (Liters), by Country 2024 & 2032
- Figure 69: Asia Pacific Rice Syrup Market Revenue Share (%), by Country 2024 & 2032
- Figure 70: Asia Pacific Rice Syrup Market Volume Share (%), by Country 2024 & 2032
- Figure 71: South America Rice Syrup Market Revenue (Million), by Rice Type 2024 & 2032
- Figure 72: South America Rice Syrup Market Volume (Liters), by Rice Type 2024 & 2032
- Figure 73: South America Rice Syrup Market Revenue Share (%), by Rice Type 2024 & 2032
- Figure 74: South America Rice Syrup Market Volume Share (%), by Rice Type 2024 & 2032
- Figure 75: South America Rice Syrup Market Revenue (Million), by Category 2024 & 2032
- Figure 76: South America Rice Syrup Market Volume (Liters), by Category 2024 & 2032
- Figure 77: South America Rice Syrup Market Revenue Share (%), by Category 2024 & 2032
- Figure 78: South America Rice Syrup Market Volume Share (%), by Category 2024 & 2032
- Figure 79: South America Rice Syrup Market Revenue (Million), by Application 2024 & 2032
- Figure 80: South America Rice Syrup Market Volume (Liters), by Application 2024 & 2032
- Figure 81: South America Rice Syrup Market Revenue Share (%), by Application 2024 & 2032
- Figure 82: South America Rice Syrup Market Volume Share (%), by Application 2024 & 2032
- Figure 83: South America Rice Syrup Market Revenue (Million), by Country 2024 & 2032
- Figure 84: South America Rice Syrup Market Volume (Liters), by Country 2024 & 2032
- Figure 85: South America Rice Syrup Market Revenue Share (%), by Country 2024 & 2032
- Figure 86: South America Rice Syrup Market Volume Share (%), by Country 2024 & 2032
- Figure 87: Middle East and Africa Rice Syrup Market Revenue (Million), by Rice Type 2024 & 2032
- Figure 88: Middle East and Africa Rice Syrup Market Volume (Liters), by Rice Type 2024 & 2032
- Figure 89: Middle East and Africa Rice Syrup Market Revenue Share (%), by Rice Type 2024 & 2032
- Figure 90: Middle East and Africa Rice Syrup Market Volume Share (%), by Rice Type 2024 & 2032
- Figure 91: Middle East and Africa Rice Syrup Market Revenue (Million), by Category 2024 & 2032
- Figure 92: Middle East and Africa Rice Syrup Market Volume (Liters), by Category 2024 & 2032
- Figure 93: Middle East and Africa Rice Syrup Market Revenue Share (%), by Category 2024 & 2032
- Figure 94: Middle East and Africa Rice Syrup Market Volume Share (%), by Category 2024 & 2032
- Figure 95: Middle East and Africa Rice Syrup Market Revenue (Million), by Application 2024 & 2032
- Figure 96: Middle East and Africa Rice Syrup Market Volume (Liters), by Application 2024 & 2032
- Figure 97: Middle East and Africa Rice Syrup Market Revenue Share (%), by Application 2024 & 2032
- Figure 98: Middle East and Africa Rice Syrup Market Volume Share (%), by Application 2024 & 2032
- Figure 99: Middle East and Africa Rice Syrup Market Revenue (Million), by Country 2024 & 2032
- Figure 100: Middle East and Africa Rice Syrup Market Volume (Liters), by Country 2024 & 2032
- Figure 101: Middle East and Africa Rice Syrup Market Revenue Share (%), by Country 2024 & 2032
- Figure 102: Middle East and Africa Rice Syrup Market Volume Share (%), by Country 2024 & 2032
List of Tables
- Table 1: Global Rice Syrup Market Revenue Million Forecast, by Region 2019 & 2032
- Table 2: Global Rice Syrup Market Volume Liters Forecast, by Region 2019 & 2032
- Table 3: Global Rice Syrup Market Revenue Million Forecast, by Rice Type 2019 & 2032
- Table 4: Global Rice Syrup Market Volume Liters Forecast, by Rice Type 2019 & 2032
- Table 5: Global Rice Syrup Market Revenue Million Forecast, by Category 2019 & 2032
- Table 6: Global Rice Syrup Market Volume Liters Forecast, by Category 2019 & 2032
- Table 7: Global Rice Syrup Market Revenue Million Forecast, by Application 2019 & 2032
- Table 8: Global Rice Syrup Market Volume Liters Forecast, by Application 2019 & 2032
- Table 9: Global Rice Syrup Market Revenue Million Forecast, by Region 2019 & 2032
- Table 10: Global Rice Syrup Market Volume Liters Forecast, by Region 2019 & 2032
- Table 11: Global Rice Syrup Market Revenue Million Forecast, by Country 2019 & 2032
- Table 12: Global Rice Syrup Market Volume Liters Forecast, by Country 2019 & 2032
- Table 13: United States Rice Syrup Market Revenue (Million) Forecast, by Application 2019 & 2032
- Table 14: United States Rice Syrup Market Volume (Liters) Forecast, by Application 2019 & 2032
- Table 15: Canada Rice Syrup Market Revenue (Million) Forecast, by Application 2019 & 2032
- Table 16: Canada Rice Syrup Market Volume (Liters) Forecast, by Application 2019 & 2032
- Table 17: Mexico Rice Syrup Market Revenue (Million) Forecast, by Application 2019 & 2032
- Table 18: Mexico Rice Syrup Market Volume (Liters) Forecast, by Application 2019 & 2032
- Table 19: Rest of North America Rice Syrup Market Revenue (Million) Forecast, by Application 2019 & 2032
- Table 20: Rest of North America Rice Syrup Market Volume (Liters) Forecast, by Application 2019 & 2032
- Table 21: Global Rice Syrup Market Revenue Million Forecast, by Country 2019 & 2032
- Table 22: Global Rice Syrup Market Volume Liters Forecast, by Country 2019 & 2032
- Table 23: Germany Rice Syrup Market Revenue (Million) Forecast, by Application 2019 & 2032
- Table 24: Germany Rice Syrup Market Volume (Liters) Forecast, by Application 2019 & 2032
- Table 25: United Kingdom Rice Syrup Market Revenue (Million) Forecast, by Application 2019 & 2032
- Table 26: United Kingdom Rice Syrup Market Volume (Liters) Forecast, by Application 2019 & 2032
- Table 27: France Rice Syrup Market Revenue (Million) Forecast, by Application 2019 & 2032
- Table 28: France Rice Syrup Market Volume (Liters) Forecast, by Application 2019 & 2032
- Table 29: Russia Rice Syrup Market Revenue (Million) Forecast, by Application 2019 & 2032
- Table 30: Russia Rice Syrup Market Volume (Liters) Forecast, by Application 2019 & 2032
- Table 31: Spain Rice Syrup Market Revenue (Million) Forecast, by Application 2019 & 2032
- Table 32: Spain Rice Syrup Market Volume (Liters) Forecast, by Application 2019 & 2032
- Table 33: Rest of Europe Rice Syrup Market Revenue (Million) Forecast, by Application 2019 & 2032
- Table 34: Rest of Europe Rice Syrup Market Volume (Liters) Forecast, by Application 2019 & 2032
- Table 35: Global Rice Syrup Market Revenue Million Forecast, by Country 2019 & 2032
- Table 36: Global Rice Syrup Market Volume Liters Forecast, by Country 2019 & 2032
- Table 37: China Rice Syrup Market Revenue (Million) Forecast, by Application 2019 & 2032
- Table 38: China Rice Syrup Market Volume (Liters) Forecast, by Application 2019 & 2032
- Table 39: Japan Rice Syrup Market Revenue (Million) Forecast, by Application 2019 & 2032
- Table 40: Japan Rice Syrup Market Volume (Liters) Forecast, by Application 2019 & 2032
- Table 41: India Rice Syrup Market Revenue (Million) Forecast, by Application 2019 & 2032
- Table 42: India Rice Syrup Market Volume (Liters) Forecast, by Application 2019 & 2032
- Table 43: Australia Rice Syrup Market Revenue (Million) Forecast, by Application 2019 & 2032
- Table 44: Australia Rice Syrup Market Volume (Liters) Forecast, by Application 2019 & 2032
- Table 45: Rest of Asia Pacific Rice Syrup Market Revenue (Million) Forecast, by Application 2019 & 2032
- Table 46: Rest of Asia Pacific Rice Syrup Market Volume (Liters) Forecast, by Application 2019 & 2032
- Table 47: Global Rice Syrup Market Revenue Million Forecast, by Country 2019 & 2032
- Table 48: Global Rice Syrup Market Volume Liters Forecast, by Country 2019 & 2032
- Table 49: Brazil Rice Syrup Market Revenue (Million) Forecast, by Application 2019 & 2032
- Table 50: Brazil Rice Syrup Market Volume (Liters) Forecast, by Application 2019 & 2032
- Table 51: Argentina Rice Syrup Market Revenue (Million) Forecast, by Application 2019 & 2032
- Table 52: Argentina Rice Syrup Market Volume (Liters) Forecast, by Application 2019 & 2032
- Table 53: Rest of South America Rice Syrup Market Revenue (Million) Forecast, by Application 2019 & 2032
- Table 54: Rest of South America Rice Syrup Market Volume (Liters) Forecast, by Application 2019 & 2032
- Table 55: Global Rice Syrup Market Revenue Million Forecast, by Country 2019 & 2032
- Table 56: Global Rice Syrup Market Volume Liters Forecast, by Country 2019 & 2032
- Table 57: Saudi Arabia Rice Syrup Market Revenue (Million) Forecast, by Application 2019 & 2032
- Table 58: Saudi Arabia Rice Syrup Market Volume (Liters) Forecast, by Application 2019 & 2032
- Table 59: South Africa Rice Syrup Market Revenue (Million) Forecast, by Application 2019 & 2032
- Table 60: South Africa Rice Syrup Market Volume (Liters) Forecast, by Application 2019 & 2032
- Table 61: Rest of Middle East and Africa Rice Syrup Market Revenue (Million) Forecast, by Application 2019 & 2032
- Table 62: Rest of Middle East and Africa Rice Syrup Market Volume (Liters) Forecast, by Application 2019 & 2032
- Table 63: Global Rice Syrup Market Revenue Million Forecast, by Rice Type 2019 & 2032
- Table 64: Global Rice Syrup Market Volume Liters Forecast, by Rice Type 2019 & 2032
- Table 65: Global Rice Syrup Market Revenue Million Forecast, by Category 2019 & 2032
- Table 66: Global Rice Syrup Market Volume Liters Forecast, by Category 2019 & 2032
- Table 67: Global Rice Syrup Market Revenue Million Forecast, by Application 2019 & 2032
- Table 68: Global Rice Syrup Market Volume Liters Forecast, by Application 2019 & 2032
- Table 69: Global Rice Syrup Market Revenue Million Forecast, by Country 2019 & 2032
- Table 70: Global Rice Syrup Market Volume Liters Forecast, by Country 2019 & 2032
- Table 71: United States Rice Syrup Market Revenue (Million) Forecast, by Application 2019 & 2032
- Table 72: United States Rice Syrup Market Volume (Liters) Forecast, by Application 2019 & 2032
- Table 73: Canada Rice Syrup Market Revenue (Million) Forecast, by Application 2019 & 2032
- Table 74: Canada Rice Syrup Market Volume (Liters) Forecast, by Application 2019 & 2032
- Table 75: Mexico Rice Syrup Market Revenue (Million) Forecast, by Application 2019 & 2032
- Table 76: Mexico Rice Syrup Market Volume (Liters) Forecast, by Application 2019 & 2032
- Table 77: Rest of North America Rice Syrup Market Revenue (Million) Forecast, by Application 2019 & 2032
- Table 78: Rest of North America Rice Syrup Market Volume (Liters) Forecast, by Application 2019 & 2032
- Table 79: Global Rice Syrup Market Revenue Million Forecast, by Rice Type 2019 & 2032
- Table 80: Global Rice Syrup Market Volume Liters Forecast, by Rice Type 2019 & 2032
- Table 81: Global Rice Syrup Market Revenue Million Forecast, by Category 2019 & 2032
- Table 82: Global Rice Syrup Market Volume Liters Forecast, by Category 2019 & 2032
- Table 83: Global Rice Syrup Market Revenue Million Forecast, by Application 2019 & 2032
- Table 84: Global Rice Syrup Market Volume Liters Forecast, by Application 2019 & 2032
- Table 85: Global Rice Syrup Market Revenue Million Forecast, by Country 2019 & 2032
- Table 86: Global Rice Syrup Market Volume Liters Forecast, by Country 2019 & 2032
- Table 87: Germany Rice Syrup Market Revenue (Million) Forecast, by Application 2019 & 2032
- Table 88: Germany Rice Syrup Market Volume (Liters) Forecast, by Application 2019 & 2032
- Table 89: United Kingdom Rice Syrup Market Revenue (Million) Forecast, by Application 2019 & 2032
- Table 90: United Kingdom Rice Syrup Market Volume (Liters) Forecast, by Application 2019 & 2032
- Table 91: France Rice Syrup Market Revenue (Million) Forecast, by Application 2019 & 2032
- Table 92: France Rice Syrup Market Volume (Liters) Forecast, by Application 2019 & 2032
- Table 93: Russia Rice Syrup Market Revenue (Million) Forecast, by Application 2019 & 2032
- Table 94: Russia Rice Syrup Market Volume (Liters) Forecast, by Application 2019 & 2032
- Table 95: Spain Rice Syrup Market Revenue (Million) Forecast, by Application 2019 & 2032
- Table 96: Spain Rice Syrup Market Volume (Liters) Forecast, by Application 2019 & 2032
- Table 97: Rest of Europe Rice Syrup Market Revenue (Million) Forecast, by Application 2019 & 2032
- Table 98: Rest of Europe Rice Syrup Market Volume (Liters) Forecast, by Application 2019 & 2032
- Table 99: Global Rice Syrup Market Revenue Million Forecast, by Rice Type 2019 & 2032
- Table 100: Global Rice Syrup Market Volume Liters Forecast, by Rice Type 2019 & 2032
- Table 101: Global Rice Syrup Market Revenue Million Forecast, by Category 2019 & 2032
- Table 102: Global Rice Syrup Market Volume Liters Forecast, by Category 2019 & 2032
- Table 103: Global Rice Syrup Market Revenue Million Forecast, by Application 2019 & 2032
- Table 104: Global Rice Syrup Market Volume Liters Forecast, by Application 2019 & 2032
- Table 105: Global Rice Syrup Market Revenue Million Forecast, by Country 2019 & 2032
- Table 106: Global Rice Syrup Market Volume Liters Forecast, by Country 2019 & 2032
- Table 107: China Rice Syrup Market Revenue (Million) Forecast, by Application 2019 & 2032
- Table 108: China Rice Syrup Market Volume (Liters) Forecast, by Application 2019 & 2032
- Table 109: Japan Rice Syrup Market Revenue (Million) Forecast, by Application 2019 & 2032
- Table 110: Japan Rice Syrup Market Volume (Liters) Forecast, by Application 2019 & 2032
- Table 111: India Rice Syrup Market Revenue (Million) Forecast, by Application 2019 & 2032
- Table 112: India Rice Syrup Market Volume (Liters) Forecast, by Application 2019 & 2032
- Table 113: Australia Rice Syrup Market Revenue (Million) Forecast, by Application 2019 & 2032
- Table 114: Australia Rice Syrup Market Volume (Liters) Forecast, by Application 2019 & 2032
- Table 115: Rest of Asia Pacific Rice Syrup Market Revenue (Million) Forecast, by Application 2019 & 2032
- Table 116: Rest of Asia Pacific Rice Syrup Market Volume (Liters) Forecast, by Application 2019 & 2032
- Table 117: Global Rice Syrup Market Revenue Million Forecast, by Rice Type 2019 & 2032
- Table 118: Global Rice Syrup Market Volume Liters Forecast, by Rice Type 2019 & 2032
- Table 119: Global Rice Syrup Market Revenue Million Forecast, by Category 2019 & 2032
- Table 120: Global Rice Syrup Market Volume Liters Forecast, by Category 2019 & 2032
- Table 121: Global Rice Syrup Market Revenue Million Forecast, by Application 2019 & 2032
- Table 122: Global Rice Syrup Market Volume Liters Forecast, by Application 2019 & 2032
- Table 123: Global Rice Syrup Market Revenue Million Forecast, by Country 2019 & 2032
- Table 124: Global Rice Syrup Market Volume Liters Forecast, by Country 2019 & 2032
- Table 125: Brazil Rice Syrup Market Revenue (Million) Forecast, by Application 2019 & 2032
- Table 126: Brazil Rice Syrup Market Volume (Liters) Forecast, by Application 2019 & 2032
- Table 127: Argentina Rice Syrup Market Revenue (Million) Forecast, by Application 2019 & 2032
- Table 128: Argentina Rice Syrup Market Volume (Liters) Forecast, by Application 2019 & 2032
- Table 129: Rest of South America Rice Syrup Market Revenue (Million) Forecast, by Application 2019 & 2032
- Table 130: Rest of South America Rice Syrup Market Volume (Liters) Forecast, by Application 2019 & 2032
- Table 131: Global Rice Syrup Market Revenue Million Forecast, by Rice Type 2019 & 2032
- Table 132: Global Rice Syrup Market Volume Liters Forecast, by Rice Type 2019 & 2032
- Table 133: Global Rice Syrup Market Revenue Million Forecast, by Category 2019 & 2032
- Table 134: Global Rice Syrup Market Volume Liters Forecast, by Category 2019 & 2032
- Table 135: Global Rice Syrup Market Revenue Million Forecast, by Application 2019 & 2032
- Table 136: Global Rice Syrup Market Volume Liters Forecast, by Application 2019 & 2032
- Table 137: Global Rice Syrup Market Revenue Million Forecast, by Country 2019 & 2032
- Table 138: Global Rice Syrup Market Volume Liters Forecast, by Country 2019 & 2032
- Table 139: Saudi Arabia Rice Syrup Market Revenue (Million) Forecast, by Application 2019 & 2032
- Table 140: Saudi Arabia Rice Syrup Market Volume (Liters) Forecast, by Application 2019 & 2032
- Table 141: South Africa Rice Syrup Market Revenue (Million) Forecast, by Application 2019 & 2032
- Table 142: South Africa Rice Syrup Market Volume (Liters) Forecast, by Application 2019 & 2032
- Table 143: Rest of Middle East and Africa Rice Syrup Market Revenue (Million) Forecast, by Application 2019 & 2032
- Table 144: Rest of Middle East and Africa Rice Syrup Market Volume (Liters) Forecast, by Application 2019 & 2032
Frequently Asked Questions
1. What is the projected Compound Annual Growth Rate (CAGR) of the Rice Syrup Market?
The projected CAGR is approximately 4.10%.
2. Which companies are prominent players in the Rice Syrup Market?
Key companies in the market include Cargill Incorporated, Wuhu Deli Foods Co Ltd, Bharat Gluco Industries Pvt Ltd*List Not Exhaustive, Archer Daniels Midland Company, Suzanne's Specialties Inc, Pure Life Organic Foods Ltd, Associated British Foods PLC, Axiom Foods Inc, California Natural Products Inc, Gulshan Polyols Ltd.
3. What are the main segments of the Rice Syrup Market?
The market segments include Rice Type, Category , Application.
4. Can you provide details about the market size?
The market size is estimated to be USD 825.3 Million as of 2022.
5. What are some drivers contributing to market growth?
Increasing Demand For Convenience & Processed Food.
6. What are the notable trends driving market growth?
Rising Demand for Natural Sweetener.
7. Are there any restraints impacting market growth?
Increased Consumer Awareness On Side-Effects Of Chemical Additives.
8. Can you provide examples of recent developments in the market?
N/A
9. What pricing options are available for accessing the report?
Pricing options include single-user, multi-user, and enterprise licenses priced at USD 4750, USD 5250, and USD 8750 respectively.
10. Is the market size provided in terms of value or volume?
The market size is provided in terms of value, measured in Million and volume, measured in Liters.
11. Are there any specific market keywords associated with the report?
Yes, the market keyword associated with the report is "Rice Syrup Market," which aids in identifying and referencing the specific market segment covered.
12. How do I determine which pricing option suits my needs best?
The pricing options vary based on user requirements and access needs. Individual users may opt for single-user licenses, while businesses requiring broader access may choose multi-user or enterprise licenses for cost-effective access to the report.
13. Are there any additional resources or data provided in the Rice Syrup Market report?
While the report offers comprehensive insights, it's advisable to review the specific contents or supplementary materials provided to ascertain if additional resources or data are available.
14. How can I stay updated on further developments or reports in the Rice Syrup Market?
To stay informed about further developments, trends, and reports in the Rice Syrup Market, consider subscribing to industry newsletters, following relevant companies and organizations, or regularly checking reputable industry news sources and publications.
Methodology
Step 1 - Identification of Relevant Samples Size from Population Database


Step 2 - Approaches for Defining Global Market Size (Value, Volume* & Price*)

Note*: In applicable scenarios
Step 3 - Data Sources
Primary Research
- Web Analytics
- Survey Reports
- Research Institute
- Latest Research Reports
- Opinion Leaders
Secondary Research
- Annual Reports
- White Paper
- Latest Press Release
- Industry Association
- Paid Database
- Investor Presentations

Step 4 - Data Triangulation
Involves using different sources of information in order to increase the validity of a study
These sources are likely to be stakeholders in a program - participants, other researchers, program staff, other community members, and so on.
Then we put all data in single framework & apply various statistical tools to find out the dynamic on the market.
During the analysis stage, feedback from the stakeholder groups would be compared to determine areas of agreement as well as areas of divergence


