
Key Insights
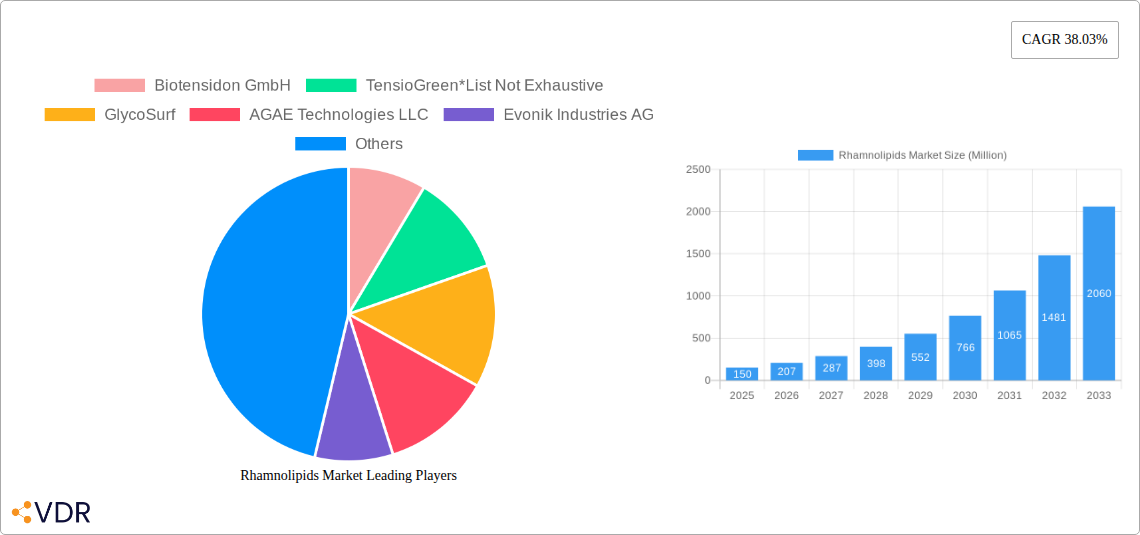
The global rhamnolipids market is experiencing robust growth, projected to reach a substantial size by 2033, driven by a 38.03% CAGR from 2025 to 2033. This expansion is fueled by increasing demand across diverse sectors. The surge in the bio-based and sustainable chemicals market is a primary driver, with rhamnolipids offering a compelling eco-friendly alternative to conventional surfactants. Growing awareness of environmental concerns and stringent regulations concerning petroleum-based surfactants are further bolstering market growth. Significant applications are found in the surfactant industry, where rhamnolipids provide superior biodegradability and effectiveness in cleaning and emulsifying processes. The cosmetics industry utilizes their mildness and moisturizing properties, while the agricultural sector leverages their biocontrol capabilities and potential as biostimulants. Furthermore, the pharmaceutical and food industries are exploring their applications as drug delivery systems and food additives respectively. The market segmentation reveals significant opportunities within mono- and di-rhamnolipids, each catering to specific industry needs. Geographical analysis reveals strong regional growth, particularly in North America and Europe, driven by early adoption and established regulatory frameworks. However, Asia-Pacific presents a significant growth potential given the rapidly expanding industries and increasing focus on sustainable practices.
Despite the market's strong growth trajectory, certain challenges persist. High production costs associated with the fermentation process are a primary restraint. Furthermore, standardization and consistency in product quality remain significant hurdles to overcome. Nevertheless, ongoing research and development focused on optimizing production methods and enhancing product efficacy promise to address these limitations and pave the way for continued market expansion. Major players in the market, including Biotensidon GmbH, TensioGreen, GlycoSurf, AGAE Technologies LLC, Evonik Industries AG, Stepan Company, Jeneil Biotech, and DEGUAN Biosurfactant Supplier, are actively engaged in enhancing product portfolios and expanding market reach through strategic collaborations and innovative product development. The diverse range of applications and the inherent sustainability of rhamnolipids ensure this market's sustained growth, making it an attractive sector for investment and innovation.
Rhamnolipids Market: A Comprehensive Report (2019-2033)
This comprehensive report provides an in-depth analysis of the global Rhamnolipids market, encompassing market dynamics, growth trends, regional analysis, competitive landscape, and future outlook. The study period covers 2019-2033, with 2025 as the base and estimated year. The report segments the market by Type (Mono-Rhamnolipids, Di-Rhamnolipids) and Application (Surfactants, Cosmetics, Agriculture, Food, Pharmaceutical, Other Applications), offering granular insights into the parent and child markets. The total market size is projected to reach xx Million by 2033.
Rhamnolipids Market Dynamics & Structure
The rhamnolipids market exhibits a moderately consolidated structure, with key players such as Biotensidon GmbH, TensioGreen, GlycoSurf, AGAE Technologies LLC, Evonik Industries AG, Stepan Company, Jeneil Biotech, and DEGUAN Biosurfactant Supplier holding significant market share. Technological innovation, particularly in fermentation processes, is a major driver, while regulatory frameworks governing bio-based products influence market growth. The market faces competition from conventional chemical surfactants, and the increasing adoption of sustainable solutions is shaping consumer preferences. M&A activity remains moderate, with a projected xx number of deals within the forecast period.
- Market Concentration: Moderately Consolidated (xx% market share held by top 5 players in 2025)
- Technological Innovation: Focus on improving fermentation yields and reducing production costs.
- Regulatory Landscape: Stringent regulations on bio-based products in some regions.
- Competitive Substitutes: Traditional chemical surfactants pose a significant competitive threat.
- End-User Demographics: Growing demand from cosmetics, agriculture, and pharmaceutical sectors.
- M&A Trends: Moderate activity with a predicted xx number of deals between 2025 and 2033.
Rhamnolipids Market Growth Trends & Insights
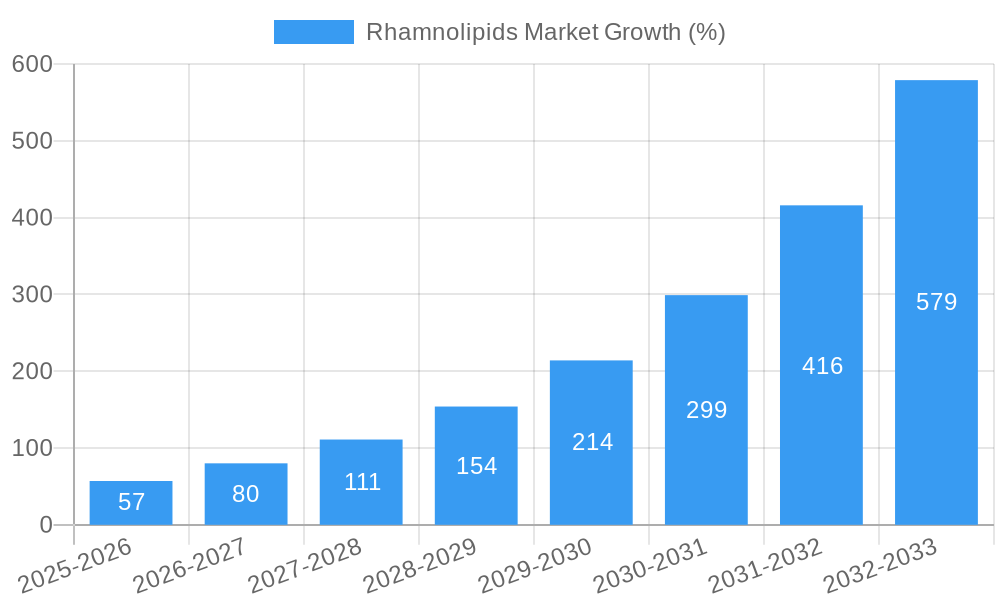
The global rhamnolipids market is witnessing robust growth, driven by the increasing demand for eco-friendly alternatives to synthetic surfactants. The market size experienced a CAGR of xx% during the historical period (2019-2024) and is projected to grow at a CAGR of xx% from 2025 to 2033. This growth is fueled by rising consumer awareness regarding environmental sustainability and the increasing adoption of bio-based products across various sectors. Technological advancements, such as improved fermentation techniques, are further enhancing the market's growth trajectory. Market penetration in key application areas, like cosmetics and agriculture, is steadily increasing. Consumer behavior shifts towards sustainable and ethically sourced products are also significant drivers.
Dominant Regions, Countries, or Segments in Rhamnolipids Market
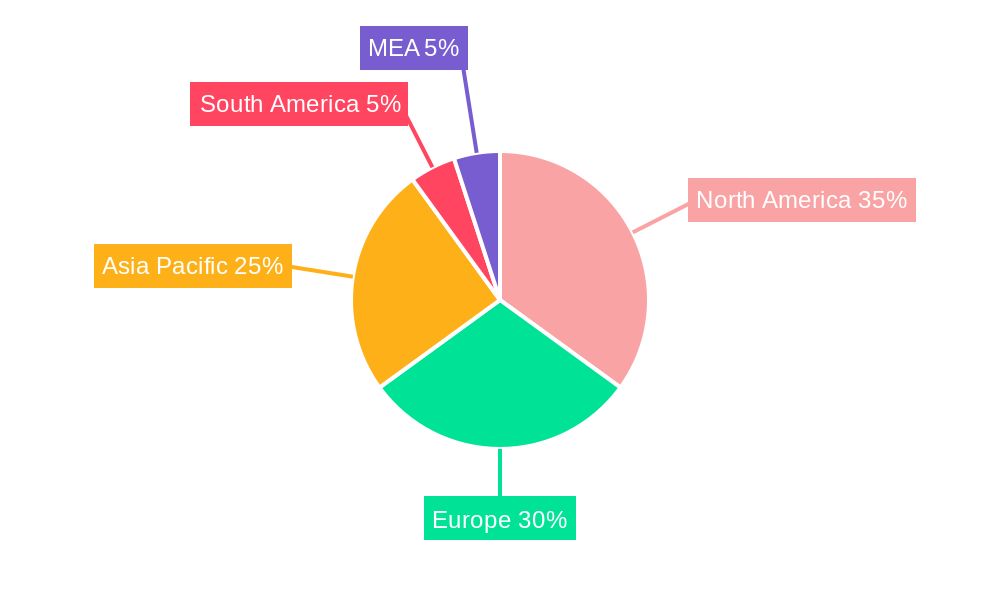
North America currently holds the largest market share due to strong demand from the cosmetics and pharmaceutical sectors. Europe is also experiencing significant growth, driven by supportive government policies and regulations favoring bio-based products. The Di-Rhamnolipids segment holds a larger market share compared to Mono-Rhamnolipids, owing to its superior surface-active properties. Within applications, the surfactant segment is dominant, followed by the cosmetic and agricultural sectors.
- Key Drivers:
- Strong regulatory support for bio-based products in Europe and North America.
- Increasing consumer preference for sustainable and eco-friendly products.
- Growing demand from various industries including cosmetics, agriculture, and pharmaceuticals.
- Regional Dominance: North America holds the largest market share, followed by Europe.
- Segment Dominance: Di-Rhamnolipids and the surfactant application segment are leading.
Rhamnolipids Market Product Landscape
Rhamnolipids are witnessing continuous product innovations, primarily focused on improving their performance characteristics, such as enhanced emulsification and foaming properties. These advancements are driven by ongoing research into novel microbial strains and optimized fermentation processes. Companies are focusing on developing customized rhamnolipid formulations tailored to meet the specific requirements of different applications, leading to unique selling propositions based on enhanced efficacy and cost-effectiveness.
Key Drivers, Barriers & Challenges in Rhamnolipids Market
Key Drivers:
- Growing demand for sustainable and biodegradable surfactants.
- Increasing awareness regarding environmental concerns and reduced carbon footprint.
- Favorable government regulations and incentives for bio-based products.
Key Challenges and Restraints:
- High production costs compared to traditional chemical surfactants.
- Fluctuations in raw material prices impacting profitability.
- Limited availability of suitable microbial strains for efficient rhamnolipid production.
Emerging Opportunities in Rhamnolipids Market
Untapped markets in developing economies present significant opportunities. Innovative applications in areas such as bioremediation and enhanced oil recovery hold substantial potential. The growing demand for high-performance bio-based ingredients in cosmetics and personal care products opens doors for market expansion.
Growth Accelerators in the Rhamnolipids Market Industry
Technological breakthroughs in fermentation processes, resulting in higher yields and reduced production costs, are crucial growth catalysts. Strategic partnerships between rhamnolipid producers and end-users across various sectors are fostering market expansion. Expansion into new geographic markets and exploration of novel applications are vital for sustained long-term growth.
Key Players Shaping the Rhamnolipids Market Market
- Biotensidon GmbH
- TensioGreen
- GlycoSurf
- AGAE Technologies LLC
- Evonik Industries AG
- Stepan Company
- Jeneil Biotech
- DEGUAN Biosurfactant Supplier
Notable Milestones in Rhamnolipids Market Sector
- September 2022: AGAE Technologies, LLC announced a significant breakthrough in rhamnolipid production, achieving a 200% yield increase and a 67% reduction in production costs through optimized fermentation techniques.
- June 2022: Evonik Industries AG invested a three-digit million-euro sum in a new rhamnolipid production plant in Slovakia, signaling a significant commitment to expanding its market presence.
In-Depth Rhamnolipids Market Market Outlook
The rhamnolipids market is poised for continued robust growth, driven by technological advancements, increasing environmental awareness, and expanding applications across diverse sectors. Strategic partnerships and market expansion into untapped regions will be key to realizing the significant future market potential. The market offers lucrative opportunities for both established players and new entrants who can leverage technological innovations and cater to the growing demand for sustainable solutions.
Rhamnolipids Market Segmentation
-
1. Type
- 1.1. Mono-Rhamnolipids
- 1.2. Di-Rhamnolipids
-
2. Application
- 2.1. Surfactants
- 2.2. Cosmetics
- 2.3. Agriculture
- 2.4. Food
- 2.5. Pharmaceutical
- 2.6. Other Applications
Rhamnolipids Market Segmentation By Geography
- 1. Asia Pacific
- 2. North America
- 3. Europe
- 4. South America
- 5. Middle East and Africa
Rhamnolipids Market REPORT HIGHLIGHTS
| Aspects | Details |
|---|---|
| Study Period | 2019-2033 |
| Base Year | 2024 |
| Estimated Year | 2025 |
| Forecast Period | 2025-2033 |
| Historical Period | 2019-2024 |
| Growth Rate | CAGR of 38.03% from 2019-2033 |
| Segmentation |
|
Table of Contents
- 1. Introduction
- 1.1. Research Scope
- 1.2. Market Segmentation
- 1.3. Research Methodology
- 1.4. Definitions and Assumptions
- 2. Executive Summary
- 2.1. Introduction
- 3. Market Dynamics
- 3.1. Introduction
- 3.2. Market Drivers
- 3.2.1. Emergence of Eco-friendly Surfactant; Increasing Demand For Personal Care Products
- 3.3. Market Restrains
- 3.3.1. Limitation in the Production of Rhamnolipids on an Industrial Scale
- 3.4. Market Trends
- 3.4.1. Growing Demand of Rhamnolipids from Surfactants
- 4. Market Factor Analysis
- 4.1. Porters Five Forces
- 4.2. Supply/Value Chain
- 4.3. PESTEL analysis
- 4.4. Market Entropy
- 4.5. Patent/Trademark Analysis
- 5. Global Rhamnolipids Market Analysis, Insights and Forecast, 2019-2031
- 5.1. Market Analysis, Insights and Forecast - by Type
- 5.1.1. Mono-Rhamnolipids
- 5.1.2. Di-Rhamnolipids
- 5.2. Market Analysis, Insights and Forecast - by Application
- 5.2.1. Surfactants
- 5.2.2. Cosmetics
- 5.2.3. Agriculture
- 5.2.4. Food
- 5.2.5. Pharmaceutical
- 5.2.6. Other Applications
- 5.3. Market Analysis, Insights and Forecast - by Region
- 5.3.1. Asia Pacific
- 5.3.2. North America
- 5.3.3. Europe
- 5.3.4. South America
- 5.3.5. Middle East and Africa
- 5.1. Market Analysis, Insights and Forecast - by Type
- 6. Asia Pacific Rhamnolipids Market Analysis, Insights and Forecast, 2019-2031
- 6.1. Market Analysis, Insights and Forecast - by Type
- 6.1.1. Mono-Rhamnolipids
- 6.1.2. Di-Rhamnolipids
- 6.2. Market Analysis, Insights and Forecast - by Application
- 6.2.1. Surfactants
- 6.2.2. Cosmetics
- 6.2.3. Agriculture
- 6.2.4. Food
- 6.2.5. Pharmaceutical
- 6.2.6. Other Applications
- 6.1. Market Analysis, Insights and Forecast - by Type
- 7. North America Rhamnolipids Market Analysis, Insights and Forecast, 2019-2031
- 7.1. Market Analysis, Insights and Forecast - by Type
- 7.1.1. Mono-Rhamnolipids
- 7.1.2. Di-Rhamnolipids
- 7.2. Market Analysis, Insights and Forecast - by Application
- 7.2.1. Surfactants
- 7.2.2. Cosmetics
- 7.2.3. Agriculture
- 7.2.4. Food
- 7.2.5. Pharmaceutical
- 7.2.6. Other Applications
- 7.1. Market Analysis, Insights and Forecast - by Type
- 8. Europe Rhamnolipids Market Analysis, Insights and Forecast, 2019-2031
- 8.1. Market Analysis, Insights and Forecast - by Type
- 8.1.1. Mono-Rhamnolipids
- 8.1.2. Di-Rhamnolipids
- 8.2. Market Analysis, Insights and Forecast - by Application
- 8.2.1. Surfactants
- 8.2.2. Cosmetics
- 8.2.3. Agriculture
- 8.2.4. Food
- 8.2.5. Pharmaceutical
- 8.2.6. Other Applications
- 8.1. Market Analysis, Insights and Forecast - by Type
- 9. South America Rhamnolipids Market Analysis, Insights and Forecast, 2019-2031
- 9.1. Market Analysis, Insights and Forecast - by Type
- 9.1.1. Mono-Rhamnolipids
- 9.1.2. Di-Rhamnolipids
- 9.2. Market Analysis, Insights and Forecast - by Application
- 9.2.1. Surfactants
- 9.2.2. Cosmetics
- 9.2.3. Agriculture
- 9.2.4. Food
- 9.2.5. Pharmaceutical
- 9.2.6. Other Applications
- 9.1. Market Analysis, Insights and Forecast - by Type
- 10. Middle East and Africa Rhamnolipids Market Analysis, Insights and Forecast, 2019-2031
- 10.1. Market Analysis, Insights and Forecast - by Type
- 10.1.1. Mono-Rhamnolipids
- 10.1.2. Di-Rhamnolipids
- 10.2. Market Analysis, Insights and Forecast - by Application
- 10.2.1. Surfactants
- 10.2.2. Cosmetics
- 10.2.3. Agriculture
- 10.2.4. Food
- 10.2.5. Pharmaceutical
- 10.2.6. Other Applications
- 10.1. Market Analysis, Insights and Forecast - by Type
- 11. North America Rhamnolipids Market Analysis, Insights and Forecast, 2019-2031
- 11.1. Market Analysis, Insights and Forecast - By Country/Sub-region
- 11.1.1 United States
- 11.1.2 Canada
- 11.1.3 Mexico
- 12. Europe Rhamnolipids Market Analysis, Insights and Forecast, 2019-2031
- 12.1. Market Analysis, Insights and Forecast - By Country/Sub-region
- 12.1.1 Germany
- 12.1.2 United Kingdom
- 12.1.3 France
- 12.1.4 Spain
- 12.1.5 Italy
- 12.1.6 Spain
- 12.1.7 Belgium
- 12.1.8 Netherland
- 12.1.9 Nordics
- 12.1.10 Rest of Europe
- 13. Asia Pacific Rhamnolipids Market Analysis, Insights and Forecast, 2019-2031
- 13.1. Market Analysis, Insights and Forecast - By Country/Sub-region
- 13.1.1 China
- 13.1.2 Japan
- 13.1.3 India
- 13.1.4 South Korea
- 13.1.5 Southeast Asia
- 13.1.6 Australia
- 13.1.7 Indonesia
- 13.1.8 Phillipes
- 13.1.9 Singapore
- 13.1.10 Thailandc
- 13.1.11 Rest of Asia Pacific
- 14. South America Rhamnolipids Market Analysis, Insights and Forecast, 2019-2031
- 14.1. Market Analysis, Insights and Forecast - By Country/Sub-region
- 14.1.1 Brazil
- 14.1.2 Argentina
- 14.1.3 Peru
- 14.1.4 Chile
- 14.1.5 Colombia
- 14.1.6 Ecuador
- 14.1.7 Venezuela
- 14.1.8 Rest of South America
- 15. North America Rhamnolipids Market Analysis, Insights and Forecast, 2019-2031
- 15.1. Market Analysis, Insights and Forecast - By Country/Sub-region
- 15.1.1 United States
- 15.1.2 Canada
- 15.1.3 Mexico
- 16. MEA Rhamnolipids Market Analysis, Insights and Forecast, 2019-2031
- 16.1. Market Analysis, Insights and Forecast - By Country/Sub-region
- 16.1.1 United Arab Emirates
- 16.1.2 Saudi Arabia
- 16.1.3 South Africa
- 16.1.4 Rest of Middle East and Africa
- 17. Competitive Analysis
- 17.1. Global Market Share Analysis 2024
- 17.2. Company Profiles
- 17.2.1 Biotensidon GmbH
- 17.2.1.1. Overview
- 17.2.1.2. Products
- 17.2.1.3. SWOT Analysis
- 17.2.1.4. Recent Developments
- 17.2.1.5. Financials (Based on Availability)
- 17.2.2 TensioGreen*List Not Exhaustive
- 17.2.2.1. Overview
- 17.2.2.2. Products
- 17.2.2.3. SWOT Analysis
- 17.2.2.4. Recent Developments
- 17.2.2.5. Financials (Based on Availability)
- 17.2.3 GlycoSurf
- 17.2.3.1. Overview
- 17.2.3.2. Products
- 17.2.3.3. SWOT Analysis
- 17.2.3.4. Recent Developments
- 17.2.3.5. Financials (Based on Availability)
- 17.2.4 AGAE Technologies LLC
- 17.2.4.1. Overview
- 17.2.4.2. Products
- 17.2.4.3. SWOT Analysis
- 17.2.4.4. Recent Developments
- 17.2.4.5. Financials (Based on Availability)
- 17.2.5 Evonik Industries AG
- 17.2.5.1. Overview
- 17.2.5.2. Products
- 17.2.5.3. SWOT Analysis
- 17.2.5.4. Recent Developments
- 17.2.5.5. Financials (Based on Availability)
- 17.2.6 Stepan Company
- 17.2.6.1. Overview
- 17.2.6.2. Products
- 17.2.6.3. SWOT Analysis
- 17.2.6.4. Recent Developments
- 17.2.6.5. Financials (Based on Availability)
- 17.2.7 Jeneil Biotech
- 17.2.7.1. Overview
- 17.2.7.2. Products
- 17.2.7.3. SWOT Analysis
- 17.2.7.4. Recent Developments
- 17.2.7.5. Financials (Based on Availability)
- 17.2.8 DEGUAN Biosurfactant Supplier
- 17.2.8.1. Overview
- 17.2.8.2. Products
- 17.2.8.3. SWOT Analysis
- 17.2.8.4. Recent Developments
- 17.2.8.5. Financials (Based on Availability)
- 17.2.1 Biotensidon GmbH
List of Figures
- Figure 1: Global Rhamnolipids Market Revenue Breakdown (Million, %) by Region 2024 & 2032
- Figure 2: Global Rhamnolipids Market Volume Breakdown (Million, %) by Region 2024 & 2032
- Figure 3: North America Rhamnolipids Market Revenue (Million), by Country 2024 & 2032
- Figure 4: North America Rhamnolipids Market Volume (Million), by Country 2024 & 2032
- Figure 5: North America Rhamnolipids Market Revenue Share (%), by Country 2024 & 2032
- Figure 6: North America Rhamnolipids Market Volume Share (%), by Country 2024 & 2032
- Figure 7: Europe Rhamnolipids Market Revenue (Million), by Country 2024 & 2032
- Figure 8: Europe Rhamnolipids Market Volume (Million), by Country 2024 & 2032
- Figure 9: Europe Rhamnolipids Market Revenue Share (%), by Country 2024 & 2032
- Figure 10: Europe Rhamnolipids Market Volume Share (%), by Country 2024 & 2032
- Figure 11: Asia Pacific Rhamnolipids Market Revenue (Million), by Country 2024 & 2032
- Figure 12: Asia Pacific Rhamnolipids Market Volume (Million), by Country 2024 & 2032
- Figure 13: Asia Pacific Rhamnolipids Market Revenue Share (%), by Country 2024 & 2032
- Figure 14: Asia Pacific Rhamnolipids Market Volume Share (%), by Country 2024 & 2032
- Figure 15: South America Rhamnolipids Market Revenue (Million), by Country 2024 & 2032
- Figure 16: South America Rhamnolipids Market Volume (Million), by Country 2024 & 2032
- Figure 17: South America Rhamnolipids Market Revenue Share (%), by Country 2024 & 2032
- Figure 18: South America Rhamnolipids Market Volume Share (%), by Country 2024 & 2032
- Figure 19: North America Rhamnolipids Market Revenue (Million), by Country 2024 & 2032
- Figure 20: North America Rhamnolipids Market Volume (Million), by Country 2024 & 2032
- Figure 21: North America Rhamnolipids Market Revenue Share (%), by Country 2024 & 2032
- Figure 22: North America Rhamnolipids Market Volume Share (%), by Country 2024 & 2032
- Figure 23: MEA Rhamnolipids Market Revenue (Million), by Country 2024 & 2032
- Figure 24: MEA Rhamnolipids Market Volume (Million), by Country 2024 & 2032
- Figure 25: MEA Rhamnolipids Market Revenue Share (%), by Country 2024 & 2032
- Figure 26: MEA Rhamnolipids Market Volume Share (%), by Country 2024 & 2032
- Figure 27: Asia Pacific Rhamnolipids Market Revenue (Million), by Type 2024 & 2032
- Figure 28: Asia Pacific Rhamnolipids Market Volume (Million), by Type 2024 & 2032
- Figure 29: Asia Pacific Rhamnolipids Market Revenue Share (%), by Type 2024 & 2032
- Figure 30: Asia Pacific Rhamnolipids Market Volume Share (%), by Type 2024 & 2032
- Figure 31: Asia Pacific Rhamnolipids Market Revenue (Million), by Application 2024 & 2032
- Figure 32: Asia Pacific Rhamnolipids Market Volume (Million), by Application 2024 & 2032
- Figure 33: Asia Pacific Rhamnolipids Market Revenue Share (%), by Application 2024 & 2032
- Figure 34: Asia Pacific Rhamnolipids Market Volume Share (%), by Application 2024 & 2032
- Figure 35: Asia Pacific Rhamnolipids Market Revenue (Million), by Country 2024 & 2032
- Figure 36: Asia Pacific Rhamnolipids Market Volume (Million), by Country 2024 & 2032
- Figure 37: Asia Pacific Rhamnolipids Market Revenue Share (%), by Country 2024 & 2032
- Figure 38: Asia Pacific Rhamnolipids Market Volume Share (%), by Country 2024 & 2032
- Figure 39: North America Rhamnolipids Market Revenue (Million), by Type 2024 & 2032
- Figure 40: North America Rhamnolipids Market Volume (Million), by Type 2024 & 2032
- Figure 41: North America Rhamnolipids Market Revenue Share (%), by Type 2024 & 2032
- Figure 42: North America Rhamnolipids Market Volume Share (%), by Type 2024 & 2032
- Figure 43: North America Rhamnolipids Market Revenue (Million), by Application 2024 & 2032
- Figure 44: North America Rhamnolipids Market Volume (Million), by Application 2024 & 2032
- Figure 45: North America Rhamnolipids Market Revenue Share (%), by Application 2024 & 2032
- Figure 46: North America Rhamnolipids Market Volume Share (%), by Application 2024 & 2032
- Figure 47: North America Rhamnolipids Market Revenue (Million), by Country 2024 & 2032
- Figure 48: North America Rhamnolipids Market Volume (Million), by Country 2024 & 2032
- Figure 49: North America Rhamnolipids Market Revenue Share (%), by Country 2024 & 2032
- Figure 50: North America Rhamnolipids Market Volume Share (%), by Country 2024 & 2032
- Figure 51: Europe Rhamnolipids Market Revenue (Million), by Type 2024 & 2032
- Figure 52: Europe Rhamnolipids Market Volume (Million), by Type 2024 & 2032
- Figure 53: Europe Rhamnolipids Market Revenue Share (%), by Type 2024 & 2032
- Figure 54: Europe Rhamnolipids Market Volume Share (%), by Type 2024 & 2032
- Figure 55: Europe Rhamnolipids Market Revenue (Million), by Application 2024 & 2032
- Figure 56: Europe Rhamnolipids Market Volume (Million), by Application 2024 & 2032
- Figure 57: Europe Rhamnolipids Market Revenue Share (%), by Application 2024 & 2032
- Figure 58: Europe Rhamnolipids Market Volume Share (%), by Application 2024 & 2032
- Figure 59: Europe Rhamnolipids Market Revenue (Million), by Country 2024 & 2032
- Figure 60: Europe Rhamnolipids Market Volume (Million), by Country 2024 & 2032
- Figure 61: Europe Rhamnolipids Market Revenue Share (%), by Country 2024 & 2032
- Figure 62: Europe Rhamnolipids Market Volume Share (%), by Country 2024 & 2032
- Figure 63: South America Rhamnolipids Market Revenue (Million), by Type 2024 & 2032
- Figure 64: South America Rhamnolipids Market Volume (Million), by Type 2024 & 2032
- Figure 65: South America Rhamnolipids Market Revenue Share (%), by Type 2024 & 2032
- Figure 66: South America Rhamnolipids Market Volume Share (%), by Type 2024 & 2032
- Figure 67: South America Rhamnolipids Market Revenue (Million), by Application 2024 & 2032
- Figure 68: South America Rhamnolipids Market Volume (Million), by Application 2024 & 2032
- Figure 69: South America Rhamnolipids Market Revenue Share (%), by Application 2024 & 2032
- Figure 70: South America Rhamnolipids Market Volume Share (%), by Application 2024 & 2032
- Figure 71: South America Rhamnolipids Market Revenue (Million), by Country 2024 & 2032
- Figure 72: South America Rhamnolipids Market Volume (Million), by Country 2024 & 2032
- Figure 73: South America Rhamnolipids Market Revenue Share (%), by Country 2024 & 2032
- Figure 74: South America Rhamnolipids Market Volume Share (%), by Country 2024 & 2032
- Figure 75: Middle East and Africa Rhamnolipids Market Revenue (Million), by Type 2024 & 2032
- Figure 76: Middle East and Africa Rhamnolipids Market Volume (Million), by Type 2024 & 2032
- Figure 77: Middle East and Africa Rhamnolipids Market Revenue Share (%), by Type 2024 & 2032
- Figure 78: Middle East and Africa Rhamnolipids Market Volume Share (%), by Type 2024 & 2032
- Figure 79: Middle East and Africa Rhamnolipids Market Revenue (Million), by Application 2024 & 2032
- Figure 80: Middle East and Africa Rhamnolipids Market Volume (Million), by Application 2024 & 2032
- Figure 81: Middle East and Africa Rhamnolipids Market Revenue Share (%), by Application 2024 & 2032
- Figure 82: Middle East and Africa Rhamnolipids Market Volume Share (%), by Application 2024 & 2032
- Figure 83: Middle East and Africa Rhamnolipids Market Revenue (Million), by Country 2024 & 2032
- Figure 84: Middle East and Africa Rhamnolipids Market Volume (Million), by Country 2024 & 2032
- Figure 85: Middle East and Africa Rhamnolipids Market Revenue Share (%), by Country 2024 & 2032
- Figure 86: Middle East and Africa Rhamnolipids Market Volume Share (%), by Country 2024 & 2032
List of Tables
- Table 1: Global Rhamnolipids Market Revenue Million Forecast, by Region 2019 & 2032
- Table 2: Global Rhamnolipids Market Volume Million Forecast, by Region 2019 & 2032
- Table 3: Global Rhamnolipids Market Revenue Million Forecast, by Type 2019 & 2032
- Table 4: Global Rhamnolipids Market Volume Million Forecast, by Type 2019 & 2032
- Table 5: Global Rhamnolipids Market Revenue Million Forecast, by Application 2019 & 2032
- Table 6: Global Rhamnolipids Market Volume Million Forecast, by Application 2019 & 2032
- Table 7: Global Rhamnolipids Market Revenue Million Forecast, by Region 2019 & 2032
- Table 8: Global Rhamnolipids Market Volume Million Forecast, by Region 2019 & 2032
- Table 9: Global Rhamnolipids Market Revenue Million Forecast, by Country 2019 & 2032
- Table 10: Global Rhamnolipids Market Volume Million Forecast, by Country 2019 & 2032
- Table 11: United States Rhamnolipids Market Revenue (Million) Forecast, by Application 2019 & 2032
- Table 12: United States Rhamnolipids Market Volume (Million) Forecast, by Application 2019 & 2032
- Table 13: Canada Rhamnolipids Market Revenue (Million) Forecast, by Application 2019 & 2032
- Table 14: Canada Rhamnolipids Market Volume (Million) Forecast, by Application 2019 & 2032
- Table 15: Mexico Rhamnolipids Market Revenue (Million) Forecast, by Application 2019 & 2032
- Table 16: Mexico Rhamnolipids Market Volume (Million) Forecast, by Application 2019 & 2032
- Table 17: Global Rhamnolipids Market Revenue Million Forecast, by Country 2019 & 2032
- Table 18: Global Rhamnolipids Market Volume Million Forecast, by Country 2019 & 2032
- Table 19: Germany Rhamnolipids Market Revenue (Million) Forecast, by Application 2019 & 2032
- Table 20: Germany Rhamnolipids Market Volume (Million) Forecast, by Application 2019 & 2032
- Table 21: United Kingdom Rhamnolipids Market Revenue (Million) Forecast, by Application 2019 & 2032
- Table 22: United Kingdom Rhamnolipids Market Volume (Million) Forecast, by Application 2019 & 2032
- Table 23: France Rhamnolipids Market Revenue (Million) Forecast, by Application 2019 & 2032
- Table 24: France Rhamnolipids Market Volume (Million) Forecast, by Application 2019 & 2032
- Table 25: Spain Rhamnolipids Market Revenue (Million) Forecast, by Application 2019 & 2032
- Table 26: Spain Rhamnolipids Market Volume (Million) Forecast, by Application 2019 & 2032
- Table 27: Italy Rhamnolipids Market Revenue (Million) Forecast, by Application 2019 & 2032
- Table 28: Italy Rhamnolipids Market Volume (Million) Forecast, by Application 2019 & 2032
- Table 29: Spain Rhamnolipids Market Revenue (Million) Forecast, by Application 2019 & 2032
- Table 30: Spain Rhamnolipids Market Volume (Million) Forecast, by Application 2019 & 2032
- Table 31: Belgium Rhamnolipids Market Revenue (Million) Forecast, by Application 2019 & 2032
- Table 32: Belgium Rhamnolipids Market Volume (Million) Forecast, by Application 2019 & 2032
- Table 33: Netherland Rhamnolipids Market Revenue (Million) Forecast, by Application 2019 & 2032
- Table 34: Netherland Rhamnolipids Market Volume (Million) Forecast, by Application 2019 & 2032
- Table 35: Nordics Rhamnolipids Market Revenue (Million) Forecast, by Application 2019 & 2032
- Table 36: Nordics Rhamnolipids Market Volume (Million) Forecast, by Application 2019 & 2032
- Table 37: Rest of Europe Rhamnolipids Market Revenue (Million) Forecast, by Application 2019 & 2032
- Table 38: Rest of Europe Rhamnolipids Market Volume (Million) Forecast, by Application 2019 & 2032
- Table 39: Global Rhamnolipids Market Revenue Million Forecast, by Country 2019 & 2032
- Table 40: Global Rhamnolipids Market Volume Million Forecast, by Country 2019 & 2032
- Table 41: China Rhamnolipids Market Revenue (Million) Forecast, by Application 2019 & 2032
- Table 42: China Rhamnolipids Market Volume (Million) Forecast, by Application 2019 & 2032
- Table 43: Japan Rhamnolipids Market Revenue (Million) Forecast, by Application 2019 & 2032
- Table 44: Japan Rhamnolipids Market Volume (Million) Forecast, by Application 2019 & 2032
- Table 45: India Rhamnolipids Market Revenue (Million) Forecast, by Application 2019 & 2032
- Table 46: India Rhamnolipids Market Volume (Million) Forecast, by Application 2019 & 2032
- Table 47: South Korea Rhamnolipids Market Revenue (Million) Forecast, by Application 2019 & 2032
- Table 48: South Korea Rhamnolipids Market Volume (Million) Forecast, by Application 2019 & 2032
- Table 49: Southeast Asia Rhamnolipids Market Revenue (Million) Forecast, by Application 2019 & 2032
- Table 50: Southeast Asia Rhamnolipids Market Volume (Million) Forecast, by Application 2019 & 2032
- Table 51: Australia Rhamnolipids Market Revenue (Million) Forecast, by Application 2019 & 2032
- Table 52: Australia Rhamnolipids Market Volume (Million) Forecast, by Application 2019 & 2032
- Table 53: Indonesia Rhamnolipids Market Revenue (Million) Forecast, by Application 2019 & 2032
- Table 54: Indonesia Rhamnolipids Market Volume (Million) Forecast, by Application 2019 & 2032
- Table 55: Phillipes Rhamnolipids Market Revenue (Million) Forecast, by Application 2019 & 2032
- Table 56: Phillipes Rhamnolipids Market Volume (Million) Forecast, by Application 2019 & 2032
- Table 57: Singapore Rhamnolipids Market Revenue (Million) Forecast, by Application 2019 & 2032
- Table 58: Singapore Rhamnolipids Market Volume (Million) Forecast, by Application 2019 & 2032
- Table 59: Thailandc Rhamnolipids Market Revenue (Million) Forecast, by Application 2019 & 2032
- Table 60: Thailandc Rhamnolipids Market Volume (Million) Forecast, by Application 2019 & 2032
- Table 61: Rest of Asia Pacific Rhamnolipids Market Revenue (Million) Forecast, by Application 2019 & 2032
- Table 62: Rest of Asia Pacific Rhamnolipids Market Volume (Million) Forecast, by Application 2019 & 2032
- Table 63: Global Rhamnolipids Market Revenue Million Forecast, by Country 2019 & 2032
- Table 64: Global Rhamnolipids Market Volume Million Forecast, by Country 2019 & 2032
- Table 65: Brazil Rhamnolipids Market Revenue (Million) Forecast, by Application 2019 & 2032
- Table 66: Brazil Rhamnolipids Market Volume (Million) Forecast, by Application 2019 & 2032
- Table 67: Argentina Rhamnolipids Market Revenue (Million) Forecast, by Application 2019 & 2032
- Table 68: Argentina Rhamnolipids Market Volume (Million) Forecast, by Application 2019 & 2032
- Table 69: Peru Rhamnolipids Market Revenue (Million) Forecast, by Application 2019 & 2032
- Table 70: Peru Rhamnolipids Market Volume (Million) Forecast, by Application 2019 & 2032
- Table 71: Chile Rhamnolipids Market Revenue (Million) Forecast, by Application 2019 & 2032
- Table 72: Chile Rhamnolipids Market Volume (Million) Forecast, by Application 2019 & 2032
- Table 73: Colombia Rhamnolipids Market Revenue (Million) Forecast, by Application 2019 & 2032
- Table 74: Colombia Rhamnolipids Market Volume (Million) Forecast, by Application 2019 & 2032
- Table 75: Ecuador Rhamnolipids Market Revenue (Million) Forecast, by Application 2019 & 2032
- Table 76: Ecuador Rhamnolipids Market Volume (Million) Forecast, by Application 2019 & 2032
- Table 77: Venezuela Rhamnolipids Market Revenue (Million) Forecast, by Application 2019 & 2032
- Table 78: Venezuela Rhamnolipids Market Volume (Million) Forecast, by Application 2019 & 2032
- Table 79: Rest of South America Rhamnolipids Market Revenue (Million) Forecast, by Application 2019 & 2032
- Table 80: Rest of South America Rhamnolipids Market Volume (Million) Forecast, by Application 2019 & 2032
- Table 81: Global Rhamnolipids Market Revenue Million Forecast, by Country 2019 & 2032
- Table 82: Global Rhamnolipids Market Volume Million Forecast, by Country 2019 & 2032
- Table 83: United States Rhamnolipids Market Revenue (Million) Forecast, by Application 2019 & 2032
- Table 84: United States Rhamnolipids Market Volume (Million) Forecast, by Application 2019 & 2032
- Table 85: Canada Rhamnolipids Market Revenue (Million) Forecast, by Application 2019 & 2032
- Table 86: Canada Rhamnolipids Market Volume (Million) Forecast, by Application 2019 & 2032
- Table 87: Mexico Rhamnolipids Market Revenue (Million) Forecast, by Application 2019 & 2032
- Table 88: Mexico Rhamnolipids Market Volume (Million) Forecast, by Application 2019 & 2032
- Table 89: Global Rhamnolipids Market Revenue Million Forecast, by Country 2019 & 2032
- Table 90: Global Rhamnolipids Market Volume Million Forecast, by Country 2019 & 2032
- Table 91: United Arab Emirates Rhamnolipids Market Revenue (Million) Forecast, by Application 2019 & 2032
- Table 92: United Arab Emirates Rhamnolipids Market Volume (Million) Forecast, by Application 2019 & 2032
- Table 93: Saudi Arabia Rhamnolipids Market Revenue (Million) Forecast, by Application 2019 & 2032
- Table 94: Saudi Arabia Rhamnolipids Market Volume (Million) Forecast, by Application 2019 & 2032
- Table 95: South Africa Rhamnolipids Market Revenue (Million) Forecast, by Application 2019 & 2032
- Table 96: South Africa Rhamnolipids Market Volume (Million) Forecast, by Application 2019 & 2032
- Table 97: Rest of Middle East and Africa Rhamnolipids Market Revenue (Million) Forecast, by Application 2019 & 2032
- Table 98: Rest of Middle East and Africa Rhamnolipids Market Volume (Million) Forecast, by Application 2019 & 2032
- Table 99: Global Rhamnolipids Market Revenue Million Forecast, by Type 2019 & 2032
- Table 100: Global Rhamnolipids Market Volume Million Forecast, by Type 2019 & 2032
- Table 101: Global Rhamnolipids Market Revenue Million Forecast, by Application 2019 & 2032
- Table 102: Global Rhamnolipids Market Volume Million Forecast, by Application 2019 & 2032
- Table 103: Global Rhamnolipids Market Revenue Million Forecast, by Country 2019 & 2032
- Table 104: Global Rhamnolipids Market Volume Million Forecast, by Country 2019 & 2032
- Table 105: Global Rhamnolipids Market Revenue Million Forecast, by Type 2019 & 2032
- Table 106: Global Rhamnolipids Market Volume Million Forecast, by Type 2019 & 2032
- Table 107: Global Rhamnolipids Market Revenue Million Forecast, by Application 2019 & 2032
- Table 108: Global Rhamnolipids Market Volume Million Forecast, by Application 2019 & 2032
- Table 109: Global Rhamnolipids Market Revenue Million Forecast, by Country 2019 & 2032
- Table 110: Global Rhamnolipids Market Volume Million Forecast, by Country 2019 & 2032
- Table 111: Global Rhamnolipids Market Revenue Million Forecast, by Type 2019 & 2032
- Table 112: Global Rhamnolipids Market Volume Million Forecast, by Type 2019 & 2032
- Table 113: Global Rhamnolipids Market Revenue Million Forecast, by Application 2019 & 2032
- Table 114: Global Rhamnolipids Market Volume Million Forecast, by Application 2019 & 2032
- Table 115: Global Rhamnolipids Market Revenue Million Forecast, by Country 2019 & 2032
- Table 116: Global Rhamnolipids Market Volume Million Forecast, by Country 2019 & 2032
- Table 117: Global Rhamnolipids Market Revenue Million Forecast, by Type 2019 & 2032
- Table 118: Global Rhamnolipids Market Volume Million Forecast, by Type 2019 & 2032
- Table 119: Global Rhamnolipids Market Revenue Million Forecast, by Application 2019 & 2032
- Table 120: Global Rhamnolipids Market Volume Million Forecast, by Application 2019 & 2032
- Table 121: Global Rhamnolipids Market Revenue Million Forecast, by Country 2019 & 2032
- Table 122: Global Rhamnolipids Market Volume Million Forecast, by Country 2019 & 2032
- Table 123: Global Rhamnolipids Market Revenue Million Forecast, by Type 2019 & 2032
- Table 124: Global Rhamnolipids Market Volume Million Forecast, by Type 2019 & 2032
- Table 125: Global Rhamnolipids Market Revenue Million Forecast, by Application 2019 & 2032
- Table 126: Global Rhamnolipids Market Volume Million Forecast, by Application 2019 & 2032
- Table 127: Global Rhamnolipids Market Revenue Million Forecast, by Country 2019 & 2032
- Table 128: Global Rhamnolipids Market Volume Million Forecast, by Country 2019 & 2032
Frequently Asked Questions
1. What is the projected Compound Annual Growth Rate (CAGR) of the Rhamnolipids Market?
The projected CAGR is approximately 38.03%.
2. Which companies are prominent players in the Rhamnolipids Market?
Key companies in the market include Biotensidon GmbH, TensioGreen*List Not Exhaustive, GlycoSurf, AGAE Technologies LLC, Evonik Industries AG, Stepan Company, Jeneil Biotech, DEGUAN Biosurfactant Supplier.
3. What are the main segments of the Rhamnolipids Market?
The market segments include Type, Application.
4. Can you provide details about the market size?
The market size is estimated to be USD XX Million as of 2022.
5. What are some drivers contributing to market growth?
Emergence of Eco-friendly Surfactant; Increasing Demand For Personal Care Products.
6. What are the notable trends driving market growth?
Growing Demand of Rhamnolipids from Surfactants.
7. Are there any restraints impacting market growth?
Limitation in the Production of Rhamnolipids on an Industrial Scale.
8. Can you provide examples of recent developments in the market?
September 2022: AGAE Technologies, LLC announced the discovery of employing certain strains and mediums under optimized fermentation conditions to obtain record-high rhamnolipid yields at the lowest possible cost. When compared to traditionally optimized fermentation settings, the fermentation methods enhanced yields by approximately 200% while lowering production costs to about one-third of the conventionally optimized conditions.
9. What pricing options are available for accessing the report?
Pricing options include single-user, multi-user, and enterprise licenses priced at USD 4750, USD 5250, and USD 8750 respectively.
10. Is the market size provided in terms of value or volume?
The market size is provided in terms of value, measured in Million and volume, measured in Million.
11. Are there any specific market keywords associated with the report?
Yes, the market keyword associated with the report is "Rhamnolipids Market," which aids in identifying and referencing the specific market segment covered.
12. How do I determine which pricing option suits my needs best?
The pricing options vary based on user requirements and access needs. Individual users may opt for single-user licenses, while businesses requiring broader access may choose multi-user or enterprise licenses for cost-effective access to the report.
13. Are there any additional resources or data provided in the Rhamnolipids Market report?
While the report offers comprehensive insights, it's advisable to review the specific contents or supplementary materials provided to ascertain if additional resources or data are available.
14. How can I stay updated on further developments or reports in the Rhamnolipids Market?
To stay informed about further developments, trends, and reports in the Rhamnolipids Market, consider subscribing to industry newsletters, following relevant companies and organizations, or regularly checking reputable industry news sources and publications.
Methodology
Step 1 - Identification of Relevant Samples Size from Population Database


Step 2 - Approaches for Defining Global Market Size (Value, Volume* & Price*)

Note*: In applicable scenarios
Step 3 - Data Sources
Primary Research
- Web Analytics
- Survey Reports
- Research Institute
- Latest Research Reports
- Opinion Leaders
Secondary Research
- Annual Reports
- White Paper
- Latest Press Release
- Industry Association
- Paid Database
- Investor Presentations

Step 4 - Data Triangulation
Involves using different sources of information in order to increase the validity of a study
These sources are likely to be stakeholders in a program - participants, other researchers, program staff, other community members, and so on.
Then we put all data in single framework & apply various statistical tools to find out the dynamic on the market.
During the analysis stage, feedback from the stakeholder groups would be compared to determine areas of agreement as well as areas of divergence


