
Key Insights
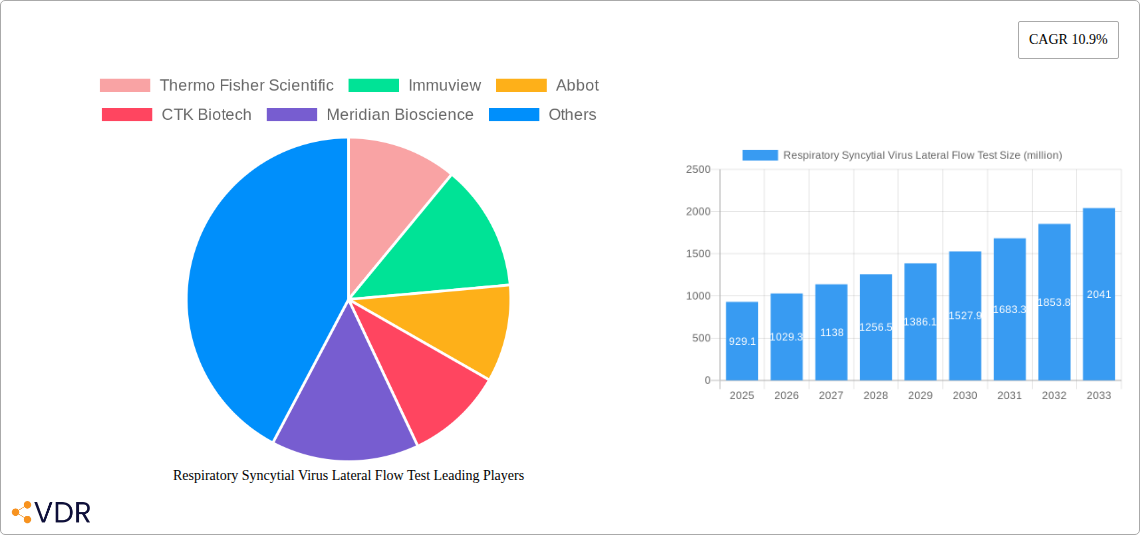
The Respiratory Syncytial Virus (RSV) Lateral Flow Test market is experiencing robust growth, projected to reach a market size of $929.1 million in 2025 and maintain a Compound Annual Growth Rate (CAGR) of 10.9% from 2025 to 2033. This significant expansion is driven by several factors. Increased RSV outbreaks, particularly impacting vulnerable populations like infants and the elderly, fuel demand for rapid and accurate diagnostic tools. The ease of use and portability of lateral flow tests make them ideal for point-of-care diagnostics in various settings, including hospitals, clinics, and even home use, contributing to market growth. Furthermore, technological advancements leading to improved test sensitivity and specificity are enhancing their reliability and adoption. Growing awareness of RSV's severity and the need for timely intervention among healthcare professionals and the public further boosts market demand. The market's competitive landscape includes major players like Thermo Fisher Scientific, Abbott, and Roche, constantly innovating to improve their products and expand market share.
Despite the positive growth trajectory, certain market restraints exist. Pricing pressures from competing diagnostic methods and potential reimbursement challenges can impact profitability. The accuracy of lateral flow tests, while improving, might still be slightly lower compared to more sophisticated laboratory-based tests, which could affect market penetration in specific applications. Regulatory approvals and clearances also present a hurdle for new entrants and innovative product launches. However, the overall market outlook remains positive, driven by the ongoing need for accessible and rapid RSV diagnostics, particularly given the potential for future pandemics and increased global health awareness. Continued technological advancements and strategic partnerships are expected to overcome these challenges and fuel continued growth of the RSV lateral flow test market over the forecast period.
Respiratory Syncytial Virus (RSV) Lateral Flow Test Market Report: 2019-2033
This comprehensive report provides an in-depth analysis of the global Respiratory Syncytial Virus (RSV) Lateral Flow Test market, encompassing market dynamics, growth trends, regional analysis, product landscape, competitive overview, and future outlook. The report covers the period 2019-2033, with a focus on the forecast period 2025-2033, and utilizes data from the base year 2025. The market is segmented by various factors including but not limited to end-user, application, and geography. The parent market is the broader in-vitro diagnostics market, while the child market is rapid diagnostic tests for respiratory infections.
Respiratory Syncytial Virus Lateral Flow Test Market Dynamics & Structure
The RSV Lateral Flow Test market is characterized by moderate concentration, with key players like Thermo Fisher Scientific, Abbott, and Roche holding significant market share (estimated collectively at xx%). Technological innovation, primarily focused on improving sensitivity and specificity, is a key driver. Stringent regulatory frameworks (e.g., FDA approval in the US) influence market access. Competitive substitutes include PCR and ELISA tests, but lateral flow tests offer advantages in terms of cost-effectiveness and ease of use. The end-user demographic is primarily healthcare professionals in hospitals, clinics, and point-of-care settings. M&A activity has been moderate (xx deals in the historical period), driven by companies seeking to expand their product portfolio and geographic reach.
- Market Concentration: Moderately concentrated, with top 3 players holding xx% market share.
- Technological Innovation: Focus on enhancing sensitivity, specificity, and ease of use.
- Regulatory Landscape: Stringent approvals (e.g., FDA, CE marking) impact market entry.
- Competitive Substitutes: PCR, ELISA tests pose competition.
- M&A Activity: Moderate, driven by portfolio expansion and geographic reach (xx deals from 2019-2024).
- Innovation Barriers: High R&D costs, regulatory hurdles.
Respiratory Syncytial Virus Lateral Flow Test Growth Trends & Insights
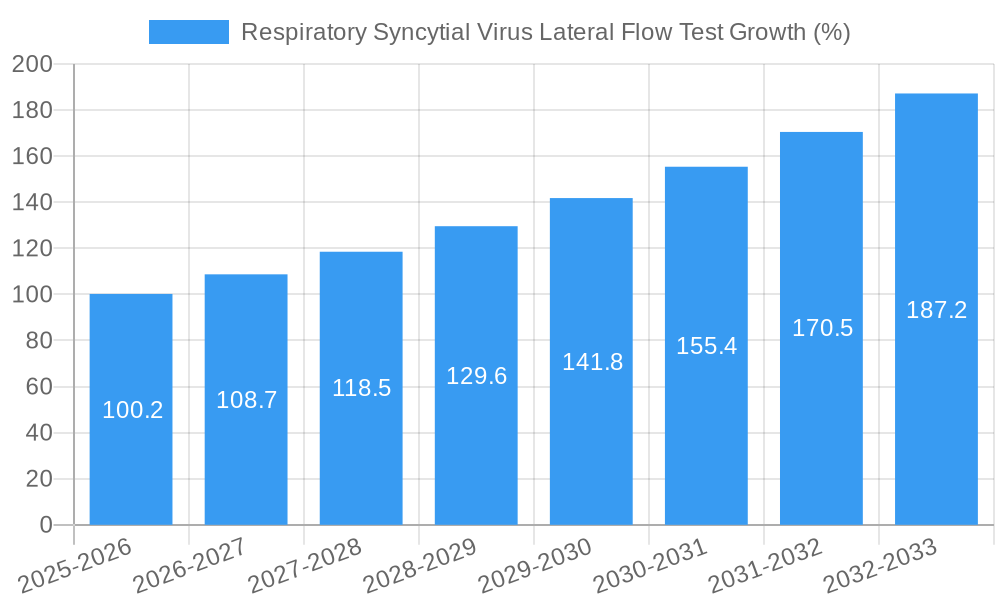
The RSV Lateral Flow Test market experienced robust growth during the historical period (2019-2024), with a CAGR of xx%. This growth is attributed to rising RSV infection rates, increasing demand for rapid diagnostic solutions, and advancements in test technology. Market penetration remains relatively low (xx% in 2025), suggesting significant growth potential. The forecast period (2025-2033) anticipates continued expansion, driven by factors such as increasing awareness of RSV, improved healthcare infrastructure in developing countries, and the launch of new, more sensitive tests. Technological disruptions, including the incorporation of advanced detection methodologies, will further fuel market growth. Consumer behavior shifts towards self-testing and telehealth are also emerging as significant growth drivers. The market size is projected to reach xx million units by 2033.
Dominant Regions, Countries, or Segments in Respiratory Syncytial Virus Lateral Flow Test
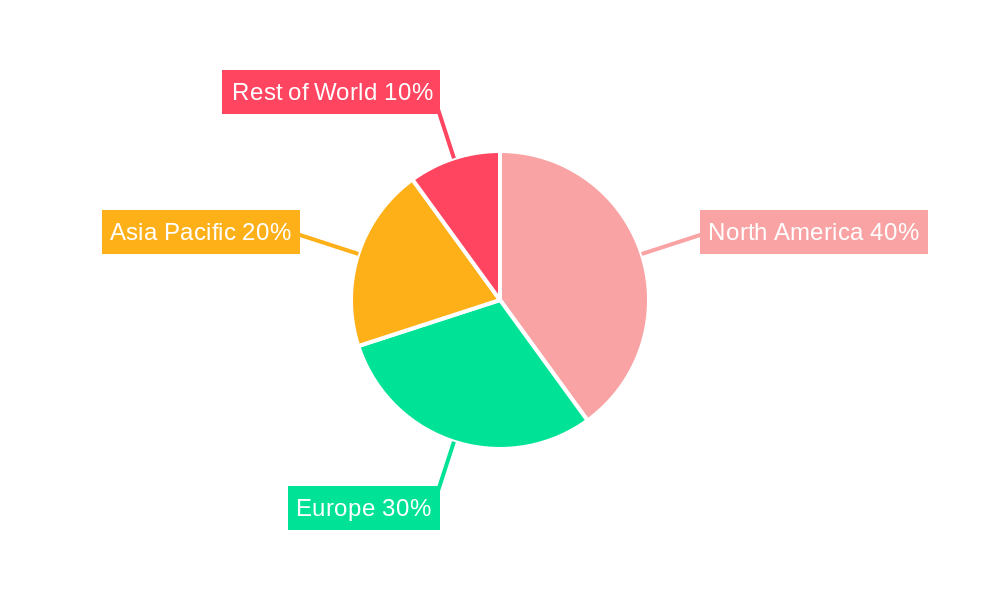
North America currently holds the largest market share, driven by high healthcare expenditure, robust healthcare infrastructure, and a higher prevalence of RSV infections. Europe follows closely, while the Asia-Pacific region exhibits substantial growth potential due to rising healthcare awareness and increasing disposable incomes. Specific countries like the US, Germany, and Japan are key contributors to market growth.
- North America: High healthcare expenditure, advanced infrastructure, higher RSV prevalence.
- Europe: Strong healthcare systems, increasing demand for rapid diagnostics.
- Asia-Pacific: High growth potential due to rising healthcare awareness and disposable incomes.
- Market Share: North America holds the largest share (xx%), followed by Europe (xx%).
- Growth Potential: Asia-Pacific exhibits the highest growth potential (xx% CAGR).
Respiratory Syncytial Virus Lateral Flow Test Product Landscape
The market offers a range of RSV lateral flow tests varying in sensitivity, specificity, and ease of use. Recent innovations include tests with improved detection limits, multiplexed assays for simultaneous detection of other respiratory pathogens, and point-of-care devices for rapid results. Unique selling propositions often include faster turnaround times, portability, cost-effectiveness, and ease of interpretation. Technological advancements are focused on enhancing the accuracy and reliability of the results while simplifying the testing procedure.
Key Drivers, Barriers & Challenges in Respiratory Syncytial Virus Lateral Flow Test
Key Drivers:
- Rising prevalence of RSV infections globally.
- Increasing demand for rapid, point-of-care diagnostics.
- Technological advancements leading to improved test accuracy and ease of use.
- Government initiatives supporting infectious disease surveillance and control.
Key Challenges and Restraints:
- High initial investment costs for new technology development and manufacturing.
- Stringent regulatory requirements for test approval and market access.
- Competition from other diagnostic methods (PCR, ELISA).
- Potential supply chain disruptions impacting raw material availability and manufacturing. These disruptions have resulted in an estimated xx% decrease in production during the past year.
Emerging Opportunities in Respiratory Syncytial Virus Lateral Flow Test
- Development of more sensitive and specific tests.
- Integration of lateral flow tests into telehealth platforms.
- Expansion into underserved markets with limited access to diagnostics.
- Development of multiplexed tests detecting other respiratory pathogens.
- Home-use RSV tests for self-diagnosis and early intervention.
Growth Accelerators in the Respiratory Syncytial Virus Lateral Flow Test Industry
Technological breakthroughs such as advanced detection technologies and improved manufacturing processes are key growth catalysts. Strategic partnerships between diagnostic companies and healthcare providers facilitate market access and adoption. Expansion into emerging markets with increasing healthcare awareness and infrastructure development further fuels market growth.
Key Players Shaping the Respiratory Syncytial Virus Lateral Flow Test Market
- Thermo Fisher Scientific
- Abbott
- F. Hoffmann-La Roche Ltd
- Immuview
- CTK Biotech
- Meridian Bioscience
- Sekisui Diagnostics
- bioMerieux SA
- Becton, Dickinson and Company
Notable Milestones in Respiratory Syncytial Virus Lateral Flow Test Sector
- 2020: FDA EUA granted for several rapid antigen tests.
- 2021: Launch of several point-of-care RSV lateral flow tests.
- 2022: Several key partnerships formed to expand distribution networks.
- 2023: Increased R&D investment in next-generation RSV diagnostic technologies.
In-Depth Respiratory Syncytial Virus Lateral Flow Test Market Outlook
The RSV Lateral Flow Test market is poised for continued growth driven by persistent demand for rapid diagnostics, technological advancements, and expansion into new markets. Strategic opportunities exist in developing innovative tests, forging partnerships to enhance market access, and focusing on underserved populations. The market's long-term growth trajectory remains positive, with significant potential for further market penetration and expansion.
Respiratory Syncytial Virus Lateral Flow Test Segmentation
-
1. Application
- 1.1. Hospitals
- 1.2. POCT
- 1.3. Others
-
2. Types
- 2.1. Testing Services
- 2.2. Testing Kits
- 2.3. Others
Respiratory Syncytial Virus Lateral Flow Test Segmentation By Geography
-
1. North America
- 1.1. United States
- 1.2. Canada
- 1.3. Mexico
-
2. South America
- 2.1. Brazil
- 2.2. Argentina
- 2.3. Rest of South America
-
3. Europe
- 3.1. United Kingdom
- 3.2. Germany
- 3.3. France
- 3.4. Italy
- 3.5. Spain
- 3.6. Russia
- 3.7. Benelux
- 3.8. Nordics
- 3.9. Rest of Europe
-
4. Middle East & Africa
- 4.1. Turkey
- 4.2. Israel
- 4.3. GCC
- 4.4. North Africa
- 4.5. South Africa
- 4.6. Rest of Middle East & Africa
-
5. Asia Pacific
- 5.1. China
- 5.2. India
- 5.3. Japan
- 5.4. South Korea
- 5.5. ASEAN
- 5.6. Oceania
- 5.7. Rest of Asia Pacific
Respiratory Syncytial Virus Lateral Flow Test REPORT HIGHLIGHTS
| Aspects | Details |
|---|---|
| Study Period | 2019-2033 |
| Base Year | 2024 |
| Estimated Year | 2025 |
| Forecast Period | 2025-2033 |
| Historical Period | 2019-2024 |
| Growth Rate | CAGR of 10.9% from 2019-2033 |
| Segmentation |
|
Table of Contents
- 1. Introduction
- 1.1. Research Scope
- 1.2. Market Segmentation
- 1.3. Research Methodology
- 1.4. Definitions and Assumptions
- 2. Executive Summary
- 2.1. Introduction
- 3. Market Dynamics
- 3.1. Introduction
- 3.2. Market Drivers
- 3.3. Market Restrains
- 3.4. Market Trends
- 4. Market Factor Analysis
- 4.1. Porters Five Forces
- 4.2. Supply/Value Chain
- 4.3. PESTEL analysis
- 4.4. Market Entropy
- 4.5. Patent/Trademark Analysis
- 5. Global Respiratory Syncytial Virus Lateral Flow Test Analysis, Insights and Forecast, 2019-2031
- 5.1. Market Analysis, Insights and Forecast - by Application
- 5.1.1. Hospitals
- 5.1.2. POCT
- 5.1.3. Others
- 5.2. Market Analysis, Insights and Forecast - by Types
- 5.2.1. Testing Services
- 5.2.2. Testing Kits
- 5.2.3. Others
- 5.3. Market Analysis, Insights and Forecast - by Region
- 5.3.1. North America
- 5.3.2. South America
- 5.3.3. Europe
- 5.3.4. Middle East & Africa
- 5.3.5. Asia Pacific
- 5.1. Market Analysis, Insights and Forecast - by Application
- 6. North America Respiratory Syncytial Virus Lateral Flow Test Analysis, Insights and Forecast, 2019-2031
- 6.1. Market Analysis, Insights and Forecast - by Application
- 6.1.1. Hospitals
- 6.1.2. POCT
- 6.1.3. Others
- 6.2. Market Analysis, Insights and Forecast - by Types
- 6.2.1. Testing Services
- 6.2.2. Testing Kits
- 6.2.3. Others
- 6.1. Market Analysis, Insights and Forecast - by Application
- 7. South America Respiratory Syncytial Virus Lateral Flow Test Analysis, Insights and Forecast, 2019-2031
- 7.1. Market Analysis, Insights and Forecast - by Application
- 7.1.1. Hospitals
- 7.1.2. POCT
- 7.1.3. Others
- 7.2. Market Analysis, Insights and Forecast - by Types
- 7.2.1. Testing Services
- 7.2.2. Testing Kits
- 7.2.3. Others
- 7.1. Market Analysis, Insights and Forecast - by Application
- 8. Europe Respiratory Syncytial Virus Lateral Flow Test Analysis, Insights and Forecast, 2019-2031
- 8.1. Market Analysis, Insights and Forecast - by Application
- 8.1.1. Hospitals
- 8.1.2. POCT
- 8.1.3. Others
- 8.2. Market Analysis, Insights and Forecast - by Types
- 8.2.1. Testing Services
- 8.2.2. Testing Kits
- 8.2.3. Others
- 8.1. Market Analysis, Insights and Forecast - by Application
- 9. Middle East & Africa Respiratory Syncytial Virus Lateral Flow Test Analysis, Insights and Forecast, 2019-2031
- 9.1. Market Analysis, Insights and Forecast - by Application
- 9.1.1. Hospitals
- 9.1.2. POCT
- 9.1.3. Others
- 9.2. Market Analysis, Insights and Forecast - by Types
- 9.2.1. Testing Services
- 9.2.2. Testing Kits
- 9.2.3. Others
- 9.1. Market Analysis, Insights and Forecast - by Application
- 10. Asia Pacific Respiratory Syncytial Virus Lateral Flow Test Analysis, Insights and Forecast, 2019-2031
- 10.1. Market Analysis, Insights and Forecast - by Application
- 10.1.1. Hospitals
- 10.1.2. POCT
- 10.1.3. Others
- 10.2. Market Analysis, Insights and Forecast - by Types
- 10.2.1. Testing Services
- 10.2.2. Testing Kits
- 10.2.3. Others
- 10.1. Market Analysis, Insights and Forecast - by Application
- 11. Competitive Analysis
- 11.1. Global Market Share Analysis 2024
- 11.2. Company Profiles
- 11.2.1 Thermo Fisher Scientific
- 11.2.1.1. Overview
- 11.2.1.2. Products
- 11.2.1.3. SWOT Analysis
- 11.2.1.4. Recent Developments
- 11.2.1.5. Financials (Based on Availability)
- 11.2.2 Immuview
- 11.2.2.1. Overview
- 11.2.2.2. Products
- 11.2.2.3. SWOT Analysis
- 11.2.2.4. Recent Developments
- 11.2.2.5. Financials (Based on Availability)
- 11.2.3 Abbot
- 11.2.3.1. Overview
- 11.2.3.2. Products
- 11.2.3.3. SWOT Analysis
- 11.2.3.4. Recent Developments
- 11.2.3.5. Financials (Based on Availability)
- 11.2.4 CTK Biotech
- 11.2.4.1. Overview
- 11.2.4.2. Products
- 11.2.4.3. SWOT Analysis
- 11.2.4.4. Recent Developments
- 11.2.4.5. Financials (Based on Availability)
- 11.2.5 Meridian Bioscience
- 11.2.5.1. Overview
- 11.2.5.2. Products
- 11.2.5.3. SWOT Analysis
- 11.2.5.4. Recent Developments
- 11.2.5.5. Financials (Based on Availability)
- 11.2.6 Sekisui Diagnostics
- 11.2.6.1. Overview
- 11.2.6.2. Products
- 11.2.6.3. SWOT Analysis
- 11.2.6.4. Recent Developments
- 11.2.6.5. Financials (Based on Availability)
- 11.2.7 bioMerieux SA
- 11.2.7.1. Overview
- 11.2.7.2. Products
- 11.2.7.3. SWOT Analysis
- 11.2.7.4. Recent Developments
- 11.2.7.5. Financials (Based on Availability)
- 11.2.8 Becton
- 11.2.8.1. Overview
- 11.2.8.2. Products
- 11.2.8.3. SWOT Analysis
- 11.2.8.4. Recent Developments
- 11.2.8.5. Financials (Based on Availability)
- 11.2.9 Dickinson and Company
- 11.2.9.1. Overview
- 11.2.9.2. Products
- 11.2.9.3. SWOT Analysis
- 11.2.9.4. Recent Developments
- 11.2.9.5. Financials (Based on Availability)
- 11.2.10 F. Hoffmann-La Roche Ltd
- 11.2.10.1. Overview
- 11.2.10.2. Products
- 11.2.10.3. SWOT Analysis
- 11.2.10.4. Recent Developments
- 11.2.10.5. Financials (Based on Availability)
- 11.2.1 Thermo Fisher Scientific
List of Figures
- Figure 1: Global Respiratory Syncytial Virus Lateral Flow Test Revenue Breakdown (million, %) by Region 2024 & 2032
- Figure 2: North America Respiratory Syncytial Virus Lateral Flow Test Revenue (million), by Application 2024 & 2032
- Figure 3: North America Respiratory Syncytial Virus Lateral Flow Test Revenue Share (%), by Application 2024 & 2032
- Figure 4: North America Respiratory Syncytial Virus Lateral Flow Test Revenue (million), by Types 2024 & 2032
- Figure 5: North America Respiratory Syncytial Virus Lateral Flow Test Revenue Share (%), by Types 2024 & 2032
- Figure 6: North America Respiratory Syncytial Virus Lateral Flow Test Revenue (million), by Country 2024 & 2032
- Figure 7: North America Respiratory Syncytial Virus Lateral Flow Test Revenue Share (%), by Country 2024 & 2032
- Figure 8: South America Respiratory Syncytial Virus Lateral Flow Test Revenue (million), by Application 2024 & 2032
- Figure 9: South America Respiratory Syncytial Virus Lateral Flow Test Revenue Share (%), by Application 2024 & 2032
- Figure 10: South America Respiratory Syncytial Virus Lateral Flow Test Revenue (million), by Types 2024 & 2032
- Figure 11: South America Respiratory Syncytial Virus Lateral Flow Test Revenue Share (%), by Types 2024 & 2032
- Figure 12: South America Respiratory Syncytial Virus Lateral Flow Test Revenue (million), by Country 2024 & 2032
- Figure 13: South America Respiratory Syncytial Virus Lateral Flow Test Revenue Share (%), by Country 2024 & 2032
- Figure 14: Europe Respiratory Syncytial Virus Lateral Flow Test Revenue (million), by Application 2024 & 2032
- Figure 15: Europe Respiratory Syncytial Virus Lateral Flow Test Revenue Share (%), by Application 2024 & 2032
- Figure 16: Europe Respiratory Syncytial Virus Lateral Flow Test Revenue (million), by Types 2024 & 2032
- Figure 17: Europe Respiratory Syncytial Virus Lateral Flow Test Revenue Share (%), by Types 2024 & 2032
- Figure 18: Europe Respiratory Syncytial Virus Lateral Flow Test Revenue (million), by Country 2024 & 2032
- Figure 19: Europe Respiratory Syncytial Virus Lateral Flow Test Revenue Share (%), by Country 2024 & 2032
- Figure 20: Middle East & Africa Respiratory Syncytial Virus Lateral Flow Test Revenue (million), by Application 2024 & 2032
- Figure 21: Middle East & Africa Respiratory Syncytial Virus Lateral Flow Test Revenue Share (%), by Application 2024 & 2032
- Figure 22: Middle East & Africa Respiratory Syncytial Virus Lateral Flow Test Revenue (million), by Types 2024 & 2032
- Figure 23: Middle East & Africa Respiratory Syncytial Virus Lateral Flow Test Revenue Share (%), by Types 2024 & 2032
- Figure 24: Middle East & Africa Respiratory Syncytial Virus Lateral Flow Test Revenue (million), by Country 2024 & 2032
- Figure 25: Middle East & Africa Respiratory Syncytial Virus Lateral Flow Test Revenue Share (%), by Country 2024 & 2032
- Figure 26: Asia Pacific Respiratory Syncytial Virus Lateral Flow Test Revenue (million), by Application 2024 & 2032
- Figure 27: Asia Pacific Respiratory Syncytial Virus Lateral Flow Test Revenue Share (%), by Application 2024 & 2032
- Figure 28: Asia Pacific Respiratory Syncytial Virus Lateral Flow Test Revenue (million), by Types 2024 & 2032
- Figure 29: Asia Pacific Respiratory Syncytial Virus Lateral Flow Test Revenue Share (%), by Types 2024 & 2032
- Figure 30: Asia Pacific Respiratory Syncytial Virus Lateral Flow Test Revenue (million), by Country 2024 & 2032
- Figure 31: Asia Pacific Respiratory Syncytial Virus Lateral Flow Test Revenue Share (%), by Country 2024 & 2032
List of Tables
- Table 1: Global Respiratory Syncytial Virus Lateral Flow Test Revenue million Forecast, by Region 2019 & 2032
- Table 2: Global Respiratory Syncytial Virus Lateral Flow Test Revenue million Forecast, by Application 2019 & 2032
- Table 3: Global Respiratory Syncytial Virus Lateral Flow Test Revenue million Forecast, by Types 2019 & 2032
- Table 4: Global Respiratory Syncytial Virus Lateral Flow Test Revenue million Forecast, by Region 2019 & 2032
- Table 5: Global Respiratory Syncytial Virus Lateral Flow Test Revenue million Forecast, by Application 2019 & 2032
- Table 6: Global Respiratory Syncytial Virus Lateral Flow Test Revenue million Forecast, by Types 2019 & 2032
- Table 7: Global Respiratory Syncytial Virus Lateral Flow Test Revenue million Forecast, by Country 2019 & 2032
- Table 8: United States Respiratory Syncytial Virus Lateral Flow Test Revenue (million) Forecast, by Application 2019 & 2032
- Table 9: Canada Respiratory Syncytial Virus Lateral Flow Test Revenue (million) Forecast, by Application 2019 & 2032
- Table 10: Mexico Respiratory Syncytial Virus Lateral Flow Test Revenue (million) Forecast, by Application 2019 & 2032
- Table 11: Global Respiratory Syncytial Virus Lateral Flow Test Revenue million Forecast, by Application 2019 & 2032
- Table 12: Global Respiratory Syncytial Virus Lateral Flow Test Revenue million Forecast, by Types 2019 & 2032
- Table 13: Global Respiratory Syncytial Virus Lateral Flow Test Revenue million Forecast, by Country 2019 & 2032
- Table 14: Brazil Respiratory Syncytial Virus Lateral Flow Test Revenue (million) Forecast, by Application 2019 & 2032
- Table 15: Argentina Respiratory Syncytial Virus Lateral Flow Test Revenue (million) Forecast, by Application 2019 & 2032
- Table 16: Rest of South America Respiratory Syncytial Virus Lateral Flow Test Revenue (million) Forecast, by Application 2019 & 2032
- Table 17: Global Respiratory Syncytial Virus Lateral Flow Test Revenue million Forecast, by Application 2019 & 2032
- Table 18: Global Respiratory Syncytial Virus Lateral Flow Test Revenue million Forecast, by Types 2019 & 2032
- Table 19: Global Respiratory Syncytial Virus Lateral Flow Test Revenue million Forecast, by Country 2019 & 2032
- Table 20: United Kingdom Respiratory Syncytial Virus Lateral Flow Test Revenue (million) Forecast, by Application 2019 & 2032
- Table 21: Germany Respiratory Syncytial Virus Lateral Flow Test Revenue (million) Forecast, by Application 2019 & 2032
- Table 22: France Respiratory Syncytial Virus Lateral Flow Test Revenue (million) Forecast, by Application 2019 & 2032
- Table 23: Italy Respiratory Syncytial Virus Lateral Flow Test Revenue (million) Forecast, by Application 2019 & 2032
- Table 24: Spain Respiratory Syncytial Virus Lateral Flow Test Revenue (million) Forecast, by Application 2019 & 2032
- Table 25: Russia Respiratory Syncytial Virus Lateral Flow Test Revenue (million) Forecast, by Application 2019 & 2032
- Table 26: Benelux Respiratory Syncytial Virus Lateral Flow Test Revenue (million) Forecast, by Application 2019 & 2032
- Table 27: Nordics Respiratory Syncytial Virus Lateral Flow Test Revenue (million) Forecast, by Application 2019 & 2032
- Table 28: Rest of Europe Respiratory Syncytial Virus Lateral Flow Test Revenue (million) Forecast, by Application 2019 & 2032
- Table 29: Global Respiratory Syncytial Virus Lateral Flow Test Revenue million Forecast, by Application 2019 & 2032
- Table 30: Global Respiratory Syncytial Virus Lateral Flow Test Revenue million Forecast, by Types 2019 & 2032
- Table 31: Global Respiratory Syncytial Virus Lateral Flow Test Revenue million Forecast, by Country 2019 & 2032
- Table 32: Turkey Respiratory Syncytial Virus Lateral Flow Test Revenue (million) Forecast, by Application 2019 & 2032
- Table 33: Israel Respiratory Syncytial Virus Lateral Flow Test Revenue (million) Forecast, by Application 2019 & 2032
- Table 34: GCC Respiratory Syncytial Virus Lateral Flow Test Revenue (million) Forecast, by Application 2019 & 2032
- Table 35: North Africa Respiratory Syncytial Virus Lateral Flow Test Revenue (million) Forecast, by Application 2019 & 2032
- Table 36: South Africa Respiratory Syncytial Virus Lateral Flow Test Revenue (million) Forecast, by Application 2019 & 2032
- Table 37: Rest of Middle East & Africa Respiratory Syncytial Virus Lateral Flow Test Revenue (million) Forecast, by Application 2019 & 2032
- Table 38: Global Respiratory Syncytial Virus Lateral Flow Test Revenue million Forecast, by Application 2019 & 2032
- Table 39: Global Respiratory Syncytial Virus Lateral Flow Test Revenue million Forecast, by Types 2019 & 2032
- Table 40: Global Respiratory Syncytial Virus Lateral Flow Test Revenue million Forecast, by Country 2019 & 2032
- Table 41: China Respiratory Syncytial Virus Lateral Flow Test Revenue (million) Forecast, by Application 2019 & 2032
- Table 42: India Respiratory Syncytial Virus Lateral Flow Test Revenue (million) Forecast, by Application 2019 & 2032
- Table 43: Japan Respiratory Syncytial Virus Lateral Flow Test Revenue (million) Forecast, by Application 2019 & 2032
- Table 44: South Korea Respiratory Syncytial Virus Lateral Flow Test Revenue (million) Forecast, by Application 2019 & 2032
- Table 45: ASEAN Respiratory Syncytial Virus Lateral Flow Test Revenue (million) Forecast, by Application 2019 & 2032
- Table 46: Oceania Respiratory Syncytial Virus Lateral Flow Test Revenue (million) Forecast, by Application 2019 & 2032
- Table 47: Rest of Asia Pacific Respiratory Syncytial Virus Lateral Flow Test Revenue (million) Forecast, by Application 2019 & 2032
Frequently Asked Questions
1. What is the projected Compound Annual Growth Rate (CAGR) of the Respiratory Syncytial Virus Lateral Flow Test?
The projected CAGR is approximately 10.9%.
2. Which companies are prominent players in the Respiratory Syncytial Virus Lateral Flow Test?
Key companies in the market include Thermo Fisher Scientific, Immuview, Abbot, CTK Biotech, Meridian Bioscience, Sekisui Diagnostics, bioMerieux SA, Becton, Dickinson and Company, F. Hoffmann-La Roche Ltd.
3. What are the main segments of the Respiratory Syncytial Virus Lateral Flow Test?
The market segments include Application, Types.
4. Can you provide details about the market size?
The market size is estimated to be USD 929.1 million as of 2022.
5. What are some drivers contributing to market growth?
N/A
6. What are the notable trends driving market growth?
N/A
7. Are there any restraints impacting market growth?
N/A
8. Can you provide examples of recent developments in the market?
N/A
9. What pricing options are available for accessing the report?
Pricing options include single-user, multi-user, and enterprise licenses priced at USD 2900.00, USD 4350.00, and USD 5800.00 respectively.
10. Is the market size provided in terms of value or volume?
The market size is provided in terms of value, measured in million.
11. Are there any specific market keywords associated with the report?
Yes, the market keyword associated with the report is "Respiratory Syncytial Virus Lateral Flow Test," which aids in identifying and referencing the specific market segment covered.
12. How do I determine which pricing option suits my needs best?
The pricing options vary based on user requirements and access needs. Individual users may opt for single-user licenses, while businesses requiring broader access may choose multi-user or enterprise licenses for cost-effective access to the report.
13. Are there any additional resources or data provided in the Respiratory Syncytial Virus Lateral Flow Test report?
While the report offers comprehensive insights, it's advisable to review the specific contents or supplementary materials provided to ascertain if additional resources or data are available.
14. How can I stay updated on further developments or reports in the Respiratory Syncytial Virus Lateral Flow Test?
To stay informed about further developments, trends, and reports in the Respiratory Syncytial Virus Lateral Flow Test, consider subscribing to industry newsletters, following relevant companies and organizations, or regularly checking reputable industry news sources and publications.
Methodology
Step 1 - Identification of Relevant Samples Size from Population Database


Step 2 - Approaches for Defining Global Market Size (Value, Volume* & Price*)

Note*: In applicable scenarios
Step 3 - Data Sources
Primary Research
- Web Analytics
- Survey Reports
- Research Institute
- Latest Research Reports
- Opinion Leaders
Secondary Research
- Annual Reports
- White Paper
- Latest Press Release
- Industry Association
- Paid Database
- Investor Presentations

Step 4 - Data Triangulation
Involves using different sources of information in order to increase the validity of a study
These sources are likely to be stakeholders in a program - participants, other researchers, program staff, other community members, and so on.
Then we put all data in single framework & apply various statistical tools to find out the dynamic on the market.
During the analysis stage, feedback from the stakeholder groups would be compared to determine areas of agreement as well as areas of divergence


