
Key Insights
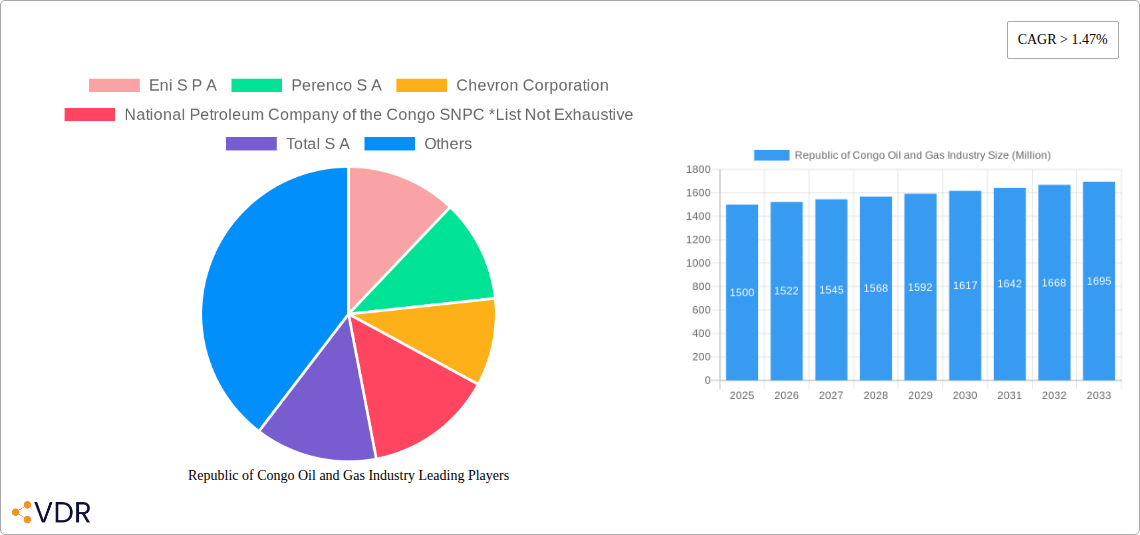
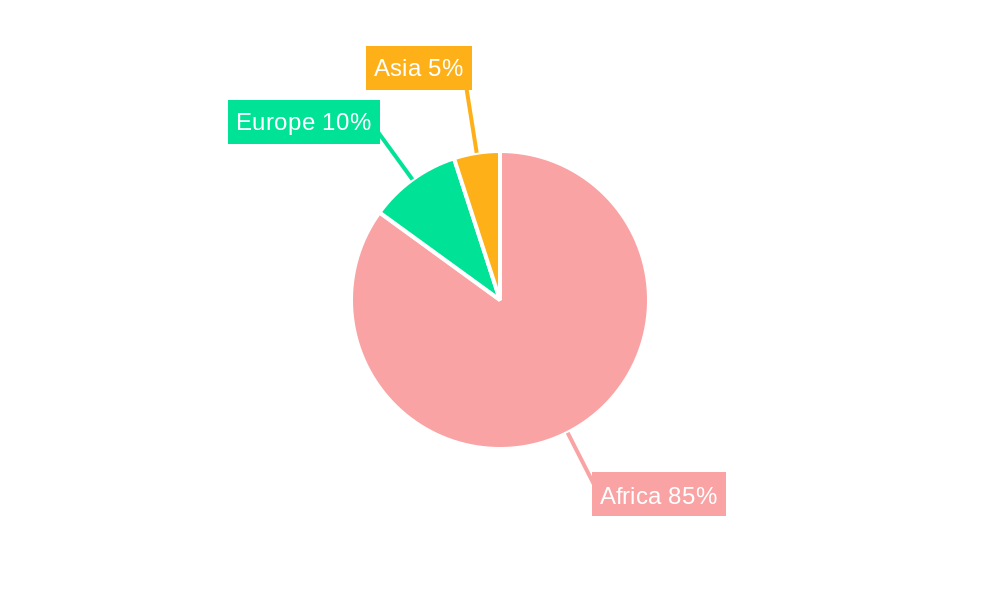
The Republic of Congo's oil and gas industry, while facing certain headwinds, presents a promising outlook for investors and stakeholders. Driven by consistent global demand for energy resources, particularly in the context of a fluctuating global energy market, the sector demonstrates a Compound Annual Growth Rate (CAGR) exceeding 1.47%, indicating steady expansion. The industry is segmented by location (onshore and offshore) and sector (upstream, midstream, and downstream). Major players like Eni S.p.A., Perenco S.A., Chevron Corporation, and the National Petroleum Company of Congo (SNPC), along with TotalEnergies, contribute significantly to production and revenue. While specific regional breakdowns for Germany, France, and the United Kingdom are not provided, their presence suggests significant export markets. Onshore operations are likely prevalent given the country's geographical features, though offshore exploration and extraction are also significant contributors. The upstream sector—exploration, production, and transportation—forms the core of the industry, followed by midstream (processing and storage) and downstream (refining and distribution). Future growth depends on ongoing investment in infrastructure, technological advancements, and potentially, diversification to explore and exploit natural gas reserves, alongside oil production. Challenges include the volatility of global oil prices and the need for continuous investment in upgrading aging infrastructure, ensuring sustainable operations, and maintaining a competitive edge.
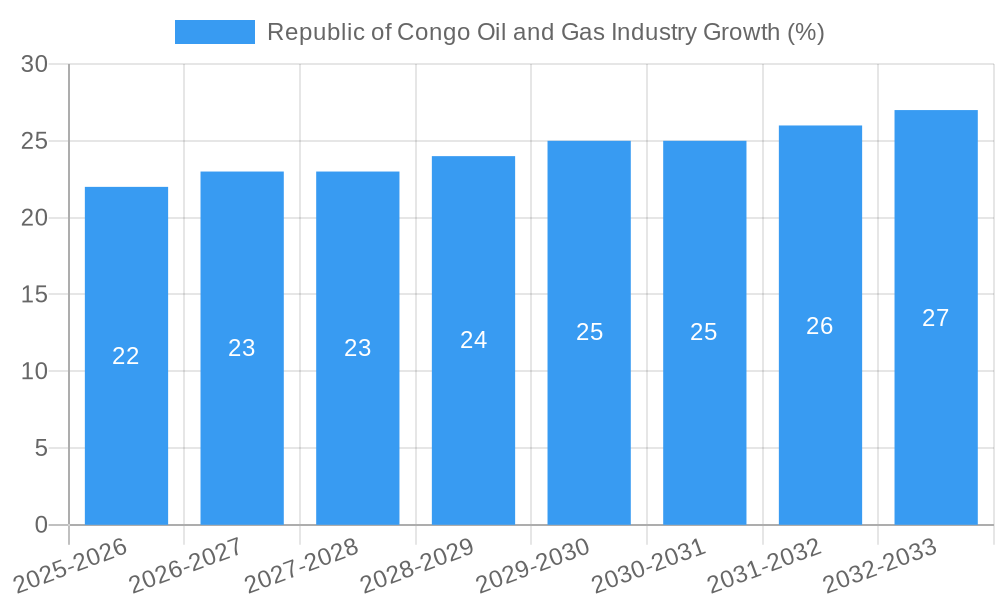
The forecast period of 2025-2033 projects continued growth based on the estimated CAGR. To maintain momentum, the Republic of Congo needs to focus on attracting foreign direct investment through streamlined regulatory processes and transparency in operations. Sustainable practices, minimizing environmental impact, and diversification into renewable energies are essential for long-term stability and growth in the sector. Furthermore, bolstering local expertise and skill development will be vital to ensure industry sustainability and minimize reliance on foreign contractors. Effective management of resources and collaboration with international partners remain crucial in navigating the complexities of the global energy landscape.
Republic of Congo Oil and Gas Industry: A Comprehensive Market Report (2019-2033)
This in-depth report provides a comprehensive analysis of the Republic of Congo's oil and gas industry, covering market dynamics, growth trends, key players, and future outlook. The study period spans from 2019 to 2033, with 2025 serving as the base and estimated year. This report is essential for industry professionals, investors, and policymakers seeking a granular understanding of this dynamic market. Keywords: Republic of Congo, Oil and Gas, Upstream, Midstream, Downstream, Eni, Perenco, Chevron, SNPC, Total, Onshore, Offshore, Market Size, Growth Forecast, M&A, Industry Analysis.
Republic of Congo Oil and Gas Industry Market Dynamics & Structure
This section analyzes the Republic of Congo's oil and gas market structure, encompassing market concentration, technological innovation, regulatory frameworks, competitive substitutes, end-user demographics, and mergers and acquisitions (M&A) activities. The analysis considers both parent markets (Oil & Gas) and child markets (Upstream, Midstream, Downstream, Onshore, Offshore).
- Market Concentration: The market is moderately concentrated, with key players such as Eni S.p.A., Perenco S.A., Chevron Corporation, Total S.A., and the National Petroleum Company of the Congo (SNPC) holding significant market share. Estimates suggest SNPC holds approximately xx% market share in 2025, while Eni, Perenco, and Total collectively account for approximately xx%.
- Technological Innovation: Innovation is driven by the need for enhanced oil recovery (EOR) techniques in mature fields and exploration in deeper waters. However, limited investment in R&D and infrastructure constraints hinder rapid innovation.
- Regulatory Framework: The regulatory landscape influences exploration, production, and pricing, impacting investor confidence and market competitiveness. Recent policy changes have focused on xx, creating both opportunities and challenges.
- Competitive Substitutes: Renewable energy sources represent a growing competitive threat, although their penetration in the Republic of Congo remains relatively low in 2025 (xx%).
- End-User Demographics: The primary end-users are domestic consumers and industrial users, with exports forming a significant portion of production.
- M&A Trends: M&A activity has been moderate in recent years, with xx major deals recorded between 2019 and 2024, primarily involving smaller players. The value of these deals totaled approximately xx Million.
Republic of Congo Oil and Gas Industry Growth Trends & Insights
This section details the Republic of Congo's oil and gas market's evolution, incorporating market size, adoption rates, technological disruptions, and shifts in consumer behavior. The analysis utilizes historical data (2019-2024) and forecasts (2025-2033).
The market experienced a period of [describe market fluctuation from 2019-2024, e.g., moderate growth followed by a slight decline] driven by [mention specific factors, e.g., fluctuating global oil prices, production challenges]. The market size in 2024 reached approximately xx Million, with a projected CAGR of xx% during the forecast period (2025-2033). This growth is anticipated to be driven primarily by [mention drivers, e.g., investment in new exploration projects, increasing domestic demand]. Technological disruptions, such as the adoption of digital oil fields and advanced analytics, are expected to enhance efficiency and increase production yield, though at a moderate pace considering the level of infrastructure development. Consumer behavior is expected to remain largely unchanged, with a continued reliance on fossil fuels for energy needs. Market penetration of renewable sources is projected to remain low at xx% by 2033.
Dominant Regions, Countries, or Segments in Republic of Congo Oil and Gas Industry
This section identifies the leading regions, countries, or market segments driving growth.
The Upstream sector dominates the Republic of Congo's oil and gas industry, accounting for approximately xx% of the total market value in 2025. This dominance is primarily attributable to:
- Significant Oil Reserves: The country possesses substantial onshore and offshore oil reserves, providing a solid foundation for production.
- Existing Infrastructure: Although requiring upgrades, the existing infrastructure enables oil and gas extraction and transportation, unlike many other African nations.
- Government Support: Government policies and incentives aimed at attracting foreign investment and encouraging exploration activity have played a critical role.
While the Onshore segment currently holds a larger market share than the Offshore segment due to existing infrastructure and easier accessibility, the offshore sector presents significant growth potential given the presence of undiscovered reserves and technological advancements enabling deeper water exploration. The Midstream and Downstream sectors are relatively underdeveloped compared to Upstream, presenting significant opportunities for expansion.
Republic of Congo Oil and Gas Industry Product Landscape
The product landscape encompasses crude oil, natural gas, and refined petroleum products. Recent innovations focus on improving extraction efficiency and reducing environmental impact. Technological advancements include enhanced oil recovery techniques and improved pipeline infrastructure. However, the lack of large-scale refinery operations means significant dependence on exporting crude oil.
Key Drivers, Barriers & Challenges in Republic of Congo Oil and Gas Industry
Key Drivers:
- Abundant oil and gas reserves.
- Government incentives for foreign investment.
- Rising global energy demand (though this is subject to global fluctuations and the adoption of renewable energy sources).
Key Challenges and Restraints:
- Infrastructure limitations: Insufficient pipeline capacity and refining capabilities hinder production and export capacity. This translates to a xx Million shortfall in potential revenue in 2025.
- Regulatory uncertainty: Changes in government policies can create instability for investors.
- Competition: Competition from other oil-producing nations in the region limits market share.
- Geopolitical risks: Political instability can disrupt production and investment.
Emerging Opportunities in Republic of Congo Oil and Gas Industry
Emerging opportunities include:
- Investment in downstream infrastructure: Developing refining capabilities and expanding the domestic market for refined products.
- Exploration of offshore reserves: Unlocking the potential of deepwater fields.
- Adoption of renewable energy technologies: Diversification into renewable energy sources can mitigate dependence on fossil fuels.
Growth Accelerators in the Republic of Congo Oil and Gas Industry
Long-term growth will be driven by:
Strategic partnerships with international oil companies, investment in infrastructure development, and exploration of previously untapped reserves will significantly accelerate growth. Diversification into gas production and downstream activities is also crucial for sustainable development.
Key Players Shaping the Republic of Congo Oil and Gas Industry Market
- Eni S.p.A.
- Perenco S.A.
- Chevron Corporation
- National Petroleum Company of the Congo SNPC
- TotalEnergies S.A.
Notable Milestones in Republic of Congo Oil and Gas Industry Sector
- 2021: [Insert specific milestone and impact]
- 2022: [Insert specific milestone and impact]
- 2023: [Insert specific milestone and impact]
- 2024: [Insert specific milestone and impact]
In-Depth Republic of Congo Oil and Gas Industry Market Outlook
The Republic of Congo's oil and gas industry holds significant long-term potential, fueled by substantial reserves and increasing global energy demand. Strategic investments in infrastructure, technological advancements in exploration and production, and fostering a stable regulatory environment are crucial for realizing this potential. The market is projected to experience consistent growth over the next decade, presenting attractive opportunities for investors and stakeholders willing to navigate the inherent challenges.
Republic of Congo Oil and Gas Industry Segmentation
-
1. Upstream
-
1.1. Location of Deployment
-
1.1.1. Onshore
- 1.1.1.1. Overview
-
1.1.1.2. Key Projects
- 1.1.1.2.1. Existing Projects
- 1.1.1.2.2. Projects in Pipeline
- 1.1.1.2.3. Upcoming Projects
- 1.1.2. Offshore
-
1.1.1. Onshore
-
1.1. Location of Deployment
-
2. Midstream
- 2.1. Overview
-
2.2. Key Projects
- 2.2.1. Existing Infrastructure
- 2.2.2. Projects in pipeline
- 2.2.3. Upcoming projects
-
3. Downstream
-
3.1. Refineries
- 3.1.1. Overview
-
3.1.2. Key Projects
- 3.1.2.1. Existing Infrastructure
- 3.1.2.2. Projects in pipeline
- 3.1.2.3. Upcoming projects
- 3.2. Petrochemicals Plants
-
3.1. Refineries
Republic of Congo Oil and Gas Industry Segmentation By Geography
-
1. North America
- 1.1. United States
- 1.2. Canada
- 1.3. Mexico
-
2. South America
- 2.1. Brazil
- 2.2. Argentina
- 2.3. Rest of South America
-
3. Europe
- 3.1. United Kingdom
- 3.2. Germany
- 3.3. France
- 3.4. Italy
- 3.5. Spain
- 3.6. Russia
- 3.7. Benelux
- 3.8. Nordics
- 3.9. Rest of Europe
-
4. Middle East & Africa
- 4.1. Turkey
- 4.2. Israel
- 4.3. GCC
- 4.4. North Africa
- 4.5. South Africa
- 4.6. Rest of Middle East & Africa
-
5. Asia Pacific
- 5.1. China
- 5.2. India
- 5.3. Japan
- 5.4. South Korea
- 5.5. ASEAN
- 5.6. Oceania
- 5.7. Rest of Asia Pacific
Republic of Congo Oil and Gas Industry REPORT HIGHLIGHTS
| Aspects | Details |
|---|---|
| Study Period | 2019-2033 |
| Base Year | 2024 |
| Estimated Year | 2025 |
| Forecast Period | 2025-2033 |
| Historical Period | 2019-2024 |
| Growth Rate | CAGR of > 1.47% from 2019-2033 |
| Segmentation |
|
Table of Contents
- 1. Introduction
- 1.1. Research Scope
- 1.2. Market Segmentation
- 1.3. Research Methodology
- 1.4. Definitions and Assumptions
- 2. Executive Summary
- 2.1. Introduction
- 3. Market Dynamics
- 3.1. Introduction
- 3.2. Market Drivers
- 3.2.1. 4.; Declining Solar Panel Costs4.; Supportive Government Policies
- 3.3. Market Restrains
- 3.3.1. 4.; High Upfront Cost
- 3.4. Market Trends
- 3.4.1. Upstream Sector to Witness Growth
- 4. Market Factor Analysis
- 4.1. Porters Five Forces
- 4.2. Supply/Value Chain
- 4.3. PESTEL analysis
- 4.4. Market Entropy
- 4.5. Patent/Trademark Analysis
- 5. Global Republic of Congo Oil and Gas Industry Analysis, Insights and Forecast, 2019-2031
- 5.1. Market Analysis, Insights and Forecast - by Upstream
- 5.1.1. Location of Deployment
- 5.1.1.1. Onshore
- 5.1.1.1.1. Overview
- 5.1.1.1.2. Key Projects
- 5.1.1.1.2.1. Existing Projects
- 5.1.1.1.2.2. Projects in Pipeline
- 5.1.1.1.2.3. Upcoming Projects
- 5.1.1.2. Offshore
- 5.1.1.1. Onshore
- 5.1.1. Location of Deployment
- 5.2. Market Analysis, Insights and Forecast - by Midstream
- 5.2.1. Overview
- 5.2.2. Key Projects
- 5.2.2.1. Existing Infrastructure
- 5.2.2.2. Projects in pipeline
- 5.2.2.3. Upcoming projects
- 5.3. Market Analysis, Insights and Forecast - by Downstream
- 5.3.1. Refineries
- 5.3.1.1. Overview
- 5.3.1.2. Key Projects
- 5.3.1.2.1. Existing Infrastructure
- 5.3.1.2.2. Projects in pipeline
- 5.3.1.2.3. Upcoming projects
- 5.3.2. Petrochemicals Plants
- 5.3.1. Refineries
- 5.4. Market Analysis, Insights and Forecast - by Region
- 5.4.1. North America
- 5.4.2. South America
- 5.4.3. Europe
- 5.4.4. Middle East & Africa
- 5.4.5. Asia Pacific
- 5.1. Market Analysis, Insights and Forecast - by Upstream
- 6. North America Republic of Congo Oil and Gas Industry Analysis, Insights and Forecast, 2019-2031
- 6.1. Market Analysis, Insights and Forecast - by Upstream
- 6.1.1. Location of Deployment
- 6.1.1.1. Onshore
- 6.1.1.1.1. Overview
- 6.1.1.1.2. Key Projects
- 6.1.1.1.2.1. Existing Projects
- 6.1.1.1.2.2. Projects in Pipeline
- 6.1.1.1.2.3. Upcoming Projects
- 6.1.1.2. Offshore
- 6.1.1.1. Onshore
- 6.1.1. Location of Deployment
- 6.2. Market Analysis, Insights and Forecast - by Midstream
- 6.2.1. Overview
- 6.2.2. Key Projects
- 6.2.2.1. Existing Infrastructure
- 6.2.2.2. Projects in pipeline
- 6.2.2.3. Upcoming projects
- 6.3. Market Analysis, Insights and Forecast - by Downstream
- 6.3.1. Refineries
- 6.3.1.1. Overview
- 6.3.1.2. Key Projects
- 6.3.1.2.1. Existing Infrastructure
- 6.3.1.2.2. Projects in pipeline
- 6.3.1.2.3. Upcoming projects
- 6.3.2. Petrochemicals Plants
- 6.3.1. Refineries
- 6.1. Market Analysis, Insights and Forecast - by Upstream
- 7. South America Republic of Congo Oil and Gas Industry Analysis, Insights and Forecast, 2019-2031
- 7.1. Market Analysis, Insights and Forecast - by Upstream
- 7.1.1. Location of Deployment
- 7.1.1.1. Onshore
- 7.1.1.1.1. Overview
- 7.1.1.1.2. Key Projects
- 7.1.1.1.2.1. Existing Projects
- 7.1.1.1.2.2. Projects in Pipeline
- 7.1.1.1.2.3. Upcoming Projects
- 7.1.1.2. Offshore
- 7.1.1.1. Onshore
- 7.1.1. Location of Deployment
- 7.2. Market Analysis, Insights and Forecast - by Midstream
- 7.2.1. Overview
- 7.2.2. Key Projects
- 7.2.2.1. Existing Infrastructure
- 7.2.2.2. Projects in pipeline
- 7.2.2.3. Upcoming projects
- 7.3. Market Analysis, Insights and Forecast - by Downstream
- 7.3.1. Refineries
- 7.3.1.1. Overview
- 7.3.1.2. Key Projects
- 7.3.1.2.1. Existing Infrastructure
- 7.3.1.2.2. Projects in pipeline
- 7.3.1.2.3. Upcoming projects
- 7.3.2. Petrochemicals Plants
- 7.3.1. Refineries
- 7.1. Market Analysis, Insights and Forecast - by Upstream
- 8. Europe Republic of Congo Oil and Gas Industry Analysis, Insights and Forecast, 2019-2031
- 8.1. Market Analysis, Insights and Forecast - by Upstream
- 8.1.1. Location of Deployment
- 8.1.1.1. Onshore
- 8.1.1.1.1. Overview
- 8.1.1.1.2. Key Projects
- 8.1.1.1.2.1. Existing Projects
- 8.1.1.1.2.2. Projects in Pipeline
- 8.1.1.1.2.3. Upcoming Projects
- 8.1.1.2. Offshore
- 8.1.1.1. Onshore
- 8.1.1. Location of Deployment
- 8.2. Market Analysis, Insights and Forecast - by Midstream
- 8.2.1. Overview
- 8.2.2. Key Projects
- 8.2.2.1. Existing Infrastructure
- 8.2.2.2. Projects in pipeline
- 8.2.2.3. Upcoming projects
- 8.3. Market Analysis, Insights and Forecast - by Downstream
- 8.3.1. Refineries
- 8.3.1.1. Overview
- 8.3.1.2. Key Projects
- 8.3.1.2.1. Existing Infrastructure
- 8.3.1.2.2. Projects in pipeline
- 8.3.1.2.3. Upcoming projects
- 8.3.2. Petrochemicals Plants
- 8.3.1. Refineries
- 8.1. Market Analysis, Insights and Forecast - by Upstream
- 9. Middle East & Africa Republic of Congo Oil and Gas Industry Analysis, Insights and Forecast, 2019-2031
- 9.1. Market Analysis, Insights and Forecast - by Upstream
- 9.1.1. Location of Deployment
- 9.1.1.1. Onshore
- 9.1.1.1.1. Overview
- 9.1.1.1.2. Key Projects
- 9.1.1.1.2.1. Existing Projects
- 9.1.1.1.2.2. Projects in Pipeline
- 9.1.1.1.2.3. Upcoming Projects
- 9.1.1.2. Offshore
- 9.1.1.1. Onshore
- 9.1.1. Location of Deployment
- 9.2. Market Analysis, Insights and Forecast - by Midstream
- 9.2.1. Overview
- 9.2.2. Key Projects
- 9.2.2.1. Existing Infrastructure
- 9.2.2.2. Projects in pipeline
- 9.2.2.3. Upcoming projects
- 9.3. Market Analysis, Insights and Forecast - by Downstream
- 9.3.1. Refineries
- 9.3.1.1. Overview
- 9.3.1.2. Key Projects
- 9.3.1.2.1. Existing Infrastructure
- 9.3.1.2.2. Projects in pipeline
- 9.3.1.2.3. Upcoming projects
- 9.3.2. Petrochemicals Plants
- 9.3.1. Refineries
- 9.1. Market Analysis, Insights and Forecast - by Upstream
- 10. Asia Pacific Republic of Congo Oil and Gas Industry Analysis, Insights and Forecast, 2019-2031
- 10.1. Market Analysis, Insights and Forecast - by Upstream
- 10.1.1. Location of Deployment
- 10.1.1.1. Onshore
- 10.1.1.1.1. Overview
- 10.1.1.1.2. Key Projects
- 10.1.1.1.2.1. Existing Projects
- 10.1.1.1.2.2. Projects in Pipeline
- 10.1.1.1.2.3. Upcoming Projects
- 10.1.1.2. Offshore
- 10.1.1.1. Onshore
- 10.1.1. Location of Deployment
- 10.2. Market Analysis, Insights and Forecast - by Midstream
- 10.2.1. Overview
- 10.2.2. Key Projects
- 10.2.2.1. Existing Infrastructure
- 10.2.2.2. Projects in pipeline
- 10.2.2.3. Upcoming projects
- 10.3. Market Analysis, Insights and Forecast - by Downstream
- 10.3.1. Refineries
- 10.3.1.1. Overview
- 10.3.1.2. Key Projects
- 10.3.1.2.1. Existing Infrastructure
- 10.3.1.2.2. Projects in pipeline
- 10.3.1.2.3. Upcoming projects
- 10.3.2. Petrochemicals Plants
- 10.3.1. Refineries
- 10.1. Market Analysis, Insights and Forecast - by Upstream
- 11. Germany Republic of Congo Oil and Gas Industry Analysis, Insights and Forecast, 2019-2031
- 11.1. Market Analysis, Insights and Forecast - By Country/Sub-region
- 11.1.1.
- 12. France Republic of Congo Oil and Gas Industry Analysis, Insights and Forecast, 2019-2031
- 12.1. Market Analysis, Insights and Forecast - By Country/Sub-region
- 12.1.1.
- 13. United Kingdom Republic of Congo Oil and Gas Industry Analysis, Insights and Forecast, 2019-2031
- 13.1. Market Analysis, Insights and Forecast - By Country/Sub-region
- 13.1.1.
- 14. Rest of Europe Republic of Congo Oil and Gas Industry Analysis, Insights and Forecast, 2019-2031
- 14.1. Market Analysis, Insights and Forecast - By Country/Sub-region
- 14.1.1.
- 15. Competitive Analysis
- 15.1. Global Market Share Analysis 2024
- 15.2. Company Profiles
- 15.2.1 Eni S P A
- 15.2.1.1. Overview
- 15.2.1.2. Products
- 15.2.1.3. SWOT Analysis
- 15.2.1.4. Recent Developments
- 15.2.1.5. Financials (Based on Availability)
- 15.2.2 Perenco S A
- 15.2.2.1. Overview
- 15.2.2.2. Products
- 15.2.2.3. SWOT Analysis
- 15.2.2.4. Recent Developments
- 15.2.2.5. Financials (Based on Availability)
- 15.2.3 Chevron Corporation
- 15.2.3.1. Overview
- 15.2.3.2. Products
- 15.2.3.3. SWOT Analysis
- 15.2.3.4. Recent Developments
- 15.2.3.5. Financials (Based on Availability)
- 15.2.4 National Petroleum Company of the Congo SNPC *List Not Exhaustive
- 15.2.4.1. Overview
- 15.2.4.2. Products
- 15.2.4.3. SWOT Analysis
- 15.2.4.4. Recent Developments
- 15.2.4.5. Financials (Based on Availability)
- 15.2.5 Total S A
- 15.2.5.1. Overview
- 15.2.5.2. Products
- 15.2.5.3. SWOT Analysis
- 15.2.5.4. Recent Developments
- 15.2.5.5. Financials (Based on Availability)
- 15.2.1 Eni S P A
List of Figures
- Figure 1: Global Republic of Congo Oil and Gas Industry Revenue Breakdown (Million, %) by Region 2024 & 2032
- Figure 2: Germany Republic of Congo Oil and Gas Industry Revenue (Million), by Country 2024 & 2032
- Figure 3: Germany Republic of Congo Oil and Gas Industry Revenue Share (%), by Country 2024 & 2032
- Figure 4: France Republic of Congo Oil and Gas Industry Revenue (Million), by Country 2024 & 2032
- Figure 5: France Republic of Congo Oil and Gas Industry Revenue Share (%), by Country 2024 & 2032
- Figure 6: United Kingdom Republic of Congo Oil and Gas Industry Revenue (Million), by Country 2024 & 2032
- Figure 7: United Kingdom Republic of Congo Oil and Gas Industry Revenue Share (%), by Country 2024 & 2032
- Figure 8: Rest of Europe Republic of Congo Oil and Gas Industry Revenue (Million), by Country 2024 & 2032
- Figure 9: Rest of Europe Republic of Congo Oil and Gas Industry Revenue Share (%), by Country 2024 & 2032
- Figure 10: North America Republic of Congo Oil and Gas Industry Revenue (Million), by Upstream 2024 & 2032
- Figure 11: North America Republic of Congo Oil and Gas Industry Revenue Share (%), by Upstream 2024 & 2032
- Figure 12: North America Republic of Congo Oil and Gas Industry Revenue (Million), by Midstream 2024 & 2032
- Figure 13: North America Republic of Congo Oil and Gas Industry Revenue Share (%), by Midstream 2024 & 2032
- Figure 14: North America Republic of Congo Oil and Gas Industry Revenue (Million), by Downstream 2024 & 2032
- Figure 15: North America Republic of Congo Oil and Gas Industry Revenue Share (%), by Downstream 2024 & 2032
- Figure 16: North America Republic of Congo Oil and Gas Industry Revenue (Million), by Country 2024 & 2032
- Figure 17: North America Republic of Congo Oil and Gas Industry Revenue Share (%), by Country 2024 & 2032
- Figure 18: South America Republic of Congo Oil and Gas Industry Revenue (Million), by Upstream 2024 & 2032
- Figure 19: South America Republic of Congo Oil and Gas Industry Revenue Share (%), by Upstream 2024 & 2032
- Figure 20: South America Republic of Congo Oil and Gas Industry Revenue (Million), by Midstream 2024 & 2032
- Figure 21: South America Republic of Congo Oil and Gas Industry Revenue Share (%), by Midstream 2024 & 2032
- Figure 22: South America Republic of Congo Oil and Gas Industry Revenue (Million), by Downstream 2024 & 2032
- Figure 23: South America Republic of Congo Oil and Gas Industry Revenue Share (%), by Downstream 2024 & 2032
- Figure 24: South America Republic of Congo Oil and Gas Industry Revenue (Million), by Country 2024 & 2032
- Figure 25: South America Republic of Congo Oil and Gas Industry Revenue Share (%), by Country 2024 & 2032
- Figure 26: Europe Republic of Congo Oil and Gas Industry Revenue (Million), by Upstream 2024 & 2032
- Figure 27: Europe Republic of Congo Oil and Gas Industry Revenue Share (%), by Upstream 2024 & 2032
- Figure 28: Europe Republic of Congo Oil and Gas Industry Revenue (Million), by Midstream 2024 & 2032
- Figure 29: Europe Republic of Congo Oil and Gas Industry Revenue Share (%), by Midstream 2024 & 2032
- Figure 30: Europe Republic of Congo Oil and Gas Industry Revenue (Million), by Downstream 2024 & 2032
- Figure 31: Europe Republic of Congo Oil and Gas Industry Revenue Share (%), by Downstream 2024 & 2032
- Figure 32: Europe Republic of Congo Oil and Gas Industry Revenue (Million), by Country 2024 & 2032
- Figure 33: Europe Republic of Congo Oil and Gas Industry Revenue Share (%), by Country 2024 & 2032
- Figure 34: Middle East & Africa Republic of Congo Oil and Gas Industry Revenue (Million), by Upstream 2024 & 2032
- Figure 35: Middle East & Africa Republic of Congo Oil and Gas Industry Revenue Share (%), by Upstream 2024 & 2032
- Figure 36: Middle East & Africa Republic of Congo Oil and Gas Industry Revenue (Million), by Midstream 2024 & 2032
- Figure 37: Middle East & Africa Republic of Congo Oil and Gas Industry Revenue Share (%), by Midstream 2024 & 2032
- Figure 38: Middle East & Africa Republic of Congo Oil and Gas Industry Revenue (Million), by Downstream 2024 & 2032
- Figure 39: Middle East & Africa Republic of Congo Oil and Gas Industry Revenue Share (%), by Downstream 2024 & 2032
- Figure 40: Middle East & Africa Republic of Congo Oil and Gas Industry Revenue (Million), by Country 2024 & 2032
- Figure 41: Middle East & Africa Republic of Congo Oil and Gas Industry Revenue Share (%), by Country 2024 & 2032
- Figure 42: Asia Pacific Republic of Congo Oil and Gas Industry Revenue (Million), by Upstream 2024 & 2032
- Figure 43: Asia Pacific Republic of Congo Oil and Gas Industry Revenue Share (%), by Upstream 2024 & 2032
- Figure 44: Asia Pacific Republic of Congo Oil and Gas Industry Revenue (Million), by Midstream 2024 & 2032
- Figure 45: Asia Pacific Republic of Congo Oil and Gas Industry Revenue Share (%), by Midstream 2024 & 2032
- Figure 46: Asia Pacific Republic of Congo Oil and Gas Industry Revenue (Million), by Downstream 2024 & 2032
- Figure 47: Asia Pacific Republic of Congo Oil and Gas Industry Revenue Share (%), by Downstream 2024 & 2032
- Figure 48: Asia Pacific Republic of Congo Oil and Gas Industry Revenue (Million), by Country 2024 & 2032
- Figure 49: Asia Pacific Republic of Congo Oil and Gas Industry Revenue Share (%), by Country 2024 & 2032
List of Tables
- Table 1: Global Republic of Congo Oil and Gas Industry Revenue Million Forecast, by Region 2019 & 2032
- Table 2: Global Republic of Congo Oil and Gas Industry Revenue Million Forecast, by Upstream 2019 & 2032
- Table 3: Global Republic of Congo Oil and Gas Industry Revenue Million Forecast, by Midstream 2019 & 2032
- Table 4: Global Republic of Congo Oil and Gas Industry Revenue Million Forecast, by Downstream 2019 & 2032
- Table 5: Global Republic of Congo Oil and Gas Industry Revenue Million Forecast, by Region 2019 & 2032
- Table 6: Global Republic of Congo Oil and Gas Industry Revenue Million Forecast, by Country 2019 & 2032
- Table 7: Republic of Congo Oil and Gas Industry Revenue (Million) Forecast, by Application 2019 & 2032
- Table 8: Global Republic of Congo Oil and Gas Industry Revenue Million Forecast, by Country 2019 & 2032
- Table 9: Republic of Congo Oil and Gas Industry Revenue (Million) Forecast, by Application 2019 & 2032
- Table 10: Global Republic of Congo Oil and Gas Industry Revenue Million Forecast, by Country 2019 & 2032
- Table 11: Republic of Congo Oil and Gas Industry Revenue (Million) Forecast, by Application 2019 & 2032
- Table 12: Global Republic of Congo Oil and Gas Industry Revenue Million Forecast, by Country 2019 & 2032
- Table 13: Republic of Congo Oil and Gas Industry Revenue (Million) Forecast, by Application 2019 & 2032
- Table 14: Global Republic of Congo Oil and Gas Industry Revenue Million Forecast, by Upstream 2019 & 2032
- Table 15: Global Republic of Congo Oil and Gas Industry Revenue Million Forecast, by Midstream 2019 & 2032
- Table 16: Global Republic of Congo Oil and Gas Industry Revenue Million Forecast, by Downstream 2019 & 2032
- Table 17: Global Republic of Congo Oil and Gas Industry Revenue Million Forecast, by Country 2019 & 2032
- Table 18: United States Republic of Congo Oil and Gas Industry Revenue (Million) Forecast, by Application 2019 & 2032
- Table 19: Canada Republic of Congo Oil and Gas Industry Revenue (Million) Forecast, by Application 2019 & 2032
- Table 20: Mexico Republic of Congo Oil and Gas Industry Revenue (Million) Forecast, by Application 2019 & 2032
- Table 21: Global Republic of Congo Oil and Gas Industry Revenue Million Forecast, by Upstream 2019 & 2032
- Table 22: Global Republic of Congo Oil and Gas Industry Revenue Million Forecast, by Midstream 2019 & 2032
- Table 23: Global Republic of Congo Oil and Gas Industry Revenue Million Forecast, by Downstream 2019 & 2032
- Table 24: Global Republic of Congo Oil and Gas Industry Revenue Million Forecast, by Country 2019 & 2032
- Table 25: Brazil Republic of Congo Oil and Gas Industry Revenue (Million) Forecast, by Application 2019 & 2032
- Table 26: Argentina Republic of Congo Oil and Gas Industry Revenue (Million) Forecast, by Application 2019 & 2032
- Table 27: Rest of South America Republic of Congo Oil and Gas Industry Revenue (Million) Forecast, by Application 2019 & 2032
- Table 28: Global Republic of Congo Oil and Gas Industry Revenue Million Forecast, by Upstream 2019 & 2032
- Table 29: Global Republic of Congo Oil and Gas Industry Revenue Million Forecast, by Midstream 2019 & 2032
- Table 30: Global Republic of Congo Oil and Gas Industry Revenue Million Forecast, by Downstream 2019 & 2032
- Table 31: Global Republic of Congo Oil and Gas Industry Revenue Million Forecast, by Country 2019 & 2032
- Table 32: United Kingdom Republic of Congo Oil and Gas Industry Revenue (Million) Forecast, by Application 2019 & 2032
- Table 33: Germany Republic of Congo Oil and Gas Industry Revenue (Million) Forecast, by Application 2019 & 2032
- Table 34: France Republic of Congo Oil and Gas Industry Revenue (Million) Forecast, by Application 2019 & 2032
- Table 35: Italy Republic of Congo Oil and Gas Industry Revenue (Million) Forecast, by Application 2019 & 2032
- Table 36: Spain Republic of Congo Oil and Gas Industry Revenue (Million) Forecast, by Application 2019 & 2032
- Table 37: Russia Republic of Congo Oil and Gas Industry Revenue (Million) Forecast, by Application 2019 & 2032
- Table 38: Benelux Republic of Congo Oil and Gas Industry Revenue (Million) Forecast, by Application 2019 & 2032
- Table 39: Nordics Republic of Congo Oil and Gas Industry Revenue (Million) Forecast, by Application 2019 & 2032
- Table 40: Rest of Europe Republic of Congo Oil and Gas Industry Revenue (Million) Forecast, by Application 2019 & 2032
- Table 41: Global Republic of Congo Oil and Gas Industry Revenue Million Forecast, by Upstream 2019 & 2032
- Table 42: Global Republic of Congo Oil and Gas Industry Revenue Million Forecast, by Midstream 2019 & 2032
- Table 43: Global Republic of Congo Oil and Gas Industry Revenue Million Forecast, by Downstream 2019 & 2032
- Table 44: Global Republic of Congo Oil and Gas Industry Revenue Million Forecast, by Country 2019 & 2032
- Table 45: Turkey Republic of Congo Oil and Gas Industry Revenue (Million) Forecast, by Application 2019 & 2032
- Table 46: Israel Republic of Congo Oil and Gas Industry Revenue (Million) Forecast, by Application 2019 & 2032
- Table 47: GCC Republic of Congo Oil and Gas Industry Revenue (Million) Forecast, by Application 2019 & 2032
- Table 48: North Africa Republic of Congo Oil and Gas Industry Revenue (Million) Forecast, by Application 2019 & 2032
- Table 49: South Africa Republic of Congo Oil and Gas Industry Revenue (Million) Forecast, by Application 2019 & 2032
- Table 50: Rest of Middle East & Africa Republic of Congo Oil and Gas Industry Revenue (Million) Forecast, by Application 2019 & 2032
- Table 51: Global Republic of Congo Oil and Gas Industry Revenue Million Forecast, by Upstream 2019 & 2032
- Table 52: Global Republic of Congo Oil and Gas Industry Revenue Million Forecast, by Midstream 2019 & 2032
- Table 53: Global Republic of Congo Oil and Gas Industry Revenue Million Forecast, by Downstream 2019 & 2032
- Table 54: Global Republic of Congo Oil and Gas Industry Revenue Million Forecast, by Country 2019 & 2032
- Table 55: China Republic of Congo Oil and Gas Industry Revenue (Million) Forecast, by Application 2019 & 2032
- Table 56: India Republic of Congo Oil and Gas Industry Revenue (Million) Forecast, by Application 2019 & 2032
- Table 57: Japan Republic of Congo Oil and Gas Industry Revenue (Million) Forecast, by Application 2019 & 2032
- Table 58: South Korea Republic of Congo Oil and Gas Industry Revenue (Million) Forecast, by Application 2019 & 2032
- Table 59: ASEAN Republic of Congo Oil and Gas Industry Revenue (Million) Forecast, by Application 2019 & 2032
- Table 60: Oceania Republic of Congo Oil and Gas Industry Revenue (Million) Forecast, by Application 2019 & 2032
- Table 61: Rest of Asia Pacific Republic of Congo Oil and Gas Industry Revenue (Million) Forecast, by Application 2019 & 2032
Frequently Asked Questions
1. What is the projected Compound Annual Growth Rate (CAGR) of the Republic of Congo Oil and Gas Industry?
The projected CAGR is approximately > 1.47%.
2. Which companies are prominent players in the Republic of Congo Oil and Gas Industry?
Key companies in the market include Eni S P A, Perenco S A, Chevron Corporation, National Petroleum Company of the Congo SNPC *List Not Exhaustive, Total S A.
3. What are the main segments of the Republic of Congo Oil and Gas Industry?
The market segments include Upstream, Midstream, Downstream.
4. Can you provide details about the market size?
The market size is estimated to be USD XX Million as of 2022.
5. What are some drivers contributing to market growth?
4.; Declining Solar Panel Costs4.; Supportive Government Policies.
6. What are the notable trends driving market growth?
Upstream Sector to Witness Growth.
7. Are there any restraints impacting market growth?
4.; High Upfront Cost.
8. Can you provide examples of recent developments in the market?
N/A
9. What pricing options are available for accessing the report?
Pricing options include single-user, multi-user, and enterprise licenses priced at USD 3800, USD 4500, and USD 5800 respectively.
10. Is the market size provided in terms of value or volume?
The market size is provided in terms of value, measured in Million.
11. Are there any specific market keywords associated with the report?
Yes, the market keyword associated with the report is "Republic of Congo Oil and Gas Industry," which aids in identifying and referencing the specific market segment covered.
12. How do I determine which pricing option suits my needs best?
The pricing options vary based on user requirements and access needs. Individual users may opt for single-user licenses, while businesses requiring broader access may choose multi-user or enterprise licenses for cost-effective access to the report.
13. Are there any additional resources or data provided in the Republic of Congo Oil and Gas Industry report?
While the report offers comprehensive insights, it's advisable to review the specific contents or supplementary materials provided to ascertain if additional resources or data are available.
14. How can I stay updated on further developments or reports in the Republic of Congo Oil and Gas Industry?
To stay informed about further developments, trends, and reports in the Republic of Congo Oil and Gas Industry, consider subscribing to industry newsletters, following relevant companies and organizations, or regularly checking reputable industry news sources and publications.
Methodology
Step 1 - Identification of Relevant Samples Size from Population Database


Step 2 - Approaches for Defining Global Market Size (Value, Volume* & Price*)

Note*: In applicable scenarios
Step 3 - Data Sources
Primary Research
- Web Analytics
- Survey Reports
- Research Institute
- Latest Research Reports
- Opinion Leaders
Secondary Research
- Annual Reports
- White Paper
- Latest Press Release
- Industry Association
- Paid Database
- Investor Presentations

Step 4 - Data Triangulation
Involves using different sources of information in order to increase the validity of a study
These sources are likely to be stakeholders in a program - participants, other researchers, program staff, other community members, and so on.
Then we put all data in single framework & apply various statistical tools to find out the dynamic on the market.
During the analysis stage, feedback from the stakeholder groups would be compared to determine areas of agreement as well as areas of divergence


