
Key Insights
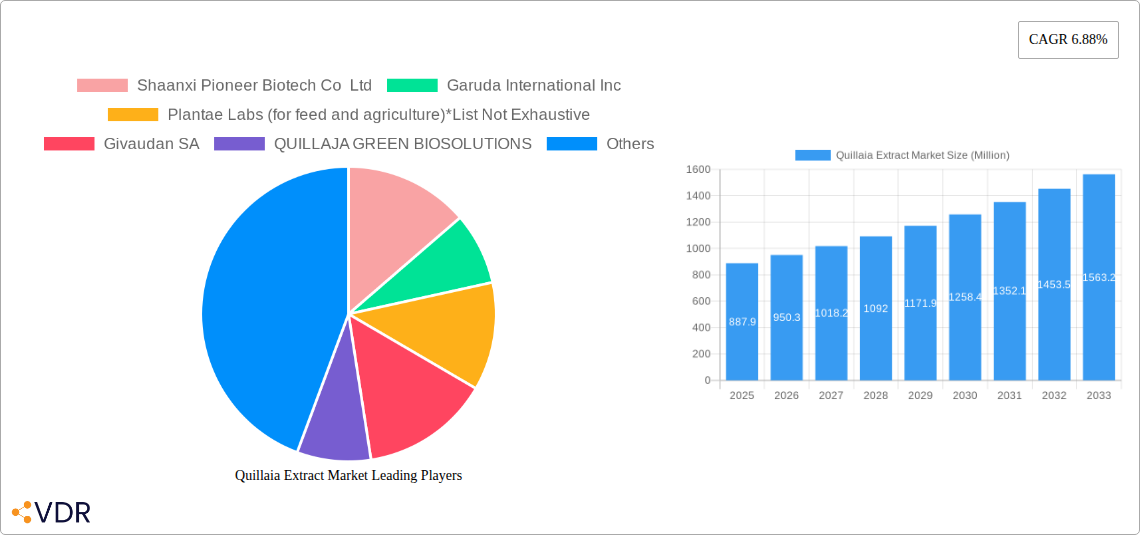
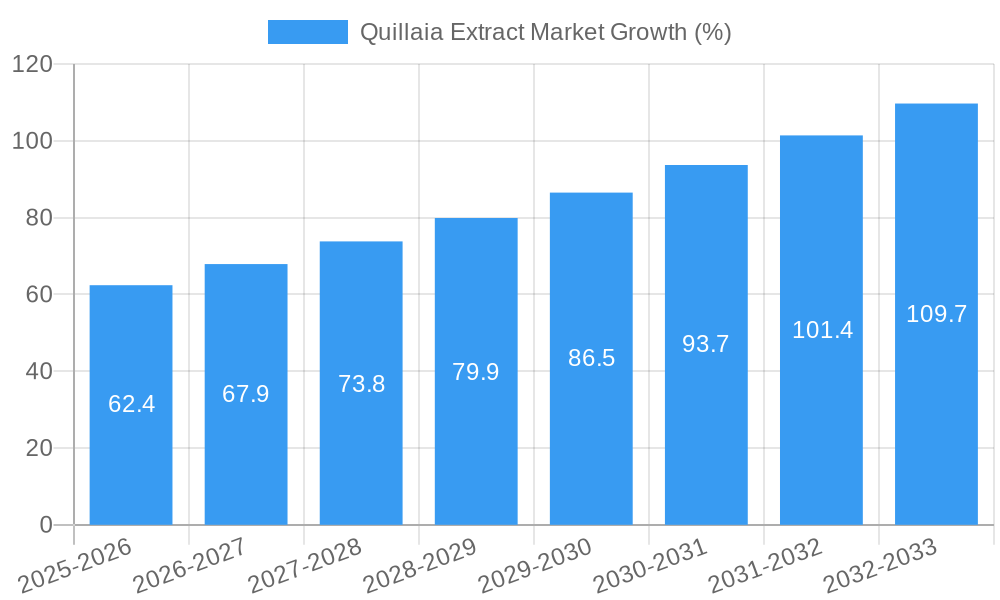
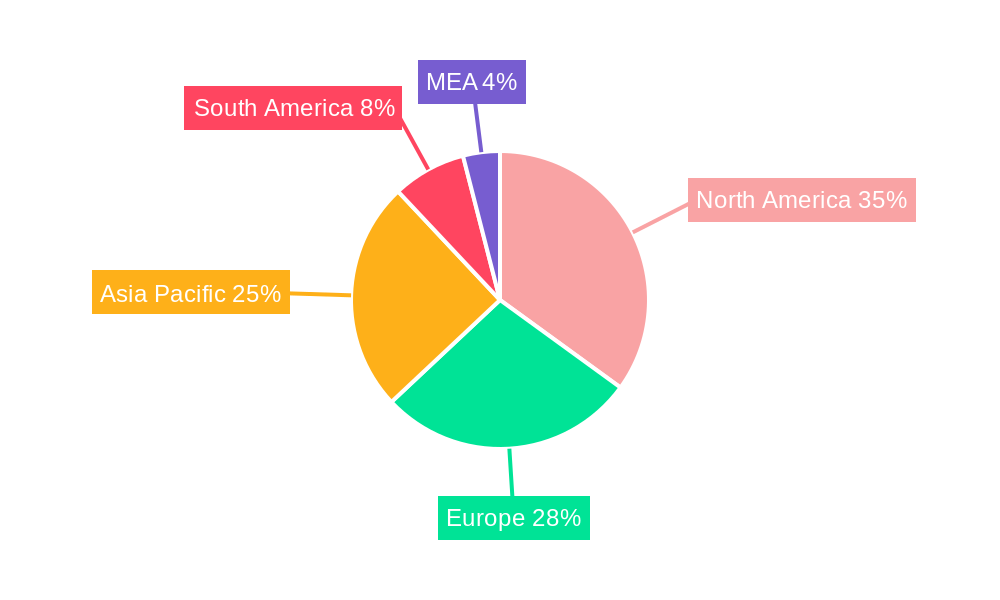
The Quillaia extract market, valued at $887.90 million in 2025, is projected to experience robust growth, driven by increasing demand across diverse applications. The compound annual growth rate (CAGR) of 6.88% from 2025 to 2033 signifies a significant expansion opportunity. Key drivers include the growing popularity of natural and plant-based ingredients in food and beverage products, particularly in health-conscious consumer segments. The pharmaceutical and personal care sectors are also significant contributors, leveraging quillaia extract's unique properties as a surfactant and foaming agent. Market segmentation reveals a strong presence of liquid and powder forms, with food and beverage applications leading the way. However, the market faces certain restraints, potentially including the fluctuating availability of raw materials and the possibility of price volatility linked to supply chain dynamics. Nevertheless, ongoing research and development focused on enhancing extraction methods and exploring new applications are anticipated to mitigate these challenges. The market is geographically diverse, with North America, Europe, and Asia Pacific expected to be prominent regions for consumption, fueled by factors like increasing disposable income, rising health awareness, and favorable regulatory environments in these regions. Companies like Shaanxi Pioneer Biotech Co Ltd, Givaudan SA, and Ingredion Incorporated play crucial roles in shaping market dynamics through their innovation and supply capabilities.
The forecast period of 2025-2033 offers substantial growth potential, particularly within the Asia-Pacific region, fueled by its rapidly growing population and increasing demand for natural ingredients in various industries. The consistent CAGR underscores the market's sustained growth trajectory, making it an attractive area for investment and innovation. Further growth is also expected through strategic partnerships and mergers and acquisitions among major market players aiming to expand their product portfolio and gain market share. The future of the quillaia extract market hinges upon maintaining sustainable sourcing practices, continuous innovation in extraction technologies, and adapting to evolving consumer preferences for natural and efficacious products.
Quillaia Extract Market: A Comprehensive Report (2019-2033)
This comprehensive report provides a detailed analysis of the Quillaia Extract market, encompassing market dynamics, growth trends, regional segmentation, product landscape, key players, and future outlook. Focusing on both the parent market (natural extracts) and the child market (food and beverage ingredients, pharmaceuticals, cosmetics), this study offers invaluable insights for industry professionals, investors, and researchers. The report covers the period 2019-2033, with 2025 as the base year and a forecast period of 2025-2033. The market size is presented in million units.
Quillaia Extract Market Dynamics & Structure
The Quillaia Extract market is characterized by a moderately fragmented structure with several key players competing based on product quality, price, and geographic reach. Market concentration is relatively low, with no single dominant player holding a significant majority share. Technological innovation, particularly in extraction methods and formulation, is a crucial driver, while regulatory frameworks concerning food safety and cosmetic standards significantly influence market growth. Competitive substitutes, such as other saponins, pose a challenge, requiring continuous product differentiation and innovation. End-user demographics are diverse, spanning the food & beverage, pharmaceutical, and personal care industries, creating a multifaceted market landscape. M&A activity is moderate, with recent examples highlighting strategic expansion and market consolidation.
- Market Concentration: Moderately fragmented, with the top 5 players holding an estimated xx% market share in 2025.
- Technological Innovation: Focus on sustainable extraction methods and novel applications drives market growth.
- Regulatory Frameworks: Compliance with food safety and cosmetic regulations is crucial, influencing product development and market access.
- Competitive Substitutes: Other natural saponins and synthetic alternatives exert competitive pressure.
- M&A Activity: Moderate level of mergers and acquisitions, indicating strategic consolidation and expansion. For instance, the acquisition of Desert King by Ingredion Incorporated in 2023 demonstrates this trend. The total volume of M&A deals between 2019 and 2024 is estimated at xx deals.
Quillaia Extract Market Growth Trends & Insights
The Quillaia Extract market exhibits a steady growth trajectory, driven by increasing demand across various applications. The market size is projected to reach xx million units by 2025, exhibiting a CAGR of xx% during the historical period (2019-2024). This growth is propelled by rising consumer awareness of natural ingredients and their health benefits, particularly in the food, beverage, and personal care sectors. Technological advancements in extraction and purification processes further enhance product quality and efficacy, contributing to market expansion. Furthermore, the growing demand for natural and sustainable ingredients in various industries is fueling market expansion. Shifting consumer preferences towards natural and organic products are pushing the adoption rates higher in various segments.
- Market Size (2025): xx million units
- CAGR (2019-2024): xx%
- CAGR (2025-2033): xx%
- Market Penetration: xx% in key segments by 2033.
Dominant Regions, Countries, or Segments in Quillaia Extract Market
North America and Europe currently dominate the Quillaia Extract market, driven by high consumer demand for natural ingredients and established regulatory frameworks. However, the Asia-Pacific region is expected to witness significant growth in the coming years due to rising disposable incomes and increasing awareness of health and wellness. Within segments, the Powder form holds a larger market share compared to Liquid, due to its ease of handling and longer shelf life. In terms of application, the Food & Beverage segment currently leads, followed by the Pharmaceutical and Personal Care segments.
- Leading Region: North America and Europe (combined xx% market share in 2025).
- Fastest Growing Region: Asia-Pacific (projected xx% CAGR 2025-2033).
- Dominant Form: Powder (xx% market share in 2025).
- Dominant Application: Food & Beverage (xx% market share in 2025).
- Key Drivers: Strong consumer demand for natural ingredients, regulatory support, and increasing investments in R&D.
Quillaia Extract Market Product Landscape
Quillaia Extract products are available in various forms, including powder and liquid, catering to diverse applications. Innovations focus on improving extraction methods to enhance purity and efficacy, while novel formulations target specific applications. Unique selling propositions emphasize natural origin, high purity, and functional benefits, aligning with consumer preference for sustainable and health-conscious products. Technological advancements include the development of standardized extracts with consistent quality and enhanced bioavailability.
Key Drivers, Barriers & Challenges in Quillaia Extract Market
Key Drivers: Growing demand for natural ingredients in food & beverage, pharmaceuticals, and cosmetics; increasing consumer awareness of health benefits; and technological advancements in extraction and purification.
Challenges: Fluctuations in raw material prices and supply chain disruptions; regulatory hurdles in certain markets; and competition from synthetic alternatives. Supply chain disruptions have resulted in estimated xx% price volatility in the past 2 years.
Emerging Opportunities in Quillaia Extract Market
Untapped markets in developing economies, particularly in Asia-Pacific and Latin America, present significant growth opportunities. Innovation in applications, including nutraceuticals and specialized cosmetic formulations, offers potential for market expansion. Evolving consumer preferences towards clean label products and sustainable sourcing create further avenues for growth.
Growth Accelerators in the Quillaia Extract Market Industry
Technological breakthroughs in extraction and purification methods, leading to higher quality and standardized extracts, act as key growth drivers. Strategic partnerships, such as that between Shaanxi Pioneer Biotech and Plantae Labs, foster innovation and market penetration. Expansion of cultivation areas, as demonstrated by QUILLAJA GREEN BIOSOLUTIONS in Chile and Peru, enhances raw material availability and supports market growth.
Key Players Shaping the Quillaia Extract Market Market
- Shaanxi Pioneer Biotech Co Ltd
- Garuda International Inc
- Plantae Labs (for feed and agriculture)
- Givaudan SA
- QUILLAJA GREEN BIOSOLUTIONS
- Desert King
- Ingredion Incorporated
- Baja Yucca Company
- Brenntag AG
- StanChem, Inc.
Notable Milestones in Quillaia Extract Market Sector
- 2023: Acquisition of Desert King by Ingredion Incorporated.
- 2023: Partnership between Shaanxi Pioneer Biotech and Plantae Labs for joint R&D.
- 2023: Expansion of cultivation areas in Chile and Peru by QUILLAJA GREEN BIOSOLUTIONS.
In-Depth Quillaia Extract Market Market Outlook
The Quillaia Extract market is poised for continued growth, driven by factors such as increasing demand for natural ingredients, technological advancements, and strategic collaborations. The expansion into new geographic markets and the development of novel applications will contribute to future market potential. Strategic opportunities exist in developing sustainable sourcing practices and creating innovative formulations targeting specific health and wellness needs. The market is predicted to reach xx million units by 2033.
Quillaia Extract Market Segmentation
-
1. Form
- 1.1. Liquid
- 1.2. Powder
-
2. Application
-
2.1. Food
- 2.1.1. Bakery
- 2.1.2. Confectionary
- 2.1.3. Dairy
- 2.1.4. Others
-
2.2. Beverage
- 2.2.1. Alcholic
- 2.2.2. Non-Alcholic
- 2.3. Pharamceutical
- 2.4. Personal Care and Cosmetics
-
2.1. Food
Quillaia Extract Market Segmentation By Geography
-
1. North America
- 1.1. United States
- 1.2. Canada
- 1.3. Mexico
- 1.4. Rest of North America
-
2. Europe
- 2.1. Germany
- 2.2. United Kingdom
- 2.3. France
- 2.4. Italy
- 2.5. Russia
- 2.6. Spain
- 2.7. Rest of Europe
-
3. Asia Pacific
- 3.1. China
- 3.2. Japan
- 3.3. India
- 3.4. Australia
- 3.5. Rest of Asia Pacific
-
4. Rest of the World
- 4.1. South America
- 4.2. Middle East and Africa
Quillaia Extract Market REPORT HIGHLIGHTS
| Aspects | Details |
|---|---|
| Study Period | 2019-2033 |
| Base Year | 2024 |
| Estimated Year | 2025 |
| Forecast Period | 2025-2033 |
| Historical Period | 2019-2024 |
| Growth Rate | CAGR of 6.88% from 2019-2033 |
| Segmentation |
|
Table of Contents
- 1. Introduction
- 1.1. Research Scope
- 1.2. Market Segmentation
- 1.3. Research Methodology
- 1.4. Definitions and Assumptions
- 2. Executive Summary
- 2.1. Introduction
- 3. Market Dynamics
- 3.1. Introduction
- 3.2. Market Drivers
- 3.2.1. Increasing application of Gelatin in healthcare and pharmaceutical sector
- 3.3. Market Restrains
- 3.3.1. Rising demand for clean label products
- 3.4. Market Trends
- 3.4.1. Role of Specialty Food Ingredients in Processed Food Industry
- 4. Market Factor Analysis
- 4.1. Porters Five Forces
- 4.2. Supply/Value Chain
- 4.3. PESTEL analysis
- 4.4. Market Entropy
- 4.5. Patent/Trademark Analysis
- 5. Global Quillaia Extract Market Analysis, Insights and Forecast, 2019-2031
- 5.1. Market Analysis, Insights and Forecast - by Form
- 5.1.1. Liquid
- 5.1.2. Powder
- 5.2. Market Analysis, Insights and Forecast - by Application
- 5.2.1. Food
- 5.2.1.1. Bakery
- 5.2.1.2. Confectionary
- 5.2.1.3. Dairy
- 5.2.1.4. Others
- 5.2.2. Beverage
- 5.2.2.1. Alcholic
- 5.2.2.2. Non-Alcholic
- 5.2.3. Pharamceutical
- 5.2.4. Personal Care and Cosmetics
- 5.2.1. Food
- 5.3. Market Analysis, Insights and Forecast - by Region
- 5.3.1. North America
- 5.3.2. Europe
- 5.3.3. Asia Pacific
- 5.3.4. Rest of the World
- 5.1. Market Analysis, Insights and Forecast - by Form
- 6. North America Quillaia Extract Market Analysis, Insights and Forecast, 2019-2031
- 6.1. Market Analysis, Insights and Forecast - by Form
- 6.1.1. Liquid
- 6.1.2. Powder
- 6.2. Market Analysis, Insights and Forecast - by Application
- 6.2.1. Food
- 6.2.1.1. Bakery
- 6.2.1.2. Confectionary
- 6.2.1.3. Dairy
- 6.2.1.4. Others
- 6.2.2. Beverage
- 6.2.2.1. Alcholic
- 6.2.2.2. Non-Alcholic
- 6.2.3. Pharamceutical
- 6.2.4. Personal Care and Cosmetics
- 6.2.1. Food
- 6.1. Market Analysis, Insights and Forecast - by Form
- 7. Europe Quillaia Extract Market Analysis, Insights and Forecast, 2019-2031
- 7.1. Market Analysis, Insights and Forecast - by Form
- 7.1.1. Liquid
- 7.1.2. Powder
- 7.2. Market Analysis, Insights and Forecast - by Application
- 7.2.1. Food
- 7.2.1.1. Bakery
- 7.2.1.2. Confectionary
- 7.2.1.3. Dairy
- 7.2.1.4. Others
- 7.2.2. Beverage
- 7.2.2.1. Alcholic
- 7.2.2.2. Non-Alcholic
- 7.2.3. Pharamceutical
- 7.2.4. Personal Care and Cosmetics
- 7.2.1. Food
- 7.1. Market Analysis, Insights and Forecast - by Form
- 8. Asia Pacific Quillaia Extract Market Analysis, Insights and Forecast, 2019-2031
- 8.1. Market Analysis, Insights and Forecast - by Form
- 8.1.1. Liquid
- 8.1.2. Powder
- 8.2. Market Analysis, Insights and Forecast - by Application
- 8.2.1. Food
- 8.2.1.1. Bakery
- 8.2.1.2. Confectionary
- 8.2.1.3. Dairy
- 8.2.1.4. Others
- 8.2.2. Beverage
- 8.2.2.1. Alcholic
- 8.2.2.2. Non-Alcholic
- 8.2.3. Pharamceutical
- 8.2.4. Personal Care and Cosmetics
- 8.2.1. Food
- 8.1. Market Analysis, Insights and Forecast - by Form
- 9. Rest of the World Quillaia Extract Market Analysis, Insights and Forecast, 2019-2031
- 9.1. Market Analysis, Insights and Forecast - by Form
- 9.1.1. Liquid
- 9.1.2. Powder
- 9.2. Market Analysis, Insights and Forecast - by Application
- 9.2.1. Food
- 9.2.1.1. Bakery
- 9.2.1.2. Confectionary
- 9.2.1.3. Dairy
- 9.2.1.4. Others
- 9.2.2. Beverage
- 9.2.2.1. Alcholic
- 9.2.2.2. Non-Alcholic
- 9.2.3. Pharamceutical
- 9.2.4. Personal Care and Cosmetics
- 9.2.1. Food
- 9.1. Market Analysis, Insights and Forecast - by Form
- 10. North America Quillaia Extract Market Analysis, Insights and Forecast, 2019-2031
- 10.1. Market Analysis, Insights and Forecast - By Country/Sub-region
- 10.1.1 United States
- 10.1.2 Canada
- 10.1.3 Mexico
- 11. Europe Quillaia Extract Market Analysis, Insights and Forecast, 2019-2031
- 11.1. Market Analysis, Insights and Forecast - By Country/Sub-region
- 11.1.1 Germany
- 11.1.2 United Kingdom
- 11.1.3 France
- 11.1.4 Spain
- 11.1.5 Italy
- 11.1.6 Spain
- 11.1.7 Belgium
- 11.1.8 Netherland
- 11.1.9 Nordics
- 11.1.10 Rest of Europe
- 12. Asia Pacific Quillaia Extract Market Analysis, Insights and Forecast, 2019-2031
- 12.1. Market Analysis, Insights and Forecast - By Country/Sub-region
- 12.1.1 China
- 12.1.2 Japan
- 12.1.3 India
- 12.1.4 South Korea
- 12.1.5 Southeast Asia
- 12.1.6 Australia
- 12.1.7 Indonesia
- 12.1.8 Phillipes
- 12.1.9 Singapore
- 12.1.10 Thailandc
- 12.1.11 Rest of Asia Pacific
- 13. South America Quillaia Extract Market Analysis, Insights and Forecast, 2019-2031
- 13.1. Market Analysis, Insights and Forecast - By Country/Sub-region
- 13.1.1 Brazil
- 13.1.2 Argentina
- 13.1.3 Peru
- 13.1.4 Chile
- 13.1.5 Colombia
- 13.1.6 Ecuador
- 13.1.7 Venezuela
- 13.1.8 Rest of South America
- 14. North America Quillaia Extract Market Analysis, Insights and Forecast, 2019-2031
- 14.1. Market Analysis, Insights and Forecast - By Country/Sub-region
- 14.1.1 United States
- 14.1.2 Canada
- 14.1.3 Mexico
- 15. MEA Quillaia Extract Market Analysis, Insights and Forecast, 2019-2031
- 15.1. Market Analysis, Insights and Forecast - By Country/Sub-region
- 15.1.1 United Arab Emirates
- 15.1.2 Saudi Arabia
- 15.1.3 South Africa
- 15.1.4 Rest of Middle East and Africa
- 16. Competitive Analysis
- 16.1. Global Market Share Analysis 2024
- 16.2. Company Profiles
- 16.2.1 Shaanxi Pioneer Biotech Co Ltd
- 16.2.1.1. Overview
- 16.2.1.2. Products
- 16.2.1.3. SWOT Analysis
- 16.2.1.4. Recent Developments
- 16.2.1.5. Financials (Based on Availability)
- 16.2.2 Garuda International Inc
- 16.2.2.1. Overview
- 16.2.2.2. Products
- 16.2.2.3. SWOT Analysis
- 16.2.2.4. Recent Developments
- 16.2.2.5. Financials (Based on Availability)
- 16.2.3 Plantae Labs (for feed and agriculture)*List Not Exhaustive
- 16.2.3.1. Overview
- 16.2.3.2. Products
- 16.2.3.3. SWOT Analysis
- 16.2.3.4. Recent Developments
- 16.2.3.5. Financials (Based on Availability)
- 16.2.4 Givaudan SA
- 16.2.4.1. Overview
- 16.2.4.2. Products
- 16.2.4.3. SWOT Analysis
- 16.2.4.4. Recent Developments
- 16.2.4.5. Financials (Based on Availability)
- 16.2.5 QUILLAJA GREEN BIOSOLUTIONS
- 16.2.5.1. Overview
- 16.2.5.2. Products
- 16.2.5.3. SWOT Analysis
- 16.2.5.4. Recent Developments
- 16.2.5.5. Financials (Based on Availability)
- 16.2.6 Desert King
- 16.2.6.1. Overview
- 16.2.6.2. Products
- 16.2.6.3. SWOT Analysis
- 16.2.6.4. Recent Developments
- 16.2.6.5. Financials (Based on Availability)
- 16.2.7 Ingredion Incorporated
- 16.2.7.1. Overview
- 16.2.7.2. Products
- 16.2.7.3. SWOT Analysis
- 16.2.7.4. Recent Developments
- 16.2.7.5. Financials (Based on Availability)
- 16.2.8 Baja Yucca Company
- 16.2.8.1. Overview
- 16.2.8.2. Products
- 16.2.8.3. SWOT Analysis
- 16.2.8.4. Recent Developments
- 16.2.8.5. Financials (Based on Availability)
- 16.2.9 Brenntag AG
- 16.2.9.1. Overview
- 16.2.9.2. Products
- 16.2.9.3. SWOT Analysis
- 16.2.9.4. Recent Developments
- 16.2.9.5. Financials (Based on Availability)
- 16.2.10 StanChem Inc.
- 16.2.10.1. Overview
- 16.2.10.2. Products
- 16.2.10.3. SWOT Analysis
- 16.2.10.4. Recent Developments
- 16.2.10.5. Financials (Based on Availability)
- 16.2.1 Shaanxi Pioneer Biotech Co Ltd
List of Figures
- Figure 1: Global Quillaia Extract Market Revenue Breakdown (Million, %) by Region 2024 & 2032
- Figure 2: Global Quillaia Extract Market Volume Breakdown (K Tons, %) by Region 2024 & 2032
- Figure 3: North America Quillaia Extract Market Revenue (Million), by Country 2024 & 2032
- Figure 4: North America Quillaia Extract Market Volume (K Tons), by Country 2024 & 2032
- Figure 5: North America Quillaia Extract Market Revenue Share (%), by Country 2024 & 2032
- Figure 6: North America Quillaia Extract Market Volume Share (%), by Country 2024 & 2032
- Figure 7: Europe Quillaia Extract Market Revenue (Million), by Country 2024 & 2032
- Figure 8: Europe Quillaia Extract Market Volume (K Tons), by Country 2024 & 2032
- Figure 9: Europe Quillaia Extract Market Revenue Share (%), by Country 2024 & 2032
- Figure 10: Europe Quillaia Extract Market Volume Share (%), by Country 2024 & 2032
- Figure 11: Asia Pacific Quillaia Extract Market Revenue (Million), by Country 2024 & 2032
- Figure 12: Asia Pacific Quillaia Extract Market Volume (K Tons), by Country 2024 & 2032
- Figure 13: Asia Pacific Quillaia Extract Market Revenue Share (%), by Country 2024 & 2032
- Figure 14: Asia Pacific Quillaia Extract Market Volume Share (%), by Country 2024 & 2032
- Figure 15: South America Quillaia Extract Market Revenue (Million), by Country 2024 & 2032
- Figure 16: South America Quillaia Extract Market Volume (K Tons), by Country 2024 & 2032
- Figure 17: South America Quillaia Extract Market Revenue Share (%), by Country 2024 & 2032
- Figure 18: South America Quillaia Extract Market Volume Share (%), by Country 2024 & 2032
- Figure 19: North America Quillaia Extract Market Revenue (Million), by Country 2024 & 2032
- Figure 20: North America Quillaia Extract Market Volume (K Tons), by Country 2024 & 2032
- Figure 21: North America Quillaia Extract Market Revenue Share (%), by Country 2024 & 2032
- Figure 22: North America Quillaia Extract Market Volume Share (%), by Country 2024 & 2032
- Figure 23: MEA Quillaia Extract Market Revenue (Million), by Country 2024 & 2032
- Figure 24: MEA Quillaia Extract Market Volume (K Tons), by Country 2024 & 2032
- Figure 25: MEA Quillaia Extract Market Revenue Share (%), by Country 2024 & 2032
- Figure 26: MEA Quillaia Extract Market Volume Share (%), by Country 2024 & 2032
- Figure 27: North America Quillaia Extract Market Revenue (Million), by Form 2024 & 2032
- Figure 28: North America Quillaia Extract Market Volume (K Tons), by Form 2024 & 2032
- Figure 29: North America Quillaia Extract Market Revenue Share (%), by Form 2024 & 2032
- Figure 30: North America Quillaia Extract Market Volume Share (%), by Form 2024 & 2032
- Figure 31: North America Quillaia Extract Market Revenue (Million), by Application 2024 & 2032
- Figure 32: North America Quillaia Extract Market Volume (K Tons), by Application 2024 & 2032
- Figure 33: North America Quillaia Extract Market Revenue Share (%), by Application 2024 & 2032
- Figure 34: North America Quillaia Extract Market Volume Share (%), by Application 2024 & 2032
- Figure 35: North America Quillaia Extract Market Revenue (Million), by Country 2024 & 2032
- Figure 36: North America Quillaia Extract Market Volume (K Tons), by Country 2024 & 2032
- Figure 37: North America Quillaia Extract Market Revenue Share (%), by Country 2024 & 2032
- Figure 38: North America Quillaia Extract Market Volume Share (%), by Country 2024 & 2032
- Figure 39: Europe Quillaia Extract Market Revenue (Million), by Form 2024 & 2032
- Figure 40: Europe Quillaia Extract Market Volume (K Tons), by Form 2024 & 2032
- Figure 41: Europe Quillaia Extract Market Revenue Share (%), by Form 2024 & 2032
- Figure 42: Europe Quillaia Extract Market Volume Share (%), by Form 2024 & 2032
- Figure 43: Europe Quillaia Extract Market Revenue (Million), by Application 2024 & 2032
- Figure 44: Europe Quillaia Extract Market Volume (K Tons), by Application 2024 & 2032
- Figure 45: Europe Quillaia Extract Market Revenue Share (%), by Application 2024 & 2032
- Figure 46: Europe Quillaia Extract Market Volume Share (%), by Application 2024 & 2032
- Figure 47: Europe Quillaia Extract Market Revenue (Million), by Country 2024 & 2032
- Figure 48: Europe Quillaia Extract Market Volume (K Tons), by Country 2024 & 2032
- Figure 49: Europe Quillaia Extract Market Revenue Share (%), by Country 2024 & 2032
- Figure 50: Europe Quillaia Extract Market Volume Share (%), by Country 2024 & 2032
- Figure 51: Asia Pacific Quillaia Extract Market Revenue (Million), by Form 2024 & 2032
- Figure 52: Asia Pacific Quillaia Extract Market Volume (K Tons), by Form 2024 & 2032
- Figure 53: Asia Pacific Quillaia Extract Market Revenue Share (%), by Form 2024 & 2032
- Figure 54: Asia Pacific Quillaia Extract Market Volume Share (%), by Form 2024 & 2032
- Figure 55: Asia Pacific Quillaia Extract Market Revenue (Million), by Application 2024 & 2032
- Figure 56: Asia Pacific Quillaia Extract Market Volume (K Tons), by Application 2024 & 2032
- Figure 57: Asia Pacific Quillaia Extract Market Revenue Share (%), by Application 2024 & 2032
- Figure 58: Asia Pacific Quillaia Extract Market Volume Share (%), by Application 2024 & 2032
- Figure 59: Asia Pacific Quillaia Extract Market Revenue (Million), by Country 2024 & 2032
- Figure 60: Asia Pacific Quillaia Extract Market Volume (K Tons), by Country 2024 & 2032
- Figure 61: Asia Pacific Quillaia Extract Market Revenue Share (%), by Country 2024 & 2032
- Figure 62: Asia Pacific Quillaia Extract Market Volume Share (%), by Country 2024 & 2032
- Figure 63: Rest of the World Quillaia Extract Market Revenue (Million), by Form 2024 & 2032
- Figure 64: Rest of the World Quillaia Extract Market Volume (K Tons), by Form 2024 & 2032
- Figure 65: Rest of the World Quillaia Extract Market Revenue Share (%), by Form 2024 & 2032
- Figure 66: Rest of the World Quillaia Extract Market Volume Share (%), by Form 2024 & 2032
- Figure 67: Rest of the World Quillaia Extract Market Revenue (Million), by Application 2024 & 2032
- Figure 68: Rest of the World Quillaia Extract Market Volume (K Tons), by Application 2024 & 2032
- Figure 69: Rest of the World Quillaia Extract Market Revenue Share (%), by Application 2024 & 2032
- Figure 70: Rest of the World Quillaia Extract Market Volume Share (%), by Application 2024 & 2032
- Figure 71: Rest of the World Quillaia Extract Market Revenue (Million), by Country 2024 & 2032
- Figure 72: Rest of the World Quillaia Extract Market Volume (K Tons), by Country 2024 & 2032
- Figure 73: Rest of the World Quillaia Extract Market Revenue Share (%), by Country 2024 & 2032
- Figure 74: Rest of the World Quillaia Extract Market Volume Share (%), by Country 2024 & 2032
List of Tables
- Table 1: Global Quillaia Extract Market Revenue Million Forecast, by Region 2019 & 2032
- Table 2: Global Quillaia Extract Market Volume K Tons Forecast, by Region 2019 & 2032
- Table 3: Global Quillaia Extract Market Revenue Million Forecast, by Form 2019 & 2032
- Table 4: Global Quillaia Extract Market Volume K Tons Forecast, by Form 2019 & 2032
- Table 5: Global Quillaia Extract Market Revenue Million Forecast, by Application 2019 & 2032
- Table 6: Global Quillaia Extract Market Volume K Tons Forecast, by Application 2019 & 2032
- Table 7: Global Quillaia Extract Market Revenue Million Forecast, by Region 2019 & 2032
- Table 8: Global Quillaia Extract Market Volume K Tons Forecast, by Region 2019 & 2032
- Table 9: Global Quillaia Extract Market Revenue Million Forecast, by Country 2019 & 2032
- Table 10: Global Quillaia Extract Market Volume K Tons Forecast, by Country 2019 & 2032
- Table 11: United States Quillaia Extract Market Revenue (Million) Forecast, by Application 2019 & 2032
- Table 12: United States Quillaia Extract Market Volume (K Tons) Forecast, by Application 2019 & 2032
- Table 13: Canada Quillaia Extract Market Revenue (Million) Forecast, by Application 2019 & 2032
- Table 14: Canada Quillaia Extract Market Volume (K Tons) Forecast, by Application 2019 & 2032
- Table 15: Mexico Quillaia Extract Market Revenue (Million) Forecast, by Application 2019 & 2032
- Table 16: Mexico Quillaia Extract Market Volume (K Tons) Forecast, by Application 2019 & 2032
- Table 17: Global Quillaia Extract Market Revenue Million Forecast, by Country 2019 & 2032
- Table 18: Global Quillaia Extract Market Volume K Tons Forecast, by Country 2019 & 2032
- Table 19: Germany Quillaia Extract Market Revenue (Million) Forecast, by Application 2019 & 2032
- Table 20: Germany Quillaia Extract Market Volume (K Tons) Forecast, by Application 2019 & 2032
- Table 21: United Kingdom Quillaia Extract Market Revenue (Million) Forecast, by Application 2019 & 2032
- Table 22: United Kingdom Quillaia Extract Market Volume (K Tons) Forecast, by Application 2019 & 2032
- Table 23: France Quillaia Extract Market Revenue (Million) Forecast, by Application 2019 & 2032
- Table 24: France Quillaia Extract Market Volume (K Tons) Forecast, by Application 2019 & 2032
- Table 25: Spain Quillaia Extract Market Revenue (Million) Forecast, by Application 2019 & 2032
- Table 26: Spain Quillaia Extract Market Volume (K Tons) Forecast, by Application 2019 & 2032
- Table 27: Italy Quillaia Extract Market Revenue (Million) Forecast, by Application 2019 & 2032
- Table 28: Italy Quillaia Extract Market Volume (K Tons) Forecast, by Application 2019 & 2032
- Table 29: Spain Quillaia Extract Market Revenue (Million) Forecast, by Application 2019 & 2032
- Table 30: Spain Quillaia Extract Market Volume (K Tons) Forecast, by Application 2019 & 2032
- Table 31: Belgium Quillaia Extract Market Revenue (Million) Forecast, by Application 2019 & 2032
- Table 32: Belgium Quillaia Extract Market Volume (K Tons) Forecast, by Application 2019 & 2032
- Table 33: Netherland Quillaia Extract Market Revenue (Million) Forecast, by Application 2019 & 2032
- Table 34: Netherland Quillaia Extract Market Volume (K Tons) Forecast, by Application 2019 & 2032
- Table 35: Nordics Quillaia Extract Market Revenue (Million) Forecast, by Application 2019 & 2032
- Table 36: Nordics Quillaia Extract Market Volume (K Tons) Forecast, by Application 2019 & 2032
- Table 37: Rest of Europe Quillaia Extract Market Revenue (Million) Forecast, by Application 2019 & 2032
- Table 38: Rest of Europe Quillaia Extract Market Volume (K Tons) Forecast, by Application 2019 & 2032
- Table 39: Global Quillaia Extract Market Revenue Million Forecast, by Country 2019 & 2032
- Table 40: Global Quillaia Extract Market Volume K Tons Forecast, by Country 2019 & 2032
- Table 41: China Quillaia Extract Market Revenue (Million) Forecast, by Application 2019 & 2032
- Table 42: China Quillaia Extract Market Volume (K Tons) Forecast, by Application 2019 & 2032
- Table 43: Japan Quillaia Extract Market Revenue (Million) Forecast, by Application 2019 & 2032
- Table 44: Japan Quillaia Extract Market Volume (K Tons) Forecast, by Application 2019 & 2032
- Table 45: India Quillaia Extract Market Revenue (Million) Forecast, by Application 2019 & 2032
- Table 46: India Quillaia Extract Market Volume (K Tons) Forecast, by Application 2019 & 2032
- Table 47: South Korea Quillaia Extract Market Revenue (Million) Forecast, by Application 2019 & 2032
- Table 48: South Korea Quillaia Extract Market Volume (K Tons) Forecast, by Application 2019 & 2032
- Table 49: Southeast Asia Quillaia Extract Market Revenue (Million) Forecast, by Application 2019 & 2032
- Table 50: Southeast Asia Quillaia Extract Market Volume (K Tons) Forecast, by Application 2019 & 2032
- Table 51: Australia Quillaia Extract Market Revenue (Million) Forecast, by Application 2019 & 2032
- Table 52: Australia Quillaia Extract Market Volume (K Tons) Forecast, by Application 2019 & 2032
- Table 53: Indonesia Quillaia Extract Market Revenue (Million) Forecast, by Application 2019 & 2032
- Table 54: Indonesia Quillaia Extract Market Volume (K Tons) Forecast, by Application 2019 & 2032
- Table 55: Phillipes Quillaia Extract Market Revenue (Million) Forecast, by Application 2019 & 2032
- Table 56: Phillipes Quillaia Extract Market Volume (K Tons) Forecast, by Application 2019 & 2032
- Table 57: Singapore Quillaia Extract Market Revenue (Million) Forecast, by Application 2019 & 2032
- Table 58: Singapore Quillaia Extract Market Volume (K Tons) Forecast, by Application 2019 & 2032
- Table 59: Thailandc Quillaia Extract Market Revenue (Million) Forecast, by Application 2019 & 2032
- Table 60: Thailandc Quillaia Extract Market Volume (K Tons) Forecast, by Application 2019 & 2032
- Table 61: Rest of Asia Pacific Quillaia Extract Market Revenue (Million) Forecast, by Application 2019 & 2032
- Table 62: Rest of Asia Pacific Quillaia Extract Market Volume (K Tons) Forecast, by Application 2019 & 2032
- Table 63: Global Quillaia Extract Market Revenue Million Forecast, by Country 2019 & 2032
- Table 64: Global Quillaia Extract Market Volume K Tons Forecast, by Country 2019 & 2032
- Table 65: Brazil Quillaia Extract Market Revenue (Million) Forecast, by Application 2019 & 2032
- Table 66: Brazil Quillaia Extract Market Volume (K Tons) Forecast, by Application 2019 & 2032
- Table 67: Argentina Quillaia Extract Market Revenue (Million) Forecast, by Application 2019 & 2032
- Table 68: Argentina Quillaia Extract Market Volume (K Tons) Forecast, by Application 2019 & 2032
- Table 69: Peru Quillaia Extract Market Revenue (Million) Forecast, by Application 2019 & 2032
- Table 70: Peru Quillaia Extract Market Volume (K Tons) Forecast, by Application 2019 & 2032
- Table 71: Chile Quillaia Extract Market Revenue (Million) Forecast, by Application 2019 & 2032
- Table 72: Chile Quillaia Extract Market Volume (K Tons) Forecast, by Application 2019 & 2032
- Table 73: Colombia Quillaia Extract Market Revenue (Million) Forecast, by Application 2019 & 2032
- Table 74: Colombia Quillaia Extract Market Volume (K Tons) Forecast, by Application 2019 & 2032
- Table 75: Ecuador Quillaia Extract Market Revenue (Million) Forecast, by Application 2019 & 2032
- Table 76: Ecuador Quillaia Extract Market Volume (K Tons) Forecast, by Application 2019 & 2032
- Table 77: Venezuela Quillaia Extract Market Revenue (Million) Forecast, by Application 2019 & 2032
- Table 78: Venezuela Quillaia Extract Market Volume (K Tons) Forecast, by Application 2019 & 2032
- Table 79: Rest of South America Quillaia Extract Market Revenue (Million) Forecast, by Application 2019 & 2032
- Table 80: Rest of South America Quillaia Extract Market Volume (K Tons) Forecast, by Application 2019 & 2032
- Table 81: Global Quillaia Extract Market Revenue Million Forecast, by Country 2019 & 2032
- Table 82: Global Quillaia Extract Market Volume K Tons Forecast, by Country 2019 & 2032
- Table 83: United States Quillaia Extract Market Revenue (Million) Forecast, by Application 2019 & 2032
- Table 84: United States Quillaia Extract Market Volume (K Tons) Forecast, by Application 2019 & 2032
- Table 85: Canada Quillaia Extract Market Revenue (Million) Forecast, by Application 2019 & 2032
- Table 86: Canada Quillaia Extract Market Volume (K Tons) Forecast, by Application 2019 & 2032
- Table 87: Mexico Quillaia Extract Market Revenue (Million) Forecast, by Application 2019 & 2032
- Table 88: Mexico Quillaia Extract Market Volume (K Tons) Forecast, by Application 2019 & 2032
- Table 89: Global Quillaia Extract Market Revenue Million Forecast, by Country 2019 & 2032
- Table 90: Global Quillaia Extract Market Volume K Tons Forecast, by Country 2019 & 2032
- Table 91: United Arab Emirates Quillaia Extract Market Revenue (Million) Forecast, by Application 2019 & 2032
- Table 92: United Arab Emirates Quillaia Extract Market Volume (K Tons) Forecast, by Application 2019 & 2032
- Table 93: Saudi Arabia Quillaia Extract Market Revenue (Million) Forecast, by Application 2019 & 2032
- Table 94: Saudi Arabia Quillaia Extract Market Volume (K Tons) Forecast, by Application 2019 & 2032
- Table 95: South Africa Quillaia Extract Market Revenue (Million) Forecast, by Application 2019 & 2032
- Table 96: South Africa Quillaia Extract Market Volume (K Tons) Forecast, by Application 2019 & 2032
- Table 97: Rest of Middle East and Africa Quillaia Extract Market Revenue (Million) Forecast, by Application 2019 & 2032
- Table 98: Rest of Middle East and Africa Quillaia Extract Market Volume (K Tons) Forecast, by Application 2019 & 2032
- Table 99: Global Quillaia Extract Market Revenue Million Forecast, by Form 2019 & 2032
- Table 100: Global Quillaia Extract Market Volume K Tons Forecast, by Form 2019 & 2032
- Table 101: Global Quillaia Extract Market Revenue Million Forecast, by Application 2019 & 2032
- Table 102: Global Quillaia Extract Market Volume K Tons Forecast, by Application 2019 & 2032
- Table 103: Global Quillaia Extract Market Revenue Million Forecast, by Country 2019 & 2032
- Table 104: Global Quillaia Extract Market Volume K Tons Forecast, by Country 2019 & 2032
- Table 105: United States Quillaia Extract Market Revenue (Million) Forecast, by Application 2019 & 2032
- Table 106: United States Quillaia Extract Market Volume (K Tons) Forecast, by Application 2019 & 2032
- Table 107: Canada Quillaia Extract Market Revenue (Million) Forecast, by Application 2019 & 2032
- Table 108: Canada Quillaia Extract Market Volume (K Tons) Forecast, by Application 2019 & 2032
- Table 109: Mexico Quillaia Extract Market Revenue (Million) Forecast, by Application 2019 & 2032
- Table 110: Mexico Quillaia Extract Market Volume (K Tons) Forecast, by Application 2019 & 2032
- Table 111: Rest of North America Quillaia Extract Market Revenue (Million) Forecast, by Application 2019 & 2032
- Table 112: Rest of North America Quillaia Extract Market Volume (K Tons) Forecast, by Application 2019 & 2032
- Table 113: Global Quillaia Extract Market Revenue Million Forecast, by Form 2019 & 2032
- Table 114: Global Quillaia Extract Market Volume K Tons Forecast, by Form 2019 & 2032
- Table 115: Global Quillaia Extract Market Revenue Million Forecast, by Application 2019 & 2032
- Table 116: Global Quillaia Extract Market Volume K Tons Forecast, by Application 2019 & 2032
- Table 117: Global Quillaia Extract Market Revenue Million Forecast, by Country 2019 & 2032
- Table 118: Global Quillaia Extract Market Volume K Tons Forecast, by Country 2019 & 2032
- Table 119: Germany Quillaia Extract Market Revenue (Million) Forecast, by Application 2019 & 2032
- Table 120: Germany Quillaia Extract Market Volume (K Tons) Forecast, by Application 2019 & 2032
- Table 121: United Kingdom Quillaia Extract Market Revenue (Million) Forecast, by Application 2019 & 2032
- Table 122: United Kingdom Quillaia Extract Market Volume (K Tons) Forecast, by Application 2019 & 2032
- Table 123: France Quillaia Extract Market Revenue (Million) Forecast, by Application 2019 & 2032
- Table 124: France Quillaia Extract Market Volume (K Tons) Forecast, by Application 2019 & 2032
- Table 125: Italy Quillaia Extract Market Revenue (Million) Forecast, by Application 2019 & 2032
- Table 126: Italy Quillaia Extract Market Volume (K Tons) Forecast, by Application 2019 & 2032
- Table 127: Russia Quillaia Extract Market Revenue (Million) Forecast, by Application 2019 & 2032
- Table 128: Russia Quillaia Extract Market Volume (K Tons) Forecast, by Application 2019 & 2032
- Table 129: Spain Quillaia Extract Market Revenue (Million) Forecast, by Application 2019 & 2032
- Table 130: Spain Quillaia Extract Market Volume (K Tons) Forecast, by Application 2019 & 2032
- Table 131: Rest of Europe Quillaia Extract Market Revenue (Million) Forecast, by Application 2019 & 2032
- Table 132: Rest of Europe Quillaia Extract Market Volume (K Tons) Forecast, by Application 2019 & 2032
- Table 133: Global Quillaia Extract Market Revenue Million Forecast, by Form 2019 & 2032
- Table 134: Global Quillaia Extract Market Volume K Tons Forecast, by Form 2019 & 2032
- Table 135: Global Quillaia Extract Market Revenue Million Forecast, by Application 2019 & 2032
- Table 136: Global Quillaia Extract Market Volume K Tons Forecast, by Application 2019 & 2032
- Table 137: Global Quillaia Extract Market Revenue Million Forecast, by Country 2019 & 2032
- Table 138: Global Quillaia Extract Market Volume K Tons Forecast, by Country 2019 & 2032
- Table 139: China Quillaia Extract Market Revenue (Million) Forecast, by Application 2019 & 2032
- Table 140: China Quillaia Extract Market Volume (K Tons) Forecast, by Application 2019 & 2032
- Table 141: Japan Quillaia Extract Market Revenue (Million) Forecast, by Application 2019 & 2032
- Table 142: Japan Quillaia Extract Market Volume (K Tons) Forecast, by Application 2019 & 2032
- Table 143: India Quillaia Extract Market Revenue (Million) Forecast, by Application 2019 & 2032
- Table 144: India Quillaia Extract Market Volume (K Tons) Forecast, by Application 2019 & 2032
- Table 145: Australia Quillaia Extract Market Revenue (Million) Forecast, by Application 2019 & 2032
- Table 146: Australia Quillaia Extract Market Volume (K Tons) Forecast, by Application 2019 & 2032
- Table 147: Rest of Asia Pacific Quillaia Extract Market Revenue (Million) Forecast, by Application 2019 & 2032
- Table 148: Rest of Asia Pacific Quillaia Extract Market Volume (K Tons) Forecast, by Application 2019 & 2032
- Table 149: Global Quillaia Extract Market Revenue Million Forecast, by Form 2019 & 2032
- Table 150: Global Quillaia Extract Market Volume K Tons Forecast, by Form 2019 & 2032
- Table 151: Global Quillaia Extract Market Revenue Million Forecast, by Application 2019 & 2032
- Table 152: Global Quillaia Extract Market Volume K Tons Forecast, by Application 2019 & 2032
- Table 153: Global Quillaia Extract Market Revenue Million Forecast, by Country 2019 & 2032
- Table 154: Global Quillaia Extract Market Volume K Tons Forecast, by Country 2019 & 2032
- Table 155: South America Quillaia Extract Market Revenue (Million) Forecast, by Application 2019 & 2032
- Table 156: South America Quillaia Extract Market Volume (K Tons) Forecast, by Application 2019 & 2032
- Table 157: Middle East and Africa Quillaia Extract Market Revenue (Million) Forecast, by Application 2019 & 2032
- Table 158: Middle East and Africa Quillaia Extract Market Volume (K Tons) Forecast, by Application 2019 & 2032
Frequently Asked Questions
1. What is the projected Compound Annual Growth Rate (CAGR) of the Quillaia Extract Market?
The projected CAGR is approximately 6.88%.
2. Which companies are prominent players in the Quillaia Extract Market?
Key companies in the market include Shaanxi Pioneer Biotech Co Ltd, Garuda International Inc, Plantae Labs (for feed and agriculture)*List Not Exhaustive, Givaudan SA, QUILLAJA GREEN BIOSOLUTIONS, Desert King, Ingredion Incorporated, Baja Yucca Company, Brenntag AG , StanChem, Inc..
3. What are the main segments of the Quillaia Extract Market?
The market segments include Form, Application.
4. Can you provide details about the market size?
The market size is estimated to be USD 887.90 Million as of 2022.
5. What are some drivers contributing to market growth?
Increasing application of Gelatin in healthcare and pharmaceutical sector.
6. What are the notable trends driving market growth?
Role of Specialty Food Ingredients in Processed Food Industry.
7. Are there any restraints impacting market growth?
Rising demand for clean label products.
8. Can you provide examples of recent developments in the market?
Acquisition of Desert King by Ingredion Incorporated in 2023
9. What pricing options are available for accessing the report?
Pricing options include single-user, multi-user, and enterprise licenses priced at USD 4750, USD 5250, and USD 8750 respectively.
10. Is the market size provided in terms of value or volume?
The market size is provided in terms of value, measured in Million and volume, measured in K Tons.
11. Are there any specific market keywords associated with the report?
Yes, the market keyword associated with the report is "Quillaia Extract Market," which aids in identifying and referencing the specific market segment covered.
12. How do I determine which pricing option suits my needs best?
The pricing options vary based on user requirements and access needs. Individual users may opt for single-user licenses, while businesses requiring broader access may choose multi-user or enterprise licenses for cost-effective access to the report.
13. Are there any additional resources or data provided in the Quillaia Extract Market report?
While the report offers comprehensive insights, it's advisable to review the specific contents or supplementary materials provided to ascertain if additional resources or data are available.
14. How can I stay updated on further developments or reports in the Quillaia Extract Market?
To stay informed about further developments, trends, and reports in the Quillaia Extract Market, consider subscribing to industry newsletters, following relevant companies and organizations, or regularly checking reputable industry news sources and publications.
Methodology
Step 1 - Identification of Relevant Samples Size from Population Database


Step 2 - Approaches for Defining Global Market Size (Value, Volume* & Price*)

Note*: In applicable scenarios
Step 3 - Data Sources
Primary Research
- Web Analytics
- Survey Reports
- Research Institute
- Latest Research Reports
- Opinion Leaders
Secondary Research
- Annual Reports
- White Paper
- Latest Press Release
- Industry Association
- Paid Database
- Investor Presentations

Step 4 - Data Triangulation
Involves using different sources of information in order to increase the validity of a study
These sources are likely to be stakeholders in a program - participants, other researchers, program staff, other community members, and so on.
Then we put all data in single framework & apply various statistical tools to find out the dynamic on the market.
During the analysis stage, feedback from the stakeholder groups would be compared to determine areas of agreement as well as areas of divergence


