
Key Insights
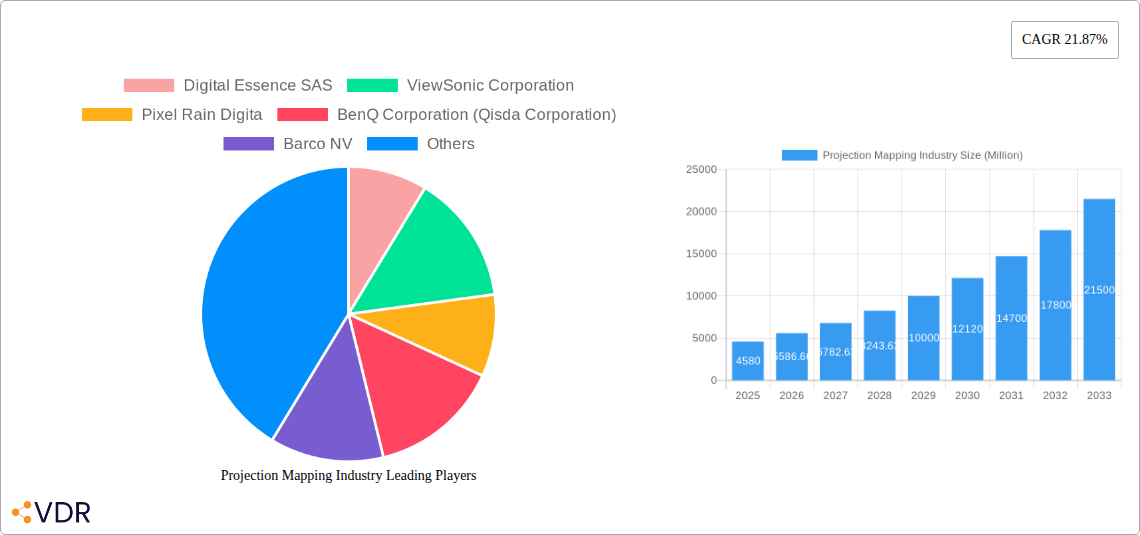
The projection mapping market, valued at $4.58 billion in 2025, is experiencing robust growth, projected to expand at a compound annual growth rate (CAGR) of 21.87% from 2025 to 2033. This surge is driven by increasing demand across diverse sectors, including entertainment (concerts, festivals, theme parks), large-venue installations (museums, architectural projections), and corporate events. Technological advancements, such as higher resolutions, improved brightness, and more compact hardware, are fueling market expansion. The rise of immersive experiences and interactive installations is further boosting adoption. The market is segmented by offering (hardware and software), dimension (2D, 3D, 4D), throw distance (standard, short), and application (large venue, event, festival, entertainment, other). While the North American market currently holds a significant share due to early adoption and technological advancements, Asia-Pacific is expected to witness substantial growth driven by increasing investments in entertainment and infrastructure. Competition is fierce, with established players like Barco, Epson, and NEC competing alongside innovative startups. Challenges include high initial investment costs for advanced systems and the need for specialized technical expertise.
The continued growth trajectory is expected to be influenced by several factors. The increasing affordability of projection mapping technology, along with the development of user-friendly software solutions, will contribute to broader adoption. Furthermore, the integration of projection mapping with other technologies, such as augmented reality (AR) and virtual reality (VR), will create new market opportunities and drive innovation. However, potential restraints include economic fluctuations impacting large-scale investments and the need for skilled professionals to design and implement these complex projects. The market's future hinges on consistent technological innovation, creative applications, and sustained demand from entertainment, advertising, and architectural sectors. The dominance of established players is likely to continue, though innovative startups focused on niche applications may carve out substantial market segments.
Projection Mapping Industry Market Report: 2019-2033
This comprehensive report provides an in-depth analysis of the Projection Mapping industry, encompassing market dynamics, growth trends, regional dominance, product landscape, key players, and future outlook. The study period covers 2019-2033, with a base year of 2025 and a forecast period of 2025-2033. The report segments the market by offering (Hardware, Software), dimension (2D, 3D, 4D), throw distance (Standard, Short), and application (Large Venue, Event, Festival, Entertainment, Other Applications). The market size is valued in millions of USD.
Projection Mapping Industry Market Dynamics & Structure
The projection mapping market exhibits a moderately consolidated structure, with several key players holding significant market share. Technological innovation, particularly in areas like 4D projection mapping and higher resolution displays, is a primary growth driver. Regulatory frameworks concerning public displays and event safety influence market dynamics, while the emergence of alternative display technologies presents competitive pressure. End-user demographics are shifting towards a greater reliance on immersive experiences, driving demand across various sectors. Mergers and acquisitions (M&A) activity has been moderate, with strategic partnerships playing a crucial role in market expansion.
- Market Concentration: Moderately consolidated; top 5 players hold approximately xx% of the market share (2024).
- Technological Innovation: Advancements in 4D projection, laser technology, and software capabilities are key drivers.
- Regulatory Framework: Safety regulations and permits for public displays impact market growth.
- Competitive Substitutes: LED displays, holographic displays, and virtual reality technologies present competition.
- End-User Demographics: Growing demand from entertainment, events, and large-venue sectors.
- M&A Trends: Moderate M&A activity; strategic alliances are more prevalent. xx M&A deals were recorded in the historical period (2019-2024).
Projection Mapping Industry Growth Trends & Insights
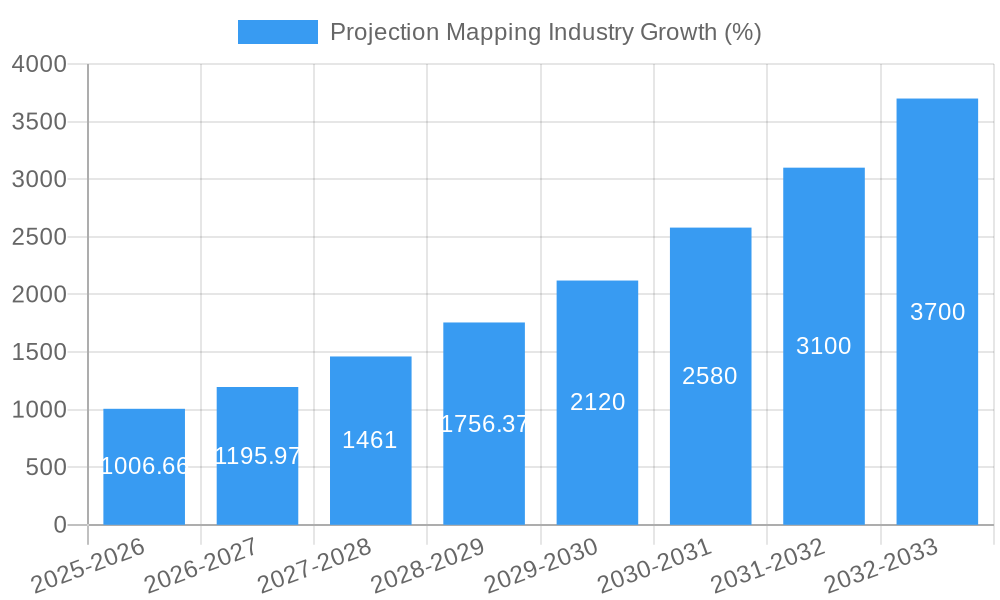
The projection mapping market is experiencing robust growth, fueled by increasing adoption across diverse applications and technological advancements. The market size reached xx million in 2024 and is projected to reach xx million by 2033, exhibiting a CAGR of xx% during the forecast period. This growth reflects the rising demand for immersive and interactive experiences in various sectors. Consumer behavior is shifting towards personalized and engaging content, further boosting the market. Technological disruptions such as the integration of AI and improved software solutions are enhancing the quality and capabilities of projection mapping systems. Market penetration has increased significantly in the entertainment and event sectors, and it is forecasted to expand to other niche markets during the forecast period.
Dominant Regions, Countries, or Segments in Projection Mapping Industry
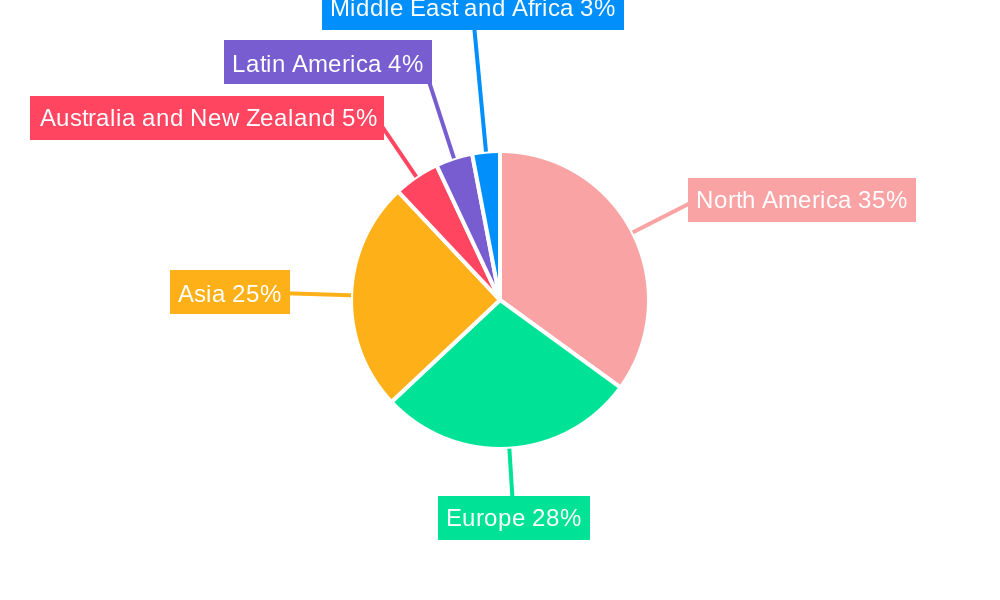
North America currently holds the largest market share in the projection mapping industry, driven by strong demand from the entertainment and events sectors. Europe and Asia-Pacific follow closely, with significant growth potential in emerging economies.
- By Offering: Hardware segment dominates the market, owing to higher initial investment in projector systems. The software segment is experiencing faster growth due to the increasing demand for sophisticated control and content creation.
- By Dimension: The 2D projection mapping market segment holds the largest market share, but the 3D and 4D segments are experiencing the fastest growth. 4D projection technology is a key area of focus due to the advanced technology capabilities such as increased realism and engaging user experiences.
- By Throw Distance: The standard throw distance segment holds the largest market share due to its versatility. The short throw distance segment shows higher growth potential due to its suitability for smaller venues and its increased popularity.
- By Application: The entertainment and event sectors dominate the market, with large venues showing significant growth potential, especially in developing regions where infrastructure development is rapidly occurring. Other applications are also showing growth potential such as museums and art galleries.
- Key Drivers: Strong economic growth in key regions, increasing investment in infrastructure for events and entertainment, and government support for the creative industries.
Projection Mapping Industry Product Landscape
The projection mapping product landscape is characterized by continuous innovation, with manufacturers focusing on improving resolution, brightness, and portability. Key advancements include the integration of 4K ultra-high-definition technology, laser-based projection systems offering higher brightness and longer lifespan, and lightweight projectors suitable for various applications. Unique selling propositions include advanced software for content creation and control, increased ease of use, and improved color accuracy.
Key Drivers, Barriers & Challenges in Projection Mapping Industry
Key Drivers: Technological advancements (higher resolution, 4D projection, improved software), rising demand for immersive experiences, increased investments in entertainment and events infrastructure.
Key Challenges: High initial investment costs, specialized skills required for installation and operation, competition from other display technologies, and supply chain disruptions which could result in longer lead times. These supply chain disruptions could result in an increase in the production cost for projection mapping equipment and its software, consequently leading to higher prices for end-users.
Emerging Opportunities in Projection Mapping Industry
Emerging opportunities lie in the integration of projection mapping with augmented reality (AR) and virtual reality (VR) technologies, creating truly immersive experiences. Untapped markets exist in education, retail, and museum applications. The development of affordable and user-friendly software solutions will further drive market growth. The rising popularity of interactive projection mapping experiences presents substantial potential.
Growth Accelerators in the Projection Mapping Industry
Strategic partnerships between hardware and software providers, expansion into new applications (e.g., retail, education), and the development of more user-friendly and affordable solutions are key growth accelerators. Technological breakthroughs, such as the development of higher resolution and brighter projectors, will further enhance the market's appeal.
Key Players Shaping the Projection Mapping Industry Market
- Digital Essence SAS
- ViewSonic Corporation
- Pixel Rain Digita
- BenQ Corporation (Qisda Corporation)
- Barco NV
- Vivitek (Delta Electronics)
- Digital Projection
- Seiko Epson Corporation
- Green Hippo Ltd
- NEC Display Solutions (SHARP corporation)
- Panasonic Corporation
Notable Milestones in Projection Mapping Industry Sector
- January 2024: Epson's latest 4K ultra-lightweight 3LCD projector range, unveiled at ISE 2023, receives substantial orders from rental partner AED Display, strengthening its position in the high-lumens segment.
- January 2024: BenQ launches its "Teach Your Way" Projector Program, targeting schools with maintenance-free LED and laser projectors and InstaShow WPS.
In-Depth Projection Mapping Industry Market Outlook
The projection mapping market is poised for sustained growth, driven by ongoing technological advancements, expanding applications, and rising demand for immersive experiences. Strategic partnerships and market expansion into new geographical regions and application areas present significant opportunities for market players. The increasing affordability and user-friendliness of projection mapping systems will contribute to wider adoption and market penetration across diverse sectors, creating a promising outlook for the industry.
Projection Mapping Industry Segmentation
-
1. Offering
- 1.1. Hardware
- 1.2. Software
-
2. Dimension
- 2.1. 2 Dimension
- 2.2. 3 Dimension
- 2.3. 4 Dimension
-
3. Throw Distance
- 3.1. Standard
- 3.2. Short
-
4. Application
- 4.1. Large Venue
- 4.2. Event
- 4.3. Festival
- 4.4. Entertainment
- 4.5. Other Applications
Projection Mapping Industry Segmentation By Geography
-
1. North America
- 1.1. United States
- 1.2. Canada
-
2. Europe
- 2.1. Germany
- 2.2. United Kingdom
- 2.3. France
-
3. Asia
- 3.1. India
- 3.2. China
- 3.3. Japan
- 4. Australia and New Zealand
-
5. Latin America
- 5.1. Brazil
- 5.2. Argentina
-
6. Middle East and Africa
- 6.1. United Arab Emirates
- 6.2. Saudi Arabia
Projection Mapping Industry REPORT HIGHLIGHTS
| Aspects | Details |
|---|---|
| Study Period | 2019-2033 |
| Base Year | 2024 |
| Estimated Year | 2025 |
| Forecast Period | 2025-2033 |
| Historical Period | 2019-2024 |
| Growth Rate | CAGR of 21.87% from 2019-2033 |
| Segmentation |
|
Table of Contents
- 1. Introduction
- 1.1. Research Scope
- 1.2. Market Segmentation
- 1.3. Research Methodology
- 1.4. Definitions and Assumptions
- 2. Executive Summary
- 2.1. Introduction
- 3. Market Dynamics
- 3.1. Introduction
- 3.2. Market Drivers
- 3.2.1 Increasing Demand for Projection Size
- 3.2.2 and High Brightness of the Projectors; Rapid Growth of Smart Cities
- 3.3. Market Restrains
- 3.3.1. Shorter Operating Range of WiGig Products
- 3.4. Market Trends
- 3.4.1. Event Segment to Witness Major Growth
- 4. Market Factor Analysis
- 4.1. Porters Five Forces
- 4.2. Supply/Value Chain
- 4.3. PESTEL analysis
- 4.4. Market Entropy
- 4.5. Patent/Trademark Analysis
- 5. Global Projection Mapping Industry Analysis, Insights and Forecast, 2019-2031
- 5.1. Market Analysis, Insights and Forecast - by Offering
- 5.1.1. Hardware
- 5.1.2. Software
- 5.2. Market Analysis, Insights and Forecast - by Dimension
- 5.2.1. 2 Dimension
- 5.2.2. 3 Dimension
- 5.2.3. 4 Dimension
- 5.3. Market Analysis, Insights and Forecast - by Throw Distance
- 5.3.1. Standard
- 5.3.2. Short
- 5.4. Market Analysis, Insights and Forecast - by Application
- 5.4.1. Large Venue
- 5.4.2. Event
- 5.4.3. Festival
- 5.4.4. Entertainment
- 5.4.5. Other Applications
- 5.5. Market Analysis, Insights and Forecast - by Region
- 5.5.1. North America
- 5.5.2. Europe
- 5.5.3. Asia
- 5.5.4. Australia and New Zealand
- 5.5.5. Latin America
- 5.5.6. Middle East and Africa
- 5.1. Market Analysis, Insights and Forecast - by Offering
- 6. North America Projection Mapping Industry Analysis, Insights and Forecast, 2019-2031
- 6.1. Market Analysis, Insights and Forecast - by Offering
- 6.1.1. Hardware
- 6.1.2. Software
- 6.2. Market Analysis, Insights and Forecast - by Dimension
- 6.2.1. 2 Dimension
- 6.2.2. 3 Dimension
- 6.2.3. 4 Dimension
- 6.3. Market Analysis, Insights and Forecast - by Throw Distance
- 6.3.1. Standard
- 6.3.2. Short
- 6.4. Market Analysis, Insights and Forecast - by Application
- 6.4.1. Large Venue
- 6.4.2. Event
- 6.4.3. Festival
- 6.4.4. Entertainment
- 6.4.5. Other Applications
- 6.1. Market Analysis, Insights and Forecast - by Offering
- 7. Europe Projection Mapping Industry Analysis, Insights and Forecast, 2019-2031
- 7.1. Market Analysis, Insights and Forecast - by Offering
- 7.1.1. Hardware
- 7.1.2. Software
- 7.2. Market Analysis, Insights and Forecast - by Dimension
- 7.2.1. 2 Dimension
- 7.2.2. 3 Dimension
- 7.2.3. 4 Dimension
- 7.3. Market Analysis, Insights and Forecast - by Throw Distance
- 7.3.1. Standard
- 7.3.2. Short
- 7.4. Market Analysis, Insights and Forecast - by Application
- 7.4.1. Large Venue
- 7.4.2. Event
- 7.4.3. Festival
- 7.4.4. Entertainment
- 7.4.5. Other Applications
- 7.1. Market Analysis, Insights and Forecast - by Offering
- 8. Asia Projection Mapping Industry Analysis, Insights and Forecast, 2019-2031
- 8.1. Market Analysis, Insights and Forecast - by Offering
- 8.1.1. Hardware
- 8.1.2. Software
- 8.2. Market Analysis, Insights and Forecast - by Dimension
- 8.2.1. 2 Dimension
- 8.2.2. 3 Dimension
- 8.2.3. 4 Dimension
- 8.3. Market Analysis, Insights and Forecast - by Throw Distance
- 8.3.1. Standard
- 8.3.2. Short
- 8.4. Market Analysis, Insights and Forecast - by Application
- 8.4.1. Large Venue
- 8.4.2. Event
- 8.4.3. Festival
- 8.4.4. Entertainment
- 8.4.5. Other Applications
- 8.1. Market Analysis, Insights and Forecast - by Offering
- 9. Australia and New Zealand Projection Mapping Industry Analysis, Insights and Forecast, 2019-2031
- 9.1. Market Analysis, Insights and Forecast - by Offering
- 9.1.1. Hardware
- 9.1.2. Software
- 9.2. Market Analysis, Insights and Forecast - by Dimension
- 9.2.1. 2 Dimension
- 9.2.2. 3 Dimension
- 9.2.3. 4 Dimension
- 9.3. Market Analysis, Insights and Forecast - by Throw Distance
- 9.3.1. Standard
- 9.3.2. Short
- 9.4. Market Analysis, Insights and Forecast - by Application
- 9.4.1. Large Venue
- 9.4.2. Event
- 9.4.3. Festival
- 9.4.4. Entertainment
- 9.4.5. Other Applications
- 9.1. Market Analysis, Insights and Forecast - by Offering
- 10. Latin America Projection Mapping Industry Analysis, Insights and Forecast, 2019-2031
- 10.1. Market Analysis, Insights and Forecast - by Offering
- 10.1.1. Hardware
- 10.1.2. Software
- 10.2. Market Analysis, Insights and Forecast - by Dimension
- 10.2.1. 2 Dimension
- 10.2.2. 3 Dimension
- 10.2.3. 4 Dimension
- 10.3. Market Analysis, Insights and Forecast - by Throw Distance
- 10.3.1. Standard
- 10.3.2. Short
- 10.4. Market Analysis, Insights and Forecast - by Application
- 10.4.1. Large Venue
- 10.4.2. Event
- 10.4.3. Festival
- 10.4.4. Entertainment
- 10.4.5. Other Applications
- 10.1. Market Analysis, Insights and Forecast - by Offering
- 11. Middle East and Africa Projection Mapping Industry Analysis, Insights and Forecast, 2019-2031
- 11.1. Market Analysis, Insights and Forecast - by Offering
- 11.1.1. Hardware
- 11.1.2. Software
- 11.2. Market Analysis, Insights and Forecast - by Dimension
- 11.2.1. 2 Dimension
- 11.2.2. 3 Dimension
- 11.2.3. 4 Dimension
- 11.3. Market Analysis, Insights and Forecast - by Throw Distance
- 11.3.1. Standard
- 11.3.2. Short
- 11.4. Market Analysis, Insights and Forecast - by Application
- 11.4.1. Large Venue
- 11.4.2. Event
- 11.4.3. Festival
- 11.4.4. Entertainment
- 11.4.5. Other Applications
- 11.1. Market Analysis, Insights and Forecast - by Offering
- 12. North America Projection Mapping Industry Analysis, Insights and Forecast, 2019-2031
- 12.1. Market Analysis, Insights and Forecast - By Country/Sub-region
- 12.1.1 United States
- 12.1.2 Canada
- 13. Europe Projection Mapping Industry Analysis, Insights and Forecast, 2019-2031
- 13.1. Market Analysis, Insights and Forecast - By Country/Sub-region
- 13.1.1 Germany
- 13.1.2 United Kingdom
- 13.1.3 France
- 14. Asia Projection Mapping Industry Analysis, Insights and Forecast, 2019-2031
- 14.1. Market Analysis, Insights and Forecast - By Country/Sub-region
- 14.1.1 India
- 14.1.2 China
- 14.1.3 Japan
- 15. Australia and New Zealand Projection Mapping Industry Analysis, Insights and Forecast, 2019-2031
- 15.1. Market Analysis, Insights and Forecast - By Country/Sub-region
- 15.1.1.
- 16. Latin America Projection Mapping Industry Analysis, Insights and Forecast, 2019-2031
- 16.1. Market Analysis, Insights and Forecast - By Country/Sub-region
- 16.1.1 Brazil
- 16.1.2 Argentina
- 17. Middle East and Africa Projection Mapping Industry Analysis, Insights and Forecast, 2019-2031
- 17.1. Market Analysis, Insights and Forecast - By Country/Sub-region
- 17.1.1 United Arab Emirates
- 17.1.2 Saudi Arabia
- 18. Competitive Analysis
- 18.1. Global Market Share Analysis 2024
- 18.2. Company Profiles
- 18.2.1 Digital Essence SAS
- 18.2.1.1. Overview
- 18.2.1.2. Products
- 18.2.1.3. SWOT Analysis
- 18.2.1.4. Recent Developments
- 18.2.1.5. Financials (Based on Availability)
- 18.2.2 ViewSonic Corporation
- 18.2.2.1. Overview
- 18.2.2.2. Products
- 18.2.2.3. SWOT Analysis
- 18.2.2.4. Recent Developments
- 18.2.2.5. Financials (Based on Availability)
- 18.2.3 Pixel Rain Digita
- 18.2.3.1. Overview
- 18.2.3.2. Products
- 18.2.3.3. SWOT Analysis
- 18.2.3.4. Recent Developments
- 18.2.3.5. Financials (Based on Availability)
- 18.2.4 BenQ Corporation (Qisda Corporation)
- 18.2.4.1. Overview
- 18.2.4.2. Products
- 18.2.4.3. SWOT Analysis
- 18.2.4.4. Recent Developments
- 18.2.4.5. Financials (Based on Availability)
- 18.2.5 Barco NV
- 18.2.5.1. Overview
- 18.2.5.2. Products
- 18.2.5.3. SWOT Analysis
- 18.2.5.4. Recent Developments
- 18.2.5.5. Financials (Based on Availability)
- 18.2.6 Vivitek (Delta Electronics)
- 18.2.6.1. Overview
- 18.2.6.2. Products
- 18.2.6.3. SWOT Analysis
- 18.2.6.4. Recent Developments
- 18.2.6.5. Financials (Based on Availability)
- 18.2.7 Digital Projection
- 18.2.7.1. Overview
- 18.2.7.2. Products
- 18.2.7.3. SWOT Analysis
- 18.2.7.4. Recent Developments
- 18.2.7.5. Financials (Based on Availability)
- 18.2.8 Seiko Epson Corporation
- 18.2.8.1. Overview
- 18.2.8.2. Products
- 18.2.8.3. SWOT Analysis
- 18.2.8.4. Recent Developments
- 18.2.8.5. Financials (Based on Availability)
- 18.2.9 Green Hippo Ltd
- 18.2.9.1. Overview
- 18.2.9.2. Products
- 18.2.9.3. SWOT Analysis
- 18.2.9.4. Recent Developments
- 18.2.9.5. Financials (Based on Availability)
- 18.2.10 NEC Display Solutions (SHARP corporation)
- 18.2.10.1. Overview
- 18.2.10.2. Products
- 18.2.10.3. SWOT Analysis
- 18.2.10.4. Recent Developments
- 18.2.10.5. Financials (Based on Availability)
- 18.2.11 Panasonic Corporation
- 18.2.11.1. Overview
- 18.2.11.2. Products
- 18.2.11.3. SWOT Analysis
- 18.2.11.4. Recent Developments
- 18.2.11.5. Financials (Based on Availability)
- 18.2.1 Digital Essence SAS
List of Figures
- Figure 1: Global Projection Mapping Industry Revenue Breakdown (Million, %) by Region 2024 & 2032
- Figure 2: North America Projection Mapping Industry Revenue (Million), by Country 2024 & 2032
- Figure 3: North America Projection Mapping Industry Revenue Share (%), by Country 2024 & 2032
- Figure 4: Europe Projection Mapping Industry Revenue (Million), by Country 2024 & 2032
- Figure 5: Europe Projection Mapping Industry Revenue Share (%), by Country 2024 & 2032
- Figure 6: Asia Projection Mapping Industry Revenue (Million), by Country 2024 & 2032
- Figure 7: Asia Projection Mapping Industry Revenue Share (%), by Country 2024 & 2032
- Figure 8: Australia and New Zealand Projection Mapping Industry Revenue (Million), by Country 2024 & 2032
- Figure 9: Australia and New Zealand Projection Mapping Industry Revenue Share (%), by Country 2024 & 2032
- Figure 10: Latin America Projection Mapping Industry Revenue (Million), by Country 2024 & 2032
- Figure 11: Latin America Projection Mapping Industry Revenue Share (%), by Country 2024 & 2032
- Figure 12: Middle East and Africa Projection Mapping Industry Revenue (Million), by Country 2024 & 2032
- Figure 13: Middle East and Africa Projection Mapping Industry Revenue Share (%), by Country 2024 & 2032
- Figure 14: North America Projection Mapping Industry Revenue (Million), by Offering 2024 & 2032
- Figure 15: North America Projection Mapping Industry Revenue Share (%), by Offering 2024 & 2032
- Figure 16: North America Projection Mapping Industry Revenue (Million), by Dimension 2024 & 2032
- Figure 17: North America Projection Mapping Industry Revenue Share (%), by Dimension 2024 & 2032
- Figure 18: North America Projection Mapping Industry Revenue (Million), by Throw Distance 2024 & 2032
- Figure 19: North America Projection Mapping Industry Revenue Share (%), by Throw Distance 2024 & 2032
- Figure 20: North America Projection Mapping Industry Revenue (Million), by Application 2024 & 2032
- Figure 21: North America Projection Mapping Industry Revenue Share (%), by Application 2024 & 2032
- Figure 22: North America Projection Mapping Industry Revenue (Million), by Country 2024 & 2032
- Figure 23: North America Projection Mapping Industry Revenue Share (%), by Country 2024 & 2032
- Figure 24: Europe Projection Mapping Industry Revenue (Million), by Offering 2024 & 2032
- Figure 25: Europe Projection Mapping Industry Revenue Share (%), by Offering 2024 & 2032
- Figure 26: Europe Projection Mapping Industry Revenue (Million), by Dimension 2024 & 2032
- Figure 27: Europe Projection Mapping Industry Revenue Share (%), by Dimension 2024 & 2032
- Figure 28: Europe Projection Mapping Industry Revenue (Million), by Throw Distance 2024 & 2032
- Figure 29: Europe Projection Mapping Industry Revenue Share (%), by Throw Distance 2024 & 2032
- Figure 30: Europe Projection Mapping Industry Revenue (Million), by Application 2024 & 2032
- Figure 31: Europe Projection Mapping Industry Revenue Share (%), by Application 2024 & 2032
- Figure 32: Europe Projection Mapping Industry Revenue (Million), by Country 2024 & 2032
- Figure 33: Europe Projection Mapping Industry Revenue Share (%), by Country 2024 & 2032
- Figure 34: Asia Projection Mapping Industry Revenue (Million), by Offering 2024 & 2032
- Figure 35: Asia Projection Mapping Industry Revenue Share (%), by Offering 2024 & 2032
- Figure 36: Asia Projection Mapping Industry Revenue (Million), by Dimension 2024 & 2032
- Figure 37: Asia Projection Mapping Industry Revenue Share (%), by Dimension 2024 & 2032
- Figure 38: Asia Projection Mapping Industry Revenue (Million), by Throw Distance 2024 & 2032
- Figure 39: Asia Projection Mapping Industry Revenue Share (%), by Throw Distance 2024 & 2032
- Figure 40: Asia Projection Mapping Industry Revenue (Million), by Application 2024 & 2032
- Figure 41: Asia Projection Mapping Industry Revenue Share (%), by Application 2024 & 2032
- Figure 42: Asia Projection Mapping Industry Revenue (Million), by Country 2024 & 2032
- Figure 43: Asia Projection Mapping Industry Revenue Share (%), by Country 2024 & 2032
- Figure 44: Australia and New Zealand Projection Mapping Industry Revenue (Million), by Offering 2024 & 2032
- Figure 45: Australia and New Zealand Projection Mapping Industry Revenue Share (%), by Offering 2024 & 2032
- Figure 46: Australia and New Zealand Projection Mapping Industry Revenue (Million), by Dimension 2024 & 2032
- Figure 47: Australia and New Zealand Projection Mapping Industry Revenue Share (%), by Dimension 2024 & 2032
- Figure 48: Australia and New Zealand Projection Mapping Industry Revenue (Million), by Throw Distance 2024 & 2032
- Figure 49: Australia and New Zealand Projection Mapping Industry Revenue Share (%), by Throw Distance 2024 & 2032
- Figure 50: Australia and New Zealand Projection Mapping Industry Revenue (Million), by Application 2024 & 2032
- Figure 51: Australia and New Zealand Projection Mapping Industry Revenue Share (%), by Application 2024 & 2032
- Figure 52: Australia and New Zealand Projection Mapping Industry Revenue (Million), by Country 2024 & 2032
- Figure 53: Australia and New Zealand Projection Mapping Industry Revenue Share (%), by Country 2024 & 2032
- Figure 54: Latin America Projection Mapping Industry Revenue (Million), by Offering 2024 & 2032
- Figure 55: Latin America Projection Mapping Industry Revenue Share (%), by Offering 2024 & 2032
- Figure 56: Latin America Projection Mapping Industry Revenue (Million), by Dimension 2024 & 2032
- Figure 57: Latin America Projection Mapping Industry Revenue Share (%), by Dimension 2024 & 2032
- Figure 58: Latin America Projection Mapping Industry Revenue (Million), by Throw Distance 2024 & 2032
- Figure 59: Latin America Projection Mapping Industry Revenue Share (%), by Throw Distance 2024 & 2032
- Figure 60: Latin America Projection Mapping Industry Revenue (Million), by Application 2024 & 2032
- Figure 61: Latin America Projection Mapping Industry Revenue Share (%), by Application 2024 & 2032
- Figure 62: Latin America Projection Mapping Industry Revenue (Million), by Country 2024 & 2032
- Figure 63: Latin America Projection Mapping Industry Revenue Share (%), by Country 2024 & 2032
- Figure 64: Middle East and Africa Projection Mapping Industry Revenue (Million), by Offering 2024 & 2032
- Figure 65: Middle East and Africa Projection Mapping Industry Revenue Share (%), by Offering 2024 & 2032
- Figure 66: Middle East and Africa Projection Mapping Industry Revenue (Million), by Dimension 2024 & 2032
- Figure 67: Middle East and Africa Projection Mapping Industry Revenue Share (%), by Dimension 2024 & 2032
- Figure 68: Middle East and Africa Projection Mapping Industry Revenue (Million), by Throw Distance 2024 & 2032
- Figure 69: Middle East and Africa Projection Mapping Industry Revenue Share (%), by Throw Distance 2024 & 2032
- Figure 70: Middle East and Africa Projection Mapping Industry Revenue (Million), by Application 2024 & 2032
- Figure 71: Middle East and Africa Projection Mapping Industry Revenue Share (%), by Application 2024 & 2032
- Figure 72: Middle East and Africa Projection Mapping Industry Revenue (Million), by Country 2024 & 2032
- Figure 73: Middle East and Africa Projection Mapping Industry Revenue Share (%), by Country 2024 & 2032
List of Tables
- Table 1: Global Projection Mapping Industry Revenue Million Forecast, by Region 2019 & 2032
- Table 2: Global Projection Mapping Industry Revenue Million Forecast, by Offering 2019 & 2032
- Table 3: Global Projection Mapping Industry Revenue Million Forecast, by Dimension 2019 & 2032
- Table 4: Global Projection Mapping Industry Revenue Million Forecast, by Throw Distance 2019 & 2032
- Table 5: Global Projection Mapping Industry Revenue Million Forecast, by Application 2019 & 2032
- Table 6: Global Projection Mapping Industry Revenue Million Forecast, by Region 2019 & 2032
- Table 7: Global Projection Mapping Industry Revenue Million Forecast, by Country 2019 & 2032
- Table 8: United States Projection Mapping Industry Revenue (Million) Forecast, by Application 2019 & 2032
- Table 9: Canada Projection Mapping Industry Revenue (Million) Forecast, by Application 2019 & 2032
- Table 10: Global Projection Mapping Industry Revenue Million Forecast, by Country 2019 & 2032
- Table 11: Germany Projection Mapping Industry Revenue (Million) Forecast, by Application 2019 & 2032
- Table 12: United Kingdom Projection Mapping Industry Revenue (Million) Forecast, by Application 2019 & 2032
- Table 13: France Projection Mapping Industry Revenue (Million) Forecast, by Application 2019 & 2032
- Table 14: Global Projection Mapping Industry Revenue Million Forecast, by Country 2019 & 2032
- Table 15: India Projection Mapping Industry Revenue (Million) Forecast, by Application 2019 & 2032
- Table 16: China Projection Mapping Industry Revenue (Million) Forecast, by Application 2019 & 2032
- Table 17: Japan Projection Mapping Industry Revenue (Million) Forecast, by Application 2019 & 2032
- Table 18: Global Projection Mapping Industry Revenue Million Forecast, by Country 2019 & 2032
- Table 19: Projection Mapping Industry Revenue (Million) Forecast, by Application 2019 & 2032
- Table 20: Global Projection Mapping Industry Revenue Million Forecast, by Country 2019 & 2032
- Table 21: Brazil Projection Mapping Industry Revenue (Million) Forecast, by Application 2019 & 2032
- Table 22: Argentina Projection Mapping Industry Revenue (Million) Forecast, by Application 2019 & 2032
- Table 23: Global Projection Mapping Industry Revenue Million Forecast, by Country 2019 & 2032
- Table 24: United Arab Emirates Projection Mapping Industry Revenue (Million) Forecast, by Application 2019 & 2032
- Table 25: Saudi Arabia Projection Mapping Industry Revenue (Million) Forecast, by Application 2019 & 2032
- Table 26: Global Projection Mapping Industry Revenue Million Forecast, by Offering 2019 & 2032
- Table 27: Global Projection Mapping Industry Revenue Million Forecast, by Dimension 2019 & 2032
- Table 28: Global Projection Mapping Industry Revenue Million Forecast, by Throw Distance 2019 & 2032
- Table 29: Global Projection Mapping Industry Revenue Million Forecast, by Application 2019 & 2032
- Table 30: Global Projection Mapping Industry Revenue Million Forecast, by Country 2019 & 2032
- Table 31: United States Projection Mapping Industry Revenue (Million) Forecast, by Application 2019 & 2032
- Table 32: Canada Projection Mapping Industry Revenue (Million) Forecast, by Application 2019 & 2032
- Table 33: Global Projection Mapping Industry Revenue Million Forecast, by Offering 2019 & 2032
- Table 34: Global Projection Mapping Industry Revenue Million Forecast, by Dimension 2019 & 2032
- Table 35: Global Projection Mapping Industry Revenue Million Forecast, by Throw Distance 2019 & 2032
- Table 36: Global Projection Mapping Industry Revenue Million Forecast, by Application 2019 & 2032
- Table 37: Global Projection Mapping Industry Revenue Million Forecast, by Country 2019 & 2032
- Table 38: Germany Projection Mapping Industry Revenue (Million) Forecast, by Application 2019 & 2032
- Table 39: United Kingdom Projection Mapping Industry Revenue (Million) Forecast, by Application 2019 & 2032
- Table 40: France Projection Mapping Industry Revenue (Million) Forecast, by Application 2019 & 2032
- Table 41: Global Projection Mapping Industry Revenue Million Forecast, by Offering 2019 & 2032
- Table 42: Global Projection Mapping Industry Revenue Million Forecast, by Dimension 2019 & 2032
- Table 43: Global Projection Mapping Industry Revenue Million Forecast, by Throw Distance 2019 & 2032
- Table 44: Global Projection Mapping Industry Revenue Million Forecast, by Application 2019 & 2032
- Table 45: Global Projection Mapping Industry Revenue Million Forecast, by Country 2019 & 2032
- Table 46: India Projection Mapping Industry Revenue (Million) Forecast, by Application 2019 & 2032
- Table 47: China Projection Mapping Industry Revenue (Million) Forecast, by Application 2019 & 2032
- Table 48: Japan Projection Mapping Industry Revenue (Million) Forecast, by Application 2019 & 2032
- Table 49: Global Projection Mapping Industry Revenue Million Forecast, by Offering 2019 & 2032
- Table 50: Global Projection Mapping Industry Revenue Million Forecast, by Dimension 2019 & 2032
- Table 51: Global Projection Mapping Industry Revenue Million Forecast, by Throw Distance 2019 & 2032
- Table 52: Global Projection Mapping Industry Revenue Million Forecast, by Application 2019 & 2032
- Table 53: Global Projection Mapping Industry Revenue Million Forecast, by Country 2019 & 2032
- Table 54: Global Projection Mapping Industry Revenue Million Forecast, by Offering 2019 & 2032
- Table 55: Global Projection Mapping Industry Revenue Million Forecast, by Dimension 2019 & 2032
- Table 56: Global Projection Mapping Industry Revenue Million Forecast, by Throw Distance 2019 & 2032
- Table 57: Global Projection Mapping Industry Revenue Million Forecast, by Application 2019 & 2032
- Table 58: Global Projection Mapping Industry Revenue Million Forecast, by Country 2019 & 2032
- Table 59: Brazil Projection Mapping Industry Revenue (Million) Forecast, by Application 2019 & 2032
- Table 60: Argentina Projection Mapping Industry Revenue (Million) Forecast, by Application 2019 & 2032
- Table 61: Global Projection Mapping Industry Revenue Million Forecast, by Offering 2019 & 2032
- Table 62: Global Projection Mapping Industry Revenue Million Forecast, by Dimension 2019 & 2032
- Table 63: Global Projection Mapping Industry Revenue Million Forecast, by Throw Distance 2019 & 2032
- Table 64: Global Projection Mapping Industry Revenue Million Forecast, by Application 2019 & 2032
- Table 65: Global Projection Mapping Industry Revenue Million Forecast, by Country 2019 & 2032
- Table 66: United Arab Emirates Projection Mapping Industry Revenue (Million) Forecast, by Application 2019 & 2032
- Table 67: Saudi Arabia Projection Mapping Industry Revenue (Million) Forecast, by Application 2019 & 2032
Frequently Asked Questions
1. What is the projected Compound Annual Growth Rate (CAGR) of the Projection Mapping Industry?
The projected CAGR is approximately 21.87%.
2. Which companies are prominent players in the Projection Mapping Industry?
Key companies in the market include Digital Essence SAS, ViewSonic Corporation, Pixel Rain Digita, BenQ Corporation (Qisda Corporation), Barco NV, Vivitek (Delta Electronics), Digital Projection, Seiko Epson Corporation, Green Hippo Ltd, NEC Display Solutions (SHARP corporation), Panasonic Corporation.
3. What are the main segments of the Projection Mapping Industry?
The market segments include Offering, Dimension, Throw Distance, Application.
4. Can you provide details about the market size?
The market size is estimated to be USD 4.58 Million as of 2022.
5. What are some drivers contributing to market growth?
Increasing Demand for Projection Size. and High Brightness of the Projectors; Rapid Growth of Smart Cities.
6. What are the notable trends driving market growth?
Event Segment to Witness Major Growth.
7. Are there any restraints impacting market growth?
Shorter Operating Range of WiGig Products.
8. Can you provide examples of recent developments in the market?
January 2024 - Epson's latest 4K ultra-lightweight 3LCD projector range, unveiled at ISE 2023, has garnered substantial orders from its rental partner, AED Display. This move solidifies Epson's position as the go-to manufacturer in the high-lumens projector segment.
9. What pricing options are available for accessing the report?
Pricing options include single-user, multi-user, and enterprise licenses priced at USD 4750, USD 5250, and USD 8750 respectively.
10. Is the market size provided in terms of value or volume?
The market size is provided in terms of value, measured in Million.
11. Are there any specific market keywords associated with the report?
Yes, the market keyword associated with the report is "Projection Mapping Industry," which aids in identifying and referencing the specific market segment covered.
12. How do I determine which pricing option suits my needs best?
The pricing options vary based on user requirements and access needs. Individual users may opt for single-user licenses, while businesses requiring broader access may choose multi-user or enterprise licenses for cost-effective access to the report.
13. Are there any additional resources or data provided in the Projection Mapping Industry report?
While the report offers comprehensive insights, it's advisable to review the specific contents or supplementary materials provided to ascertain if additional resources or data are available.
14. How can I stay updated on further developments or reports in the Projection Mapping Industry?
To stay informed about further developments, trends, and reports in the Projection Mapping Industry, consider subscribing to industry newsletters, following relevant companies and organizations, or regularly checking reputable industry news sources and publications.
Methodology
Step 1 - Identification of Relevant Samples Size from Population Database


Step 2 - Approaches for Defining Global Market Size (Value, Volume* & Price*)

Note*: In applicable scenarios
Step 3 - Data Sources
Primary Research
- Web Analytics
- Survey Reports
- Research Institute
- Latest Research Reports
- Opinion Leaders
Secondary Research
- Annual Reports
- White Paper
- Latest Press Release
- Industry Association
- Paid Database
- Investor Presentations

Step 4 - Data Triangulation
Involves using different sources of information in order to increase the validity of a study
These sources are likely to be stakeholders in a program - participants, other researchers, program staff, other community members, and so on.
Then we put all data in single framework & apply various statistical tools to find out the dynamic on the market.
During the analysis stage, feedback from the stakeholder groups would be compared to determine areas of agreement as well as areas of divergence


