
Key Insights
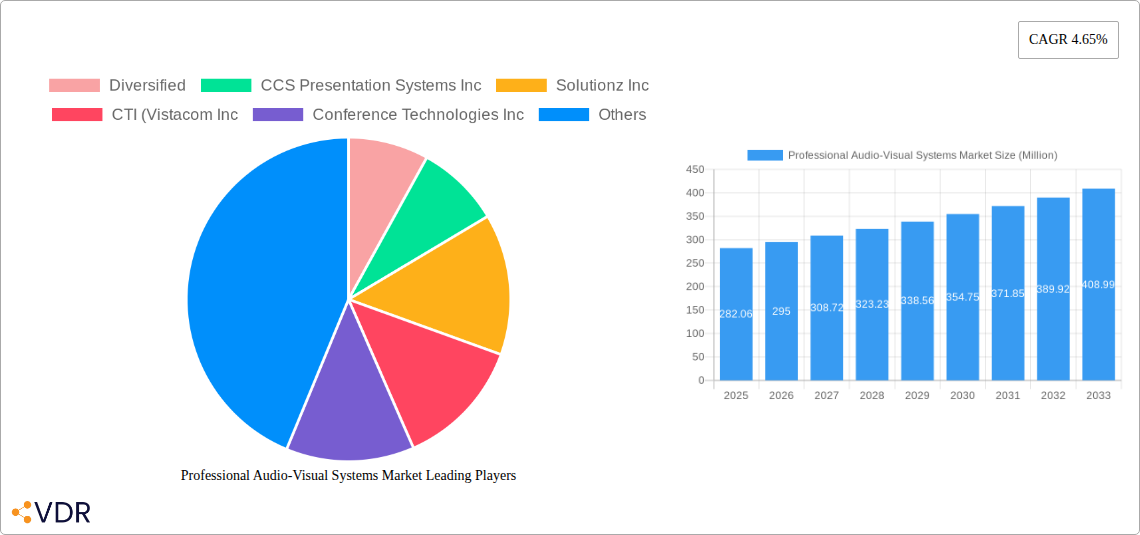
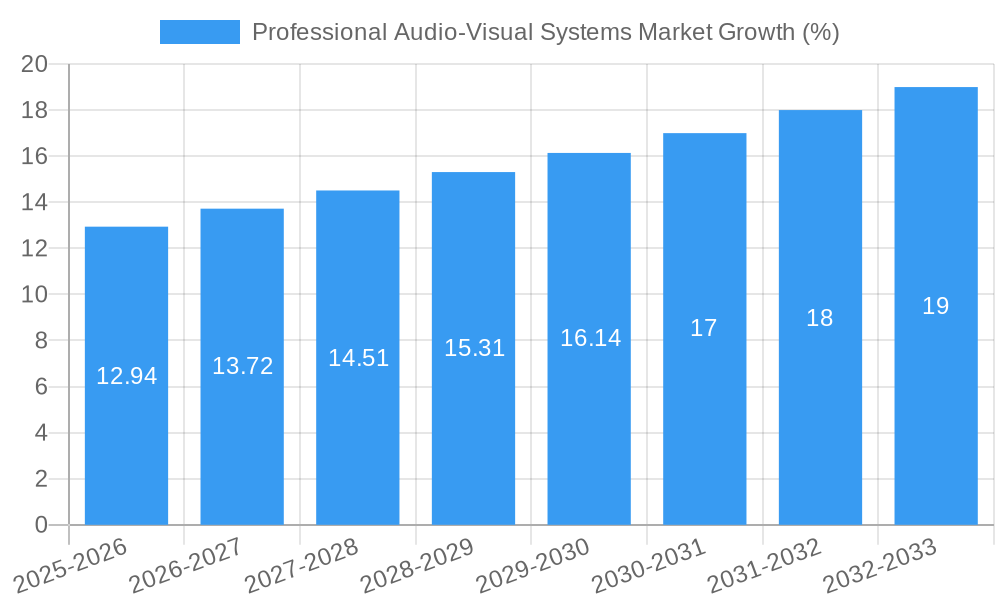
The Professional Audio-Visual (AV) Systems market, valued at $282.06 million in 2025, is poised for robust growth, exhibiting a Compound Annual Growth Rate (CAGR) of 4.65% from 2025 to 2033. This expansion is driven by several key factors. The increasing adoption of hybrid work models and virtual events fuels demand for high-quality video conferencing and collaboration solutions within corporate settings. Simultaneously, the entertainment and media industries' continuous pursuit of immersive experiences is driving investment in advanced projection and display technologies for venues and events. Furthermore, the retail sector's focus on enhancing customer engagement through interactive displays and digital signage contributes significantly to market growth. Technological advancements, such as the integration of artificial intelligence (AI) and Internet of Things (IoT) capabilities within AV systems, are further enhancing functionality and creating new market opportunities. Growth is also being fueled by the increasing demand for advanced streaming media solutions and cloud-based storage and distribution systems.
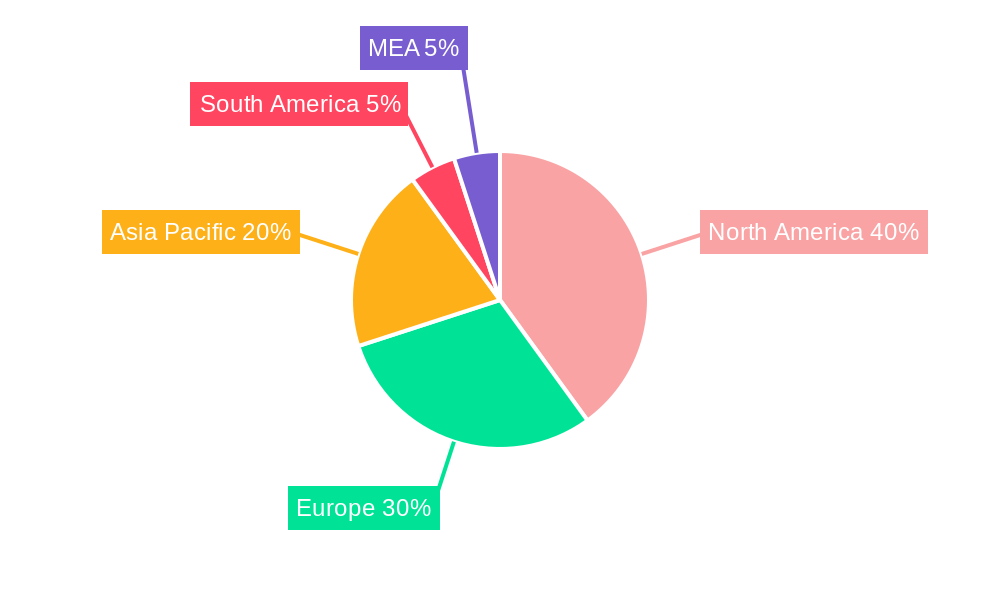
However, market growth faces some challenges. High initial investment costs for sophisticated AV systems can act as a restraint, particularly for smaller businesses. Furthermore, the need for ongoing maintenance and technical support can also impact overall market adoption. Competition among established players and emerging technology providers also necessitates continuous innovation and adaptation to maintain market share. Despite these challenges, the long-term outlook remains positive, with continued expansion predicted across various segments and geographic regions. The North American market currently holds a significant share, but the Asia-Pacific region is expected to witness substantial growth in the coming years, driven by increasing infrastructure development and rising disposable incomes. This dynamic market requires businesses to focus on providing cost-effective, scalable, and user-friendly solutions to cater to the diverse needs of various end-user verticals.
Professional Audio-Visual Systems Market: A Comprehensive Market Report (2019-2033)
This in-depth report provides a comprehensive analysis of the Professional Audio-Visual Systems market, encompassing market dynamics, growth trends, regional dominance, product landscape, key players, and future outlook. The study covers the period 2019-2033, with 2025 as the base year and a forecast period of 2025-2033. This report is invaluable for industry professionals, investors, and strategic decision-makers seeking to understand and capitalize on opportunities within this rapidly evolving sector. The market is segmented by type (Capture and Production Equipment, Video Projection, Streaming Media, Storage, and Distribution, Services, Other Types) and end-user vertical (Corporate, Venues and Events, Retail, Media and Entertainment, Other End-user Verticals).
Professional Audio-Visual Systems Market Dynamics & Structure
The professional audio-visual (AV) systems market is characterized by moderate concentration, with several major players and a multitude of smaller niche providers. Technological innovation, particularly in areas like LED displays, 4K video, and cloud-based solutions, is a key driver. Regulatory frameworks, including those related to data security and accessibility, play a significant role. Competitive substitutes include simpler, less integrated solutions, impacting market penetration. End-user demographics are shifting towards increased adoption in corporate and event spaces. M&A activity has been steady, with larger players consolidating market share. The total market size in 2025 is estimated at xx Million units.
- Market Concentration: Moderately concentrated, with top 10 players holding xx% market share in 2025.
- Technological Innovation: Rapid advancements in LED display technology, 4K resolution, and immersive audio solutions.
- Regulatory Frameworks: Compliance requirements impacting data security and accessibility influence market dynamics.
- Competitive Substitutes: Simpler, less integrated AV solutions present competition.
- End-user Demographics: Growing demand from corporate sectors and event venues.
- M&A Trends: xx M&A deals recorded between 2019 and 2024, indicating consolidation.
Professional Audio-Visual Systems Market Growth Trends & Insights
The professional audio-visual systems market exhibits robust growth, driven by increasing demand for enhanced communication and collaboration across various sectors. From 2019 to 2024, the market experienced a CAGR of xx%, reaching xx Million units in 2024. This growth is fueled by technological disruptions, such as the widespread adoption of 4K resolution displays, cloud-based AV solutions, and immersive audio technologies. The increasing preference for hybrid work models and virtual events further fuels market expansion. Consumer behavior shifts favor higher-quality, integrated AV systems, leading to premiumization. The projected CAGR from 2025 to 2033 is xx%, with the market expected to reach xx Million units by 2033. Market penetration in key segments like corporate and events is expected to increase significantly.
Dominant Regions, Countries, or Segments in Professional Audio-Visual Systems Market
North America currently holds the largest market share in the professional AV systems market, driven by strong economic growth, advanced infrastructure, and high adoption rates in corporate and entertainment sectors. Within the segments, the Video Projection and Services categories are the most dominant, reflecting the high demand for large-scale displays and customized AV solutions. European markets are also experiencing significant growth, although at a slightly slower pace. Asia-Pacific presents a high-growth potential, driven by rapid urbanization and infrastructure development.
- Key Drivers:
- North America: Strong economic growth, advanced infrastructure.
- Europe: Steady economic growth, focus on technological advancements.
- Asia-Pacific: Rapid urbanization, infrastructure investments.
- Dominant Segments: Video Projection and Services show the highest market share and growth potential.
Professional Audio-Visual Systems Market Product Landscape
The professional AV systems market offers a diverse range of products, encompassing high-resolution video projectors, sophisticated audio systems, intuitive control systems, and integrated solutions. Recent innovations focus on enhanced image quality, improved audio fidelity, seamless integration with other technologies (like collaboration platforms), and user-friendly interfaces. Unique selling propositions often involve modularity, scalability, and remote management capabilities. Technological advancements continually drive improved performance metrics, such as higher resolutions, wider color gamuts, and lower latency.
Key Drivers, Barriers & Challenges in Professional Audio-Visual Systems Market
Key Drivers: Increasing demand for enhanced collaboration tools in hybrid work environments, technological advancements in display and audio technologies, and growth in the events and entertainment sectors are driving market growth. Government initiatives promoting digital infrastructure also contribute.
Challenges: Supply chain disruptions can impact component availability and pricing, causing delays and cost increases (estimated impact: xx% on production costs in 2024). Regulatory compliance requirements can add complexity and expense. Intense competition from established and emerging players can pressure pricing.
Emerging Opportunities in Professional Audio-Visual Systems Market
Untapped markets in developing economies present substantial growth opportunities. The integration of AI and IoT technologies opens avenues for innovative applications, such as smart meeting rooms and immersive experiences. Evolving consumer preferences toward sustainability are creating demand for energy-efficient AV solutions.
Growth Accelerators in the Professional Audio-Visual Systems Market Industry
Technological breakthroughs in areas like extended reality (XR) and holographic displays are fueling growth. Strategic partnerships between AV solution providers and technology companies are fostering innovation and market expansion. The adoption of cloud-based AV platforms is streamlining deployment and management, driving market expansion.
Key Players Shaping the Professional Audio-Visual Systems Market Market
- Diversified
- CCS Presentation Systems Inc
- Solutionz Inc
- CTI (Vistacom Inc, Conference Technologies Inc, Ford Audio-Video LLC)
- AVI-SPL Inc
- Solotech Inc
- Electrosonic Group
- AVI Systems Inc
Notable Milestones in Professional Audio-Visual Systems Market Sector
- May 2024: Solotech's record-breaking LED tile purchase from ROE Visual signifies a major shift in LED rental capabilities.
- April 2024: AVI Systems expands its Velocity brand with a new logistics center, enhancing its operational capacity and reach.
In-Depth Professional Audio-Visual Systems Market Market Outlook
The professional AV systems market is poised for continued growth, driven by technological advancements, increased adoption across diverse sectors, and expansion into emerging markets. Strategic partnerships and investments in R&D will play a crucial role in shaping the future of this dynamic industry. The focus on integrated solutions and cloud-based platforms will further drive market expansion, leading to significant growth opportunities for innovative players.
Professional Audio-Visual Systems Market Segmentation
-
1. Type
- 1.1. Capture and Production Equipment
- 1.2. Video Projection
- 1.3. Streaming Media, Storage, and Distribution
- 1.4. Services
- 1.5. Other Types
-
2. End-user Vertical
- 2.1. Corporate
- 2.2. Venues and Events
- 2.3. Retail
- 2.4. Media and Entertainment
- 2.5. Other End-user Verticals
Professional Audio-Visual Systems Market Segmentation By Geography
- 1. North America
- 2. Europe
- 3. Asia
- 4. Australia and New Zealand
- 5. Latin America
- 6. Middle East and Africa
Professional Audio-Visual Systems Market REPORT HIGHLIGHTS
| Aspects | Details |
|---|---|
| Study Period | 2019-2033 |
| Base Year | 2024 |
| Estimated Year | 2025 |
| Forecast Period | 2025-2033 |
| Historical Period | 2019-2024 |
| Growth Rate | CAGR of 4.65% from 2019-2033 |
| Segmentation |
|
Table of Contents
- 1. Introduction
- 1.1. Research Scope
- 1.2. Market Segmentation
- 1.3. Research Methodology
- 1.4. Definitions and Assumptions
- 2. Executive Summary
- 2.1. Introduction
- 3. Market Dynamics
- 3.1. Introduction
- 3.2. Market Drivers
- 3.2.1. Rapid Adoption of Cloud Platforms
- 3.3. Market Restrains
- 3.3.1. High Operating and Legal Costs of Audio-Visual Systems
- 3.4. Market Trends
- 3.4.1. Growth in the Construction Sector Boosting the Demand for Furniture Products
- 4. Market Factor Analysis
- 4.1. Porters Five Forces
- 4.2. Supply/Value Chain
- 4.3. PESTEL analysis
- 4.4. Market Entropy
- 4.5. Patent/Trademark Analysis
- 5. Global Professional Audio-Visual Systems Market Analysis, Insights and Forecast, 2019-2031
- 5.1. Market Analysis, Insights and Forecast - by Type
- 5.1.1. Capture and Production Equipment
- 5.1.2. Video Projection
- 5.1.3. Streaming Media, Storage, and Distribution
- 5.1.4. Services
- 5.1.5. Other Types
- 5.2. Market Analysis, Insights and Forecast - by End-user Vertical
- 5.2.1. Corporate
- 5.2.2. Venues and Events
- 5.2.3. Retail
- 5.2.4. Media and Entertainment
- 5.2.5. Other End-user Verticals
- 5.3. Market Analysis, Insights and Forecast - by Region
- 5.3.1. North America
- 5.3.2. Europe
- 5.3.3. Asia
- 5.3.4. Australia and New Zealand
- 5.3.5. Latin America
- 5.3.6. Middle East and Africa
- 5.1. Market Analysis, Insights and Forecast - by Type
- 6. North America Professional Audio-Visual Systems Market Analysis, Insights and Forecast, 2019-2031
- 6.1. Market Analysis, Insights and Forecast - by Type
- 6.1.1. Capture and Production Equipment
- 6.1.2. Video Projection
- 6.1.3. Streaming Media, Storage, and Distribution
- 6.1.4. Services
- 6.1.5. Other Types
- 6.2. Market Analysis, Insights and Forecast - by End-user Vertical
- 6.2.1. Corporate
- 6.2.2. Venues and Events
- 6.2.3. Retail
- 6.2.4. Media and Entertainment
- 6.2.5. Other End-user Verticals
- 6.1. Market Analysis, Insights and Forecast - by Type
- 7. Europe Professional Audio-Visual Systems Market Analysis, Insights and Forecast, 2019-2031
- 7.1. Market Analysis, Insights and Forecast - by Type
- 7.1.1. Capture and Production Equipment
- 7.1.2. Video Projection
- 7.1.3. Streaming Media, Storage, and Distribution
- 7.1.4. Services
- 7.1.5. Other Types
- 7.2. Market Analysis, Insights and Forecast - by End-user Vertical
- 7.2.1. Corporate
- 7.2.2. Venues and Events
- 7.2.3. Retail
- 7.2.4. Media and Entertainment
- 7.2.5. Other End-user Verticals
- 7.1. Market Analysis, Insights and Forecast - by Type
- 8. Asia Professional Audio-Visual Systems Market Analysis, Insights and Forecast, 2019-2031
- 8.1. Market Analysis, Insights and Forecast - by Type
- 8.1.1. Capture and Production Equipment
- 8.1.2. Video Projection
- 8.1.3. Streaming Media, Storage, and Distribution
- 8.1.4. Services
- 8.1.5. Other Types
- 8.2. Market Analysis, Insights and Forecast - by End-user Vertical
- 8.2.1. Corporate
- 8.2.2. Venues and Events
- 8.2.3. Retail
- 8.2.4. Media and Entertainment
- 8.2.5. Other End-user Verticals
- 8.1. Market Analysis, Insights and Forecast - by Type
- 9. Australia and New Zealand Professional Audio-Visual Systems Market Analysis, Insights and Forecast, 2019-2031
- 9.1. Market Analysis, Insights and Forecast - by Type
- 9.1.1. Capture and Production Equipment
- 9.1.2. Video Projection
- 9.1.3. Streaming Media, Storage, and Distribution
- 9.1.4. Services
- 9.1.5. Other Types
- 9.2. Market Analysis, Insights and Forecast - by End-user Vertical
- 9.2.1. Corporate
- 9.2.2. Venues and Events
- 9.2.3. Retail
- 9.2.4. Media and Entertainment
- 9.2.5. Other End-user Verticals
- 9.1. Market Analysis, Insights and Forecast - by Type
- 10. Latin America Professional Audio-Visual Systems Market Analysis, Insights and Forecast, 2019-2031
- 10.1. Market Analysis, Insights and Forecast - by Type
- 10.1.1. Capture and Production Equipment
- 10.1.2. Video Projection
- 10.1.3. Streaming Media, Storage, and Distribution
- 10.1.4. Services
- 10.1.5. Other Types
- 10.2. Market Analysis, Insights and Forecast - by End-user Vertical
- 10.2.1. Corporate
- 10.2.2. Venues and Events
- 10.2.3. Retail
- 10.2.4. Media and Entertainment
- 10.2.5. Other End-user Verticals
- 10.1. Market Analysis, Insights and Forecast - by Type
- 11. Middle East and Africa Professional Audio-Visual Systems Market Analysis, Insights and Forecast, 2019-2031
- 11.1. Market Analysis, Insights and Forecast - by Type
- 11.1.1. Capture and Production Equipment
- 11.1.2. Video Projection
- 11.1.3. Streaming Media, Storage, and Distribution
- 11.1.4. Services
- 11.1.5. Other Types
- 11.2. Market Analysis, Insights and Forecast - by End-user Vertical
- 11.2.1. Corporate
- 11.2.2. Venues and Events
- 11.2.3. Retail
- 11.2.4. Media and Entertainment
- 11.2.5. Other End-user Verticals
- 11.1. Market Analysis, Insights and Forecast - by Type
- 12. North America Professional Audio-Visual Systems Market Analysis, Insights and Forecast, 2019-2031
- 12.1. Market Analysis, Insights and Forecast - By Country/Sub-region
- 12.1.1 United States
- 12.1.2 Canada
- 12.1.3 Mexico
- 13. Europe Professional Audio-Visual Systems Market Analysis, Insights and Forecast, 2019-2031
- 13.1. Market Analysis, Insights and Forecast - By Country/Sub-region
- 13.1.1 Germany
- 13.1.2 United Kingdom
- 13.1.3 France
- 13.1.4 Spain
- 13.1.5 Italy
- 13.1.6 Spain
- 13.1.7 Belgium
- 13.1.8 Netherland
- 13.1.9 Nordics
- 13.1.10 Rest of Europe
- 14. Asia Pacific Professional Audio-Visual Systems Market Analysis, Insights and Forecast, 2019-2031
- 14.1. Market Analysis, Insights and Forecast - By Country/Sub-region
- 14.1.1 China
- 14.1.2 Japan
- 14.1.3 India
- 14.1.4 South Korea
- 14.1.5 Southeast Asia
- 14.1.6 Australia
- 14.1.7 Indonesia
- 14.1.8 Phillipes
- 14.1.9 Singapore
- 14.1.10 Thailandc
- 14.1.11 Rest of Asia Pacific
- 15. South America Professional Audio-Visual Systems Market Analysis, Insights and Forecast, 2019-2031
- 15.1. Market Analysis, Insights and Forecast - By Country/Sub-region
- 15.1.1 Brazil
- 15.1.2 Argentina
- 15.1.3 Peru
- 15.1.4 Chile
- 15.1.5 Colombia
- 15.1.6 Ecuador
- 15.1.7 Venezuela
- 15.1.8 Rest of South America
- 16. North America Professional Audio-Visual Systems Market Analysis, Insights and Forecast, 2019-2031
- 16.1. Market Analysis, Insights and Forecast - By Country/Sub-region
- 16.1.1 United States
- 16.1.2 Canada
- 16.1.3 Mexico
- 17. MEA Professional Audio-Visual Systems Market Analysis, Insights and Forecast, 2019-2031
- 17.1. Market Analysis, Insights and Forecast - By Country/Sub-region
- 17.1.1 United Arab Emirates
- 17.1.2 Saudi Arabia
- 17.1.3 South Africa
- 17.1.4 Rest of Middle East and Africa
- 18. Competitive Analysis
- 18.1. Global Market Share Analysis 2024
- 18.2. Company Profiles
- 18.2.1 Diversified
- 18.2.1.1. Overview
- 18.2.1.2. Products
- 18.2.1.3. SWOT Analysis
- 18.2.1.4. Recent Developments
- 18.2.1.5. Financials (Based on Availability)
- 18.2.2 CCS Presentation Systems Inc
- 18.2.2.1. Overview
- 18.2.2.2. Products
- 18.2.2.3. SWOT Analysis
- 18.2.2.4. Recent Developments
- 18.2.2.5. Financials (Based on Availability)
- 18.2.3 Solutionz Inc
- 18.2.3.1. Overview
- 18.2.3.2. Products
- 18.2.3.3. SWOT Analysis
- 18.2.3.4. Recent Developments
- 18.2.3.5. Financials (Based on Availability)
- 18.2.4 CTI (Vistacom Inc
- 18.2.4.1. Overview
- 18.2.4.2. Products
- 18.2.4.3. SWOT Analysis
- 18.2.4.4. Recent Developments
- 18.2.4.5. Financials (Based on Availability)
- 18.2.5 Conference Technologies Inc
- 18.2.5.1. Overview
- 18.2.5.2. Products
- 18.2.5.3. SWOT Analysis
- 18.2.5.4. Recent Developments
- 18.2.5.5. Financials (Based on Availability)
- 18.2.6 Ford Audio-Video LLC
- 18.2.6.1. Overview
- 18.2.6.2. Products
- 18.2.6.3. SWOT Analysis
- 18.2.6.4. Recent Developments
- 18.2.6.5. Financials (Based on Availability)
- 18.2.7 AVI-SPL Inc
- 18.2.7.1. Overview
- 18.2.7.2. Products
- 18.2.7.3. SWOT Analysis
- 18.2.7.4. Recent Developments
- 18.2.7.5. Financials (Based on Availability)
- 18.2.8 Solotech Inc
- 18.2.8.1. Overview
- 18.2.8.2. Products
- 18.2.8.3. SWOT Analysis
- 18.2.8.4. Recent Developments
- 18.2.8.5. Financials (Based on Availability)
- 18.2.9 Electrosonic Group
- 18.2.9.1. Overview
- 18.2.9.2. Products
- 18.2.9.3. SWOT Analysis
- 18.2.9.4. Recent Developments
- 18.2.9.5. Financials (Based on Availability)
- 18.2.10 AVI Systems Inc
- 18.2.10.1. Overview
- 18.2.10.2. Products
- 18.2.10.3. SWOT Analysis
- 18.2.10.4. Recent Developments
- 18.2.10.5. Financials (Based on Availability)
- 18.2.1 Diversified
List of Figures
- Figure 1: Global Professional Audio-Visual Systems Market Revenue Breakdown (Million, %) by Region 2024 & 2032
- Figure 2: Global Professional Audio-Visual Systems Market Volume Breakdown (K Unit, %) by Region 2024 & 2032
- Figure 3: North America Professional Audio-Visual Systems Market Revenue (Million), by Country 2024 & 2032
- Figure 4: North America Professional Audio-Visual Systems Market Volume (K Unit), by Country 2024 & 2032
- Figure 5: North America Professional Audio-Visual Systems Market Revenue Share (%), by Country 2024 & 2032
- Figure 6: North America Professional Audio-Visual Systems Market Volume Share (%), by Country 2024 & 2032
- Figure 7: Europe Professional Audio-Visual Systems Market Revenue (Million), by Country 2024 & 2032
- Figure 8: Europe Professional Audio-Visual Systems Market Volume (K Unit), by Country 2024 & 2032
- Figure 9: Europe Professional Audio-Visual Systems Market Revenue Share (%), by Country 2024 & 2032
- Figure 10: Europe Professional Audio-Visual Systems Market Volume Share (%), by Country 2024 & 2032
- Figure 11: Asia Pacific Professional Audio-Visual Systems Market Revenue (Million), by Country 2024 & 2032
- Figure 12: Asia Pacific Professional Audio-Visual Systems Market Volume (K Unit), by Country 2024 & 2032
- Figure 13: Asia Pacific Professional Audio-Visual Systems Market Revenue Share (%), by Country 2024 & 2032
- Figure 14: Asia Pacific Professional Audio-Visual Systems Market Volume Share (%), by Country 2024 & 2032
- Figure 15: South America Professional Audio-Visual Systems Market Revenue (Million), by Country 2024 & 2032
- Figure 16: South America Professional Audio-Visual Systems Market Volume (K Unit), by Country 2024 & 2032
- Figure 17: South America Professional Audio-Visual Systems Market Revenue Share (%), by Country 2024 & 2032
- Figure 18: South America Professional Audio-Visual Systems Market Volume Share (%), by Country 2024 & 2032
- Figure 19: North America Professional Audio-Visual Systems Market Revenue (Million), by Country 2024 & 2032
- Figure 20: North America Professional Audio-Visual Systems Market Volume (K Unit), by Country 2024 & 2032
- Figure 21: North America Professional Audio-Visual Systems Market Revenue Share (%), by Country 2024 & 2032
- Figure 22: North America Professional Audio-Visual Systems Market Volume Share (%), by Country 2024 & 2032
- Figure 23: MEA Professional Audio-Visual Systems Market Revenue (Million), by Country 2024 & 2032
- Figure 24: MEA Professional Audio-Visual Systems Market Volume (K Unit), by Country 2024 & 2032
- Figure 25: MEA Professional Audio-Visual Systems Market Revenue Share (%), by Country 2024 & 2032
- Figure 26: MEA Professional Audio-Visual Systems Market Volume Share (%), by Country 2024 & 2032
- Figure 27: North America Professional Audio-Visual Systems Market Revenue (Million), by Type 2024 & 2032
- Figure 28: North America Professional Audio-Visual Systems Market Volume (K Unit), by Type 2024 & 2032
- Figure 29: North America Professional Audio-Visual Systems Market Revenue Share (%), by Type 2024 & 2032
- Figure 30: North America Professional Audio-Visual Systems Market Volume Share (%), by Type 2024 & 2032
- Figure 31: North America Professional Audio-Visual Systems Market Revenue (Million), by End-user Vertical 2024 & 2032
- Figure 32: North America Professional Audio-Visual Systems Market Volume (K Unit), by End-user Vertical 2024 & 2032
- Figure 33: North America Professional Audio-Visual Systems Market Revenue Share (%), by End-user Vertical 2024 & 2032
- Figure 34: North America Professional Audio-Visual Systems Market Volume Share (%), by End-user Vertical 2024 & 2032
- Figure 35: North America Professional Audio-Visual Systems Market Revenue (Million), by Country 2024 & 2032
- Figure 36: North America Professional Audio-Visual Systems Market Volume (K Unit), by Country 2024 & 2032
- Figure 37: North America Professional Audio-Visual Systems Market Revenue Share (%), by Country 2024 & 2032
- Figure 38: North America Professional Audio-Visual Systems Market Volume Share (%), by Country 2024 & 2032
- Figure 39: Europe Professional Audio-Visual Systems Market Revenue (Million), by Type 2024 & 2032
- Figure 40: Europe Professional Audio-Visual Systems Market Volume (K Unit), by Type 2024 & 2032
- Figure 41: Europe Professional Audio-Visual Systems Market Revenue Share (%), by Type 2024 & 2032
- Figure 42: Europe Professional Audio-Visual Systems Market Volume Share (%), by Type 2024 & 2032
- Figure 43: Europe Professional Audio-Visual Systems Market Revenue (Million), by End-user Vertical 2024 & 2032
- Figure 44: Europe Professional Audio-Visual Systems Market Volume (K Unit), by End-user Vertical 2024 & 2032
- Figure 45: Europe Professional Audio-Visual Systems Market Revenue Share (%), by End-user Vertical 2024 & 2032
- Figure 46: Europe Professional Audio-Visual Systems Market Volume Share (%), by End-user Vertical 2024 & 2032
- Figure 47: Europe Professional Audio-Visual Systems Market Revenue (Million), by Country 2024 & 2032
- Figure 48: Europe Professional Audio-Visual Systems Market Volume (K Unit), by Country 2024 & 2032
- Figure 49: Europe Professional Audio-Visual Systems Market Revenue Share (%), by Country 2024 & 2032
- Figure 50: Europe Professional Audio-Visual Systems Market Volume Share (%), by Country 2024 & 2032
- Figure 51: Asia Professional Audio-Visual Systems Market Revenue (Million), by Type 2024 & 2032
- Figure 52: Asia Professional Audio-Visual Systems Market Volume (K Unit), by Type 2024 & 2032
- Figure 53: Asia Professional Audio-Visual Systems Market Revenue Share (%), by Type 2024 & 2032
- Figure 54: Asia Professional Audio-Visual Systems Market Volume Share (%), by Type 2024 & 2032
- Figure 55: Asia Professional Audio-Visual Systems Market Revenue (Million), by End-user Vertical 2024 & 2032
- Figure 56: Asia Professional Audio-Visual Systems Market Volume (K Unit), by End-user Vertical 2024 & 2032
- Figure 57: Asia Professional Audio-Visual Systems Market Revenue Share (%), by End-user Vertical 2024 & 2032
- Figure 58: Asia Professional Audio-Visual Systems Market Volume Share (%), by End-user Vertical 2024 & 2032
- Figure 59: Asia Professional Audio-Visual Systems Market Revenue (Million), by Country 2024 & 2032
- Figure 60: Asia Professional Audio-Visual Systems Market Volume (K Unit), by Country 2024 & 2032
- Figure 61: Asia Professional Audio-Visual Systems Market Revenue Share (%), by Country 2024 & 2032
- Figure 62: Asia Professional Audio-Visual Systems Market Volume Share (%), by Country 2024 & 2032
- Figure 63: Australia and New Zealand Professional Audio-Visual Systems Market Revenue (Million), by Type 2024 & 2032
- Figure 64: Australia and New Zealand Professional Audio-Visual Systems Market Volume (K Unit), by Type 2024 & 2032
- Figure 65: Australia and New Zealand Professional Audio-Visual Systems Market Revenue Share (%), by Type 2024 & 2032
- Figure 66: Australia and New Zealand Professional Audio-Visual Systems Market Volume Share (%), by Type 2024 & 2032
- Figure 67: Australia and New Zealand Professional Audio-Visual Systems Market Revenue (Million), by End-user Vertical 2024 & 2032
- Figure 68: Australia and New Zealand Professional Audio-Visual Systems Market Volume (K Unit), by End-user Vertical 2024 & 2032
- Figure 69: Australia and New Zealand Professional Audio-Visual Systems Market Revenue Share (%), by End-user Vertical 2024 & 2032
- Figure 70: Australia and New Zealand Professional Audio-Visual Systems Market Volume Share (%), by End-user Vertical 2024 & 2032
- Figure 71: Australia and New Zealand Professional Audio-Visual Systems Market Revenue (Million), by Country 2024 & 2032
- Figure 72: Australia and New Zealand Professional Audio-Visual Systems Market Volume (K Unit), by Country 2024 & 2032
- Figure 73: Australia and New Zealand Professional Audio-Visual Systems Market Revenue Share (%), by Country 2024 & 2032
- Figure 74: Australia and New Zealand Professional Audio-Visual Systems Market Volume Share (%), by Country 2024 & 2032
- Figure 75: Latin America Professional Audio-Visual Systems Market Revenue (Million), by Type 2024 & 2032
- Figure 76: Latin America Professional Audio-Visual Systems Market Volume (K Unit), by Type 2024 & 2032
- Figure 77: Latin America Professional Audio-Visual Systems Market Revenue Share (%), by Type 2024 & 2032
- Figure 78: Latin America Professional Audio-Visual Systems Market Volume Share (%), by Type 2024 & 2032
- Figure 79: Latin America Professional Audio-Visual Systems Market Revenue (Million), by End-user Vertical 2024 & 2032
- Figure 80: Latin America Professional Audio-Visual Systems Market Volume (K Unit), by End-user Vertical 2024 & 2032
- Figure 81: Latin America Professional Audio-Visual Systems Market Revenue Share (%), by End-user Vertical 2024 & 2032
- Figure 82: Latin America Professional Audio-Visual Systems Market Volume Share (%), by End-user Vertical 2024 & 2032
- Figure 83: Latin America Professional Audio-Visual Systems Market Revenue (Million), by Country 2024 & 2032
- Figure 84: Latin America Professional Audio-Visual Systems Market Volume (K Unit), by Country 2024 & 2032
- Figure 85: Latin America Professional Audio-Visual Systems Market Revenue Share (%), by Country 2024 & 2032
- Figure 86: Latin America Professional Audio-Visual Systems Market Volume Share (%), by Country 2024 & 2032
- Figure 87: Middle East and Africa Professional Audio-Visual Systems Market Revenue (Million), by Type 2024 & 2032
- Figure 88: Middle East and Africa Professional Audio-Visual Systems Market Volume (K Unit), by Type 2024 & 2032
- Figure 89: Middle East and Africa Professional Audio-Visual Systems Market Revenue Share (%), by Type 2024 & 2032
- Figure 90: Middle East and Africa Professional Audio-Visual Systems Market Volume Share (%), by Type 2024 & 2032
- Figure 91: Middle East and Africa Professional Audio-Visual Systems Market Revenue (Million), by End-user Vertical 2024 & 2032
- Figure 92: Middle East and Africa Professional Audio-Visual Systems Market Volume (K Unit), by End-user Vertical 2024 & 2032
- Figure 93: Middle East and Africa Professional Audio-Visual Systems Market Revenue Share (%), by End-user Vertical 2024 & 2032
- Figure 94: Middle East and Africa Professional Audio-Visual Systems Market Volume Share (%), by End-user Vertical 2024 & 2032
- Figure 95: Middle East and Africa Professional Audio-Visual Systems Market Revenue (Million), by Country 2024 & 2032
- Figure 96: Middle East and Africa Professional Audio-Visual Systems Market Volume (K Unit), by Country 2024 & 2032
- Figure 97: Middle East and Africa Professional Audio-Visual Systems Market Revenue Share (%), by Country 2024 & 2032
- Figure 98: Middle East and Africa Professional Audio-Visual Systems Market Volume Share (%), by Country 2024 & 2032
List of Tables
- Table 1: Global Professional Audio-Visual Systems Market Revenue Million Forecast, by Region 2019 & 2032
- Table 2: Global Professional Audio-Visual Systems Market Volume K Unit Forecast, by Region 2019 & 2032
- Table 3: Global Professional Audio-Visual Systems Market Revenue Million Forecast, by Type 2019 & 2032
- Table 4: Global Professional Audio-Visual Systems Market Volume K Unit Forecast, by Type 2019 & 2032
- Table 5: Global Professional Audio-Visual Systems Market Revenue Million Forecast, by End-user Vertical 2019 & 2032
- Table 6: Global Professional Audio-Visual Systems Market Volume K Unit Forecast, by End-user Vertical 2019 & 2032
- Table 7: Global Professional Audio-Visual Systems Market Revenue Million Forecast, by Region 2019 & 2032
- Table 8: Global Professional Audio-Visual Systems Market Volume K Unit Forecast, by Region 2019 & 2032
- Table 9: Global Professional Audio-Visual Systems Market Revenue Million Forecast, by Country 2019 & 2032
- Table 10: Global Professional Audio-Visual Systems Market Volume K Unit Forecast, by Country 2019 & 2032
- Table 11: United States Professional Audio-Visual Systems Market Revenue (Million) Forecast, by Application 2019 & 2032
- Table 12: United States Professional Audio-Visual Systems Market Volume (K Unit) Forecast, by Application 2019 & 2032
- Table 13: Canada Professional Audio-Visual Systems Market Revenue (Million) Forecast, by Application 2019 & 2032
- Table 14: Canada Professional Audio-Visual Systems Market Volume (K Unit) Forecast, by Application 2019 & 2032
- Table 15: Mexico Professional Audio-Visual Systems Market Revenue (Million) Forecast, by Application 2019 & 2032
- Table 16: Mexico Professional Audio-Visual Systems Market Volume (K Unit) Forecast, by Application 2019 & 2032
- Table 17: Global Professional Audio-Visual Systems Market Revenue Million Forecast, by Country 2019 & 2032
- Table 18: Global Professional Audio-Visual Systems Market Volume K Unit Forecast, by Country 2019 & 2032
- Table 19: Germany Professional Audio-Visual Systems Market Revenue (Million) Forecast, by Application 2019 & 2032
- Table 20: Germany Professional Audio-Visual Systems Market Volume (K Unit) Forecast, by Application 2019 & 2032
- Table 21: United Kingdom Professional Audio-Visual Systems Market Revenue (Million) Forecast, by Application 2019 & 2032
- Table 22: United Kingdom Professional Audio-Visual Systems Market Volume (K Unit) Forecast, by Application 2019 & 2032
- Table 23: France Professional Audio-Visual Systems Market Revenue (Million) Forecast, by Application 2019 & 2032
- Table 24: France Professional Audio-Visual Systems Market Volume (K Unit) Forecast, by Application 2019 & 2032
- Table 25: Spain Professional Audio-Visual Systems Market Revenue (Million) Forecast, by Application 2019 & 2032
- Table 26: Spain Professional Audio-Visual Systems Market Volume (K Unit) Forecast, by Application 2019 & 2032
- Table 27: Italy Professional Audio-Visual Systems Market Revenue (Million) Forecast, by Application 2019 & 2032
- Table 28: Italy Professional Audio-Visual Systems Market Volume (K Unit) Forecast, by Application 2019 & 2032
- Table 29: Spain Professional Audio-Visual Systems Market Revenue (Million) Forecast, by Application 2019 & 2032
- Table 30: Spain Professional Audio-Visual Systems Market Volume (K Unit) Forecast, by Application 2019 & 2032
- Table 31: Belgium Professional Audio-Visual Systems Market Revenue (Million) Forecast, by Application 2019 & 2032
- Table 32: Belgium Professional Audio-Visual Systems Market Volume (K Unit) Forecast, by Application 2019 & 2032
- Table 33: Netherland Professional Audio-Visual Systems Market Revenue (Million) Forecast, by Application 2019 & 2032
- Table 34: Netherland Professional Audio-Visual Systems Market Volume (K Unit) Forecast, by Application 2019 & 2032
- Table 35: Nordics Professional Audio-Visual Systems Market Revenue (Million) Forecast, by Application 2019 & 2032
- Table 36: Nordics Professional Audio-Visual Systems Market Volume (K Unit) Forecast, by Application 2019 & 2032
- Table 37: Rest of Europe Professional Audio-Visual Systems Market Revenue (Million) Forecast, by Application 2019 & 2032
- Table 38: Rest of Europe Professional Audio-Visual Systems Market Volume (K Unit) Forecast, by Application 2019 & 2032
- Table 39: Global Professional Audio-Visual Systems Market Revenue Million Forecast, by Country 2019 & 2032
- Table 40: Global Professional Audio-Visual Systems Market Volume K Unit Forecast, by Country 2019 & 2032
- Table 41: China Professional Audio-Visual Systems Market Revenue (Million) Forecast, by Application 2019 & 2032
- Table 42: China Professional Audio-Visual Systems Market Volume (K Unit) Forecast, by Application 2019 & 2032
- Table 43: Japan Professional Audio-Visual Systems Market Revenue (Million) Forecast, by Application 2019 & 2032
- Table 44: Japan Professional Audio-Visual Systems Market Volume (K Unit) Forecast, by Application 2019 & 2032
- Table 45: India Professional Audio-Visual Systems Market Revenue (Million) Forecast, by Application 2019 & 2032
- Table 46: India Professional Audio-Visual Systems Market Volume (K Unit) Forecast, by Application 2019 & 2032
- Table 47: South Korea Professional Audio-Visual Systems Market Revenue (Million) Forecast, by Application 2019 & 2032
- Table 48: South Korea Professional Audio-Visual Systems Market Volume (K Unit) Forecast, by Application 2019 & 2032
- Table 49: Southeast Asia Professional Audio-Visual Systems Market Revenue (Million) Forecast, by Application 2019 & 2032
- Table 50: Southeast Asia Professional Audio-Visual Systems Market Volume (K Unit) Forecast, by Application 2019 & 2032
- Table 51: Australia Professional Audio-Visual Systems Market Revenue (Million) Forecast, by Application 2019 & 2032
- Table 52: Australia Professional Audio-Visual Systems Market Volume (K Unit) Forecast, by Application 2019 & 2032
- Table 53: Indonesia Professional Audio-Visual Systems Market Revenue (Million) Forecast, by Application 2019 & 2032
- Table 54: Indonesia Professional Audio-Visual Systems Market Volume (K Unit) Forecast, by Application 2019 & 2032
- Table 55: Phillipes Professional Audio-Visual Systems Market Revenue (Million) Forecast, by Application 2019 & 2032
- Table 56: Phillipes Professional Audio-Visual Systems Market Volume (K Unit) Forecast, by Application 2019 & 2032
- Table 57: Singapore Professional Audio-Visual Systems Market Revenue (Million) Forecast, by Application 2019 & 2032
- Table 58: Singapore Professional Audio-Visual Systems Market Volume (K Unit) Forecast, by Application 2019 & 2032
- Table 59: Thailandc Professional Audio-Visual Systems Market Revenue (Million) Forecast, by Application 2019 & 2032
- Table 60: Thailandc Professional Audio-Visual Systems Market Volume (K Unit) Forecast, by Application 2019 & 2032
- Table 61: Rest of Asia Pacific Professional Audio-Visual Systems Market Revenue (Million) Forecast, by Application 2019 & 2032
- Table 62: Rest of Asia Pacific Professional Audio-Visual Systems Market Volume (K Unit) Forecast, by Application 2019 & 2032
- Table 63: Global Professional Audio-Visual Systems Market Revenue Million Forecast, by Country 2019 & 2032
- Table 64: Global Professional Audio-Visual Systems Market Volume K Unit Forecast, by Country 2019 & 2032
- Table 65: Brazil Professional Audio-Visual Systems Market Revenue (Million) Forecast, by Application 2019 & 2032
- Table 66: Brazil Professional Audio-Visual Systems Market Volume (K Unit) Forecast, by Application 2019 & 2032
- Table 67: Argentina Professional Audio-Visual Systems Market Revenue (Million) Forecast, by Application 2019 & 2032
- Table 68: Argentina Professional Audio-Visual Systems Market Volume (K Unit) Forecast, by Application 2019 & 2032
- Table 69: Peru Professional Audio-Visual Systems Market Revenue (Million) Forecast, by Application 2019 & 2032
- Table 70: Peru Professional Audio-Visual Systems Market Volume (K Unit) Forecast, by Application 2019 & 2032
- Table 71: Chile Professional Audio-Visual Systems Market Revenue (Million) Forecast, by Application 2019 & 2032
- Table 72: Chile Professional Audio-Visual Systems Market Volume (K Unit) Forecast, by Application 2019 & 2032
- Table 73: Colombia Professional Audio-Visual Systems Market Revenue (Million) Forecast, by Application 2019 & 2032
- Table 74: Colombia Professional Audio-Visual Systems Market Volume (K Unit) Forecast, by Application 2019 & 2032
- Table 75: Ecuador Professional Audio-Visual Systems Market Revenue (Million) Forecast, by Application 2019 & 2032
- Table 76: Ecuador Professional Audio-Visual Systems Market Volume (K Unit) Forecast, by Application 2019 & 2032
- Table 77: Venezuela Professional Audio-Visual Systems Market Revenue (Million) Forecast, by Application 2019 & 2032
- Table 78: Venezuela Professional Audio-Visual Systems Market Volume (K Unit) Forecast, by Application 2019 & 2032
- Table 79: Rest of South America Professional Audio-Visual Systems Market Revenue (Million) Forecast, by Application 2019 & 2032
- Table 80: Rest of South America Professional Audio-Visual Systems Market Volume (K Unit) Forecast, by Application 2019 & 2032
- Table 81: Global Professional Audio-Visual Systems Market Revenue Million Forecast, by Country 2019 & 2032
- Table 82: Global Professional Audio-Visual Systems Market Volume K Unit Forecast, by Country 2019 & 2032
- Table 83: United States Professional Audio-Visual Systems Market Revenue (Million) Forecast, by Application 2019 & 2032
- Table 84: United States Professional Audio-Visual Systems Market Volume (K Unit) Forecast, by Application 2019 & 2032
- Table 85: Canada Professional Audio-Visual Systems Market Revenue (Million) Forecast, by Application 2019 & 2032
- Table 86: Canada Professional Audio-Visual Systems Market Volume (K Unit) Forecast, by Application 2019 & 2032
- Table 87: Mexico Professional Audio-Visual Systems Market Revenue (Million) Forecast, by Application 2019 & 2032
- Table 88: Mexico Professional Audio-Visual Systems Market Volume (K Unit) Forecast, by Application 2019 & 2032
- Table 89: Global Professional Audio-Visual Systems Market Revenue Million Forecast, by Country 2019 & 2032
- Table 90: Global Professional Audio-Visual Systems Market Volume K Unit Forecast, by Country 2019 & 2032
- Table 91: United Arab Emirates Professional Audio-Visual Systems Market Revenue (Million) Forecast, by Application 2019 & 2032
- Table 92: United Arab Emirates Professional Audio-Visual Systems Market Volume (K Unit) Forecast, by Application 2019 & 2032
- Table 93: Saudi Arabia Professional Audio-Visual Systems Market Revenue (Million) Forecast, by Application 2019 & 2032
- Table 94: Saudi Arabia Professional Audio-Visual Systems Market Volume (K Unit) Forecast, by Application 2019 & 2032
- Table 95: South Africa Professional Audio-Visual Systems Market Revenue (Million) Forecast, by Application 2019 & 2032
- Table 96: South Africa Professional Audio-Visual Systems Market Volume (K Unit) Forecast, by Application 2019 & 2032
- Table 97: Rest of Middle East and Africa Professional Audio-Visual Systems Market Revenue (Million) Forecast, by Application 2019 & 2032
- Table 98: Rest of Middle East and Africa Professional Audio-Visual Systems Market Volume (K Unit) Forecast, by Application 2019 & 2032
- Table 99: Global Professional Audio-Visual Systems Market Revenue Million Forecast, by Type 2019 & 2032
- Table 100: Global Professional Audio-Visual Systems Market Volume K Unit Forecast, by Type 2019 & 2032
- Table 101: Global Professional Audio-Visual Systems Market Revenue Million Forecast, by End-user Vertical 2019 & 2032
- Table 102: Global Professional Audio-Visual Systems Market Volume K Unit Forecast, by End-user Vertical 2019 & 2032
- Table 103: Global Professional Audio-Visual Systems Market Revenue Million Forecast, by Country 2019 & 2032
- Table 104: Global Professional Audio-Visual Systems Market Volume K Unit Forecast, by Country 2019 & 2032
- Table 105: Global Professional Audio-Visual Systems Market Revenue Million Forecast, by Type 2019 & 2032
- Table 106: Global Professional Audio-Visual Systems Market Volume K Unit Forecast, by Type 2019 & 2032
- Table 107: Global Professional Audio-Visual Systems Market Revenue Million Forecast, by End-user Vertical 2019 & 2032
- Table 108: Global Professional Audio-Visual Systems Market Volume K Unit Forecast, by End-user Vertical 2019 & 2032
- Table 109: Global Professional Audio-Visual Systems Market Revenue Million Forecast, by Country 2019 & 2032
- Table 110: Global Professional Audio-Visual Systems Market Volume K Unit Forecast, by Country 2019 & 2032
- Table 111: Global Professional Audio-Visual Systems Market Revenue Million Forecast, by Type 2019 & 2032
- Table 112: Global Professional Audio-Visual Systems Market Volume K Unit Forecast, by Type 2019 & 2032
- Table 113: Global Professional Audio-Visual Systems Market Revenue Million Forecast, by End-user Vertical 2019 & 2032
- Table 114: Global Professional Audio-Visual Systems Market Volume K Unit Forecast, by End-user Vertical 2019 & 2032
- Table 115: Global Professional Audio-Visual Systems Market Revenue Million Forecast, by Country 2019 & 2032
- Table 116: Global Professional Audio-Visual Systems Market Volume K Unit Forecast, by Country 2019 & 2032
- Table 117: Global Professional Audio-Visual Systems Market Revenue Million Forecast, by Type 2019 & 2032
- Table 118: Global Professional Audio-Visual Systems Market Volume K Unit Forecast, by Type 2019 & 2032
- Table 119: Global Professional Audio-Visual Systems Market Revenue Million Forecast, by End-user Vertical 2019 & 2032
- Table 120: Global Professional Audio-Visual Systems Market Volume K Unit Forecast, by End-user Vertical 2019 & 2032
- Table 121: Global Professional Audio-Visual Systems Market Revenue Million Forecast, by Country 2019 & 2032
- Table 122: Global Professional Audio-Visual Systems Market Volume K Unit Forecast, by Country 2019 & 2032
- Table 123: Global Professional Audio-Visual Systems Market Revenue Million Forecast, by Type 2019 & 2032
- Table 124: Global Professional Audio-Visual Systems Market Volume K Unit Forecast, by Type 2019 & 2032
- Table 125: Global Professional Audio-Visual Systems Market Revenue Million Forecast, by End-user Vertical 2019 & 2032
- Table 126: Global Professional Audio-Visual Systems Market Volume K Unit Forecast, by End-user Vertical 2019 & 2032
- Table 127: Global Professional Audio-Visual Systems Market Revenue Million Forecast, by Country 2019 & 2032
- Table 128: Global Professional Audio-Visual Systems Market Volume K Unit Forecast, by Country 2019 & 2032
- Table 129: Global Professional Audio-Visual Systems Market Revenue Million Forecast, by Type 2019 & 2032
- Table 130: Global Professional Audio-Visual Systems Market Volume K Unit Forecast, by Type 2019 & 2032
- Table 131: Global Professional Audio-Visual Systems Market Revenue Million Forecast, by End-user Vertical 2019 & 2032
- Table 132: Global Professional Audio-Visual Systems Market Volume K Unit Forecast, by End-user Vertical 2019 & 2032
- Table 133: Global Professional Audio-Visual Systems Market Revenue Million Forecast, by Country 2019 & 2032
- Table 134: Global Professional Audio-Visual Systems Market Volume K Unit Forecast, by Country 2019 & 2032
Frequently Asked Questions
1. What is the projected Compound Annual Growth Rate (CAGR) of the Professional Audio-Visual Systems Market?
The projected CAGR is approximately 4.65%.
2. Which companies are prominent players in the Professional Audio-Visual Systems Market?
Key companies in the market include Diversified, CCS Presentation Systems Inc, Solutionz Inc, CTI (Vistacom Inc, Conference Technologies Inc, Ford Audio-Video LLC, AVI-SPL Inc, Solotech Inc, Electrosonic Group, AVI Systems Inc.
3. What are the main segments of the Professional Audio-Visual Systems Market?
The market segments include Type, End-user Vertical.
4. Can you provide details about the market size?
The market size is estimated to be USD 282.06 Million as of 2022.
5. What are some drivers contributing to market growth?
Rapid Adoption of Cloud Platforms.
6. What are the notable trends driving market growth?
Growth in the Construction Sector Boosting the Demand for Furniture Products.
7. Are there any restraints impacting market growth?
High Operating and Legal Costs of Audio-Visual Systems.
8. Can you provide examples of recent developments in the market?
May 2024 - Solotech announced a strategic collaboration with ROE Visual, purchasing over 5000 sq. meters of LED tiles, including 4,500 sq. meters of identical Carbon LED tiles, the largest single-batch of LED tiles ever recorded. This marks a monumental milestone for both companies: LED manufacturer ROE Visual secures its most extensive ROE CB5 Mark II order to date, while Solotech becomes an LED video rental provider.
9. What pricing options are available for accessing the report?
Pricing options include single-user, multi-user, and enterprise licenses priced at USD 4750, USD 5250, and USD 8750 respectively.
10. Is the market size provided in terms of value or volume?
The market size is provided in terms of value, measured in Million and volume, measured in K Unit.
11. Are there any specific market keywords associated with the report?
Yes, the market keyword associated with the report is "Professional Audio-Visual Systems Market," which aids in identifying and referencing the specific market segment covered.
12. How do I determine which pricing option suits my needs best?
The pricing options vary based on user requirements and access needs. Individual users may opt for single-user licenses, while businesses requiring broader access may choose multi-user or enterprise licenses for cost-effective access to the report.
13. Are there any additional resources or data provided in the Professional Audio-Visual Systems Market report?
While the report offers comprehensive insights, it's advisable to review the specific contents or supplementary materials provided to ascertain if additional resources or data are available.
14. How can I stay updated on further developments or reports in the Professional Audio-Visual Systems Market?
To stay informed about further developments, trends, and reports in the Professional Audio-Visual Systems Market, consider subscribing to industry newsletters, following relevant companies and organizations, or regularly checking reputable industry news sources and publications.
Methodology
Step 1 - Identification of Relevant Samples Size from Population Database


Step 2 - Approaches for Defining Global Market Size (Value, Volume* & Price*)

Note*: In applicable scenarios
Step 3 - Data Sources
Primary Research
- Web Analytics
- Survey Reports
- Research Institute
- Latest Research Reports
- Opinion Leaders
Secondary Research
- Annual Reports
- White Paper
- Latest Press Release
- Industry Association
- Paid Database
- Investor Presentations

Step 4 - Data Triangulation
Involves using different sources of information in order to increase the validity of a study
These sources are likely to be stakeholders in a program - participants, other researchers, program staff, other community members, and so on.
Then we put all data in single framework & apply various statistical tools to find out the dynamic on the market.
During the analysis stage, feedback from the stakeholder groups would be compared to determine areas of agreement as well as areas of divergence


