
Key Insights
The global probe card market, valued at $2.05 billion in 2025, is projected to experience robust growth, driven by a compound annual growth rate (CAGR) of 10.60% from 2025 to 2033. This expansion is fueled by several key factors. The increasing demand for advanced semiconductor devices, particularly in the burgeoning 5G and AI sectors, necessitates higher-performing and more sophisticated probe cards. Miniaturization trends in semiconductor manufacturing push the need for advanced probe card technologies capable of handling increasingly dense chip designs. Furthermore, the growth of memory technologies like DRAM and Flash memory, along with the expansion of the foundry and logic segments, are significant contributors to market growth. Technological advancements in MEMS, vertical, and cantilever probe cards are further enhancing performance and enabling testing of complex devices. Increased automation in semiconductor testing processes also contributes to the demand for high-quality probe cards.
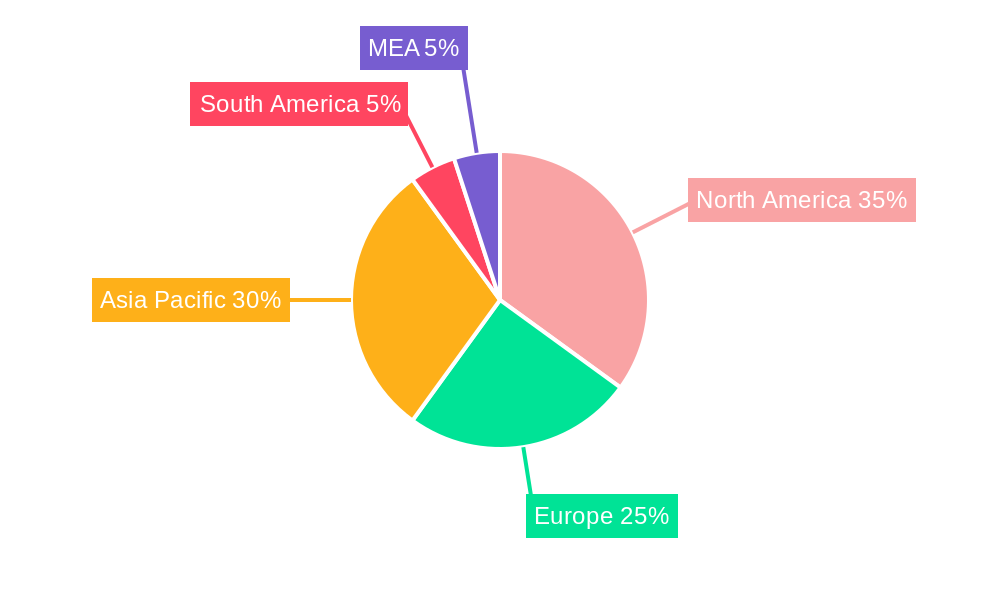
Geographic expansion is another crucial driver. While North America and Asia Pacific currently hold significant market share, emerging economies in regions like Southeast Asia and South America present substantial untapped potential. Competitive dynamics are shaping the market landscape, with established players and new entrants innovating and vying for market share. Despite the positive outlook, challenges remain. High manufacturing costs and the need for specialized expertise can impede wider adoption, particularly in smaller companies. Furthermore, the development and integration of new materials and technologies require substantial R&D investments. Despite these challenges, the long-term outlook for the probe card market remains exceptionally promising, driven by continuous advancements in semiconductor technology and the pervasive integration of electronics across various industries.

Probe Card Market: A Comprehensive Market Report (2019-2033)
This in-depth report provides a comprehensive analysis of the Probe Card market, encompassing market dynamics, growth trends, regional dominance, product landscape, key players, and future outlook. The study period covers 2019-2033, with 2025 as the base and estimated year. This report is invaluable for industry professionals, investors, and strategists seeking to understand and capitalize on the opportunities within this dynamic market segment. The market size is projected to reach xx Million units by 2033.
Probe Card Market Dynamics & Structure
The Probe Card market, valued at xx Million units in 2025, is characterized by a moderately concentrated landscape with key players such as FormFactor Inc, Technoprobe S P A, and Nidec SV Probe holding significant market share. The market is driven by technological innovations, particularly in MEMS technology and advanced probe card designs. Stringent regulatory frameworks related to semiconductor manufacturing impact the industry's operations. Competitive product substitutes, such as alternative testing methodologies, pose a challenge to market growth.
- Market Concentration: Moderately concentrated, with top 5 players holding approximately xx% market share in 2025.
- Technological Innovation: MEMS technology and the development of high-current, high-density probe cards are major drivers.
- Regulatory Frameworks: Compliance with environmental and safety regulations influences manufacturing costs and processes.
- Competitive Substitutes: Alternative testing methods are emerging, posing a threat to traditional probe card usage.
- M&A Trends: A moderate number of mergers and acquisitions (xx deals in the last 5 years) have reshaped the competitive landscape. Consolidation is expected to continue.
- End-User Demographics: Primarily driven by the semiconductor industry, with significant demand from DRAM, Flash, and Foundry/Logic segments.
Probe Card Market Growth Trends & Insights
The Probe Card market experienced significant growth during the historical period (2019-2024), driven by increased semiconductor production and the rising demand for advanced testing solutions. The market is projected to exhibit a CAGR of xx% during the forecast period (2025-2033), reaching xx Million units by 2033. This growth is fueled by advancements in semiconductor technology, miniaturization trends, and the increasing complexity of integrated circuits. The adoption rate of advanced probe cards, especially those incorporating MEMS technology, is accelerating. Consumer behavior shifts towards higher-performance electronics and increased data consumption further bolster market growth. Market penetration in emerging economies is also contributing to the overall expansion.

Dominant Regions, Countries, or Segments in Probe Card Market
The North American region, particularly the United States, dominates the Probe Card market due to the concentration of major semiconductor manufacturers and robust research and development activities. Asia Pacific is experiencing rapid growth, driven by strong demand from countries like China, South Korea, and Taiwan.
By Technology: MEMS technology is the fastest-growing segment, driven by its superior performance characteristics.
By Application: The DRAM and Flash memory segments constitute the largest application areas, driven by high production volumes.
By Type: Advanced probe cards are experiencing significant growth due to the increasing demand for higher-density and more complex testing solutions.
- Key Drivers (North America): Strong semiconductor manufacturing base, high R&D investment, favorable government policies.
- Key Drivers (Asia Pacific): Rapid growth of semiconductor manufacturing, increasing demand for consumer electronics, and supportive government initiatives.
- Market Share: North America holds approximately xx% market share in 2025, while Asia Pacific accounts for xx%.
- Growth Potential: Asia Pacific is projected to witness the highest growth rate during the forecast period.
Probe Card Market Product Landscape
The probe card market showcases a dynamic landscape of advanced technologies. Significant advancements in MEMS, vertical, cantilever, and specialty probe designs have dramatically improved performance and reliability. Key selling points for these innovations include superior signal integrity, faster test speeds, and reduced testing costs. Ongoing development focuses on enhancing current carrying capacity (CCC), decreasing probe pitch for higher density testing, and improving overall durability and longevity. This continuous improvement is crucial for meeting the ever-increasing demands of the semiconductor industry.
Key Drivers, Barriers & Challenges in Probe Card Market
Key Drivers:
- Increasing demand for advanced semiconductor testing solutions.
- Miniaturization of semiconductor devices.
- Rising adoption of high-density integrated circuits.
Key Challenges and Restraints:
- High manufacturing costs associated with advanced probe card designs.
- Intense competition among key players.
- Potential supply chain disruptions impacting material availability.
- The impact of economic downturns on semiconductor industry investment.
Emerging Opportunities in Probe Card Market
- Expansion into emerging markets, particularly in Southeast Asia and Latin America.
- Development of specialized probe cards for emerging semiconductor applications.
- Growing demand for high-frequency probe cards for 5G and beyond applications.
- The rise of advanced packaging technologies creating demand for new probe card solutions.
Growth Accelerators in the Probe Card Market Industry
Several factors are converging to drive substantial growth within the probe card market. Breakthroughs in probe card design, fueled by extensive research and development, are at the forefront. Strategic collaborations and partnerships between probe card manufacturers and leading semiconductor companies are also proving crucial for innovation and market penetration. The expansion of semiconductor manufacturing capacity in key regions globally, coupled with the widespread adoption of advanced testing methodologies, further accelerates market expansion. The increasing complexity of semiconductor devices necessitates the use of more sophisticated probe cards, driving demand.
Key Players Shaping the Probe Card Market Market
- Nidec SV Probe
- Protec Mems Technology
- Willtechnology Co Ltd
- Formfactor Inc
- Wentworth Laboratories Inc
- Japan Electronic Materials Corporation
- Micronics Japan Co Ltd
- TSE Co Ltd
- Feinmetall GmbH
- Star Technologies Inc
- Technoprobe S.p.A
- MPI Corporation
- GGB Industries Inc
- Korea Instruments Co Ltd
Notable Milestones in Probe Card Market Sector
- April 2024: FormFactor launched COMPASS, a significant advancement focusing on maximizing CCC in probe cards and introducing "unburnable" probes, thereby improving performance at an 80-um minimum pitch. This demonstrates a commitment to pushing the boundaries of probe card technology.
- January 2024: Samsung's establishment of a new research lab in the US for advanced 3D-DRAM development underscores the growing importance of advanced testing solutions and the resulting demand for high-performance probe cards to support this innovation.
- [Add other relevant milestones here with dates and brief descriptions]
In-Depth Probe Card Market Market Outlook
The Probe Card market is projected for robust and sustained growth throughout the next decade. This positive outlook is driven by continuous innovation in probe card technologies and the ever-increasing demands from the rapidly evolving semiconductor industry. Strategic partnerships, substantial investments in research and development, and a focus on delivering superior performance are vital for companies seeking to maintain a competitive advantage and successfully capitalize on the numerous emerging opportunities within this dynamic sector. The future success of the probe card market is inextricably linked to the ongoing advancements in semiconductor technology and the growth of related industries, including 5G, AI, and high-performance computing.
Probe Card Market Segmentation
-
1. Technology
- 1.1. MEMS
- 1.2. Vertical
- 1.3. Cantilever
- 1.4. Speciality
- 1.5. Other Technologies
-
2. Application
- 2.1. DRAM
- 2.2. Flash
- 2.3. Foundry and Logic
- 2.4. Parametric
- 2.5. Other Applications
-
3. Type
- 3.1. Standard Probe Card
- 3.2. Advanced Probe Card
Probe Card Market Segmentation By Geography
- 1. North America
- 2. Europe
- 3. Asia
- 4. Australia and New Zealand
- 5. Latin America
- 6. Middle East and Africa
Probe Card Market REPORT HIGHLIGHTS
| Aspects | Details |
|---|---|
| Study Period | 2019-2033 |
| Base Year | 2024 |
| Estimated Year | 2025 |
| Forecast Period | 2025-2033 |
| Historical Period | 2019-2024 |
| Growth Rate | CAGR of 10.60% from 2019-2033 |
| Segmentation |
|
Table of Contents
- 1. Introduction
- 1.1. Research Scope
- 1.2. Market Segmentation
- 1.3. Research Methodology
- 1.4. Definitions and Assumptions
- 2. Executive Summary
- 2.1. Introduction
- 3. Market Dynamics
- 3.1. Introduction
- 3.2. Market Drivers
- 3.2.1. Increase in Demand for Consumer Electronics and IOT; Miniaturization of Electronic Products; Technological Advancement And Innovations in Semiconductor Industry
- 3.3. Market Restrains
- 3.3.1. High Costs Associated with Probe Cards; Lack of Awareness Among Consumers Regarding The Benefits of Probe Card Solution
- 3.4. Market Trends
- 3.4.1. MEMS to Dominate the Technology Segment
- 4. Market Factor Analysis
- 4.1. Porters Five Forces
- 4.2. Supply/Value Chain
- 4.3. PESTEL analysis
- 4.4. Market Entropy
- 4.5. Patent/Trademark Analysis
- 5. Global Probe Card Market Analysis, Insights and Forecast, 2019-2031
- 5.1. Market Analysis, Insights and Forecast - by Technology
- 5.1.1. MEMS
- 5.1.2. Vertical
- 5.1.3. Cantilever
- 5.1.4. Speciality
- 5.1.5. Other Technologies
- 5.2. Market Analysis, Insights and Forecast - by Application
- 5.2.1. DRAM
- 5.2.2. Flash
- 5.2.3. Foundry and Logic
- 5.2.4. Parametric
- 5.2.5. Other Applications
- 5.3. Market Analysis, Insights and Forecast - by Type
- 5.3.1. Standard Probe Card
- 5.3.2. Advanced Probe Card
- 5.4. Market Analysis, Insights and Forecast - by Region
- 5.4.1. North America
- 5.4.2. Europe
- 5.4.3. Asia
- 5.4.4. Australia and New Zealand
- 5.4.5. Latin America
- 5.4.6. Middle East and Africa
- 5.1. Market Analysis, Insights and Forecast - by Technology
- 6. North America Probe Card Market Analysis, Insights and Forecast, 2019-2031
- 6.1. Market Analysis, Insights and Forecast - by Technology
- 6.1.1. MEMS
- 6.1.2. Vertical
- 6.1.3. Cantilever
- 6.1.4. Speciality
- 6.1.5. Other Technologies
- 6.2. Market Analysis, Insights and Forecast - by Application
- 6.2.1. DRAM
- 6.2.2. Flash
- 6.2.3. Foundry and Logic
- 6.2.4. Parametric
- 6.2.5. Other Applications
- 6.3. Market Analysis, Insights and Forecast - by Type
- 6.3.1. Standard Probe Card
- 6.3.2. Advanced Probe Card
- 6.1. Market Analysis, Insights and Forecast - by Technology
- 7. Europe Probe Card Market Analysis, Insights and Forecast, 2019-2031
- 7.1. Market Analysis, Insights and Forecast - by Technology
- 7.1.1. MEMS
- 7.1.2. Vertical
- 7.1.3. Cantilever
- 7.1.4. Speciality
- 7.1.5. Other Technologies
- 7.2. Market Analysis, Insights and Forecast - by Application
- 7.2.1. DRAM
- 7.2.2. Flash
- 7.2.3. Foundry and Logic
- 7.2.4. Parametric
- 7.2.5. Other Applications
- 7.3. Market Analysis, Insights and Forecast - by Type
- 7.3.1. Standard Probe Card
- 7.3.2. Advanced Probe Card
- 7.1. Market Analysis, Insights and Forecast - by Technology
- 8. Asia Probe Card Market Analysis, Insights and Forecast, 2019-2031
- 8.1. Market Analysis, Insights and Forecast - by Technology
- 8.1.1. MEMS
- 8.1.2. Vertical
- 8.1.3. Cantilever
- 8.1.4. Speciality
- 8.1.5. Other Technologies
- 8.2. Market Analysis, Insights and Forecast - by Application
- 8.2.1. DRAM
- 8.2.2. Flash
- 8.2.3. Foundry and Logic
- 8.2.4. Parametric
- 8.2.5. Other Applications
- 8.3. Market Analysis, Insights and Forecast - by Type
- 8.3.1. Standard Probe Card
- 8.3.2. Advanced Probe Card
- 8.1. Market Analysis, Insights and Forecast - by Technology
- 9. Australia and New Zealand Probe Card Market Analysis, Insights and Forecast, 2019-2031
- 9.1. Market Analysis, Insights and Forecast - by Technology
- 9.1.1. MEMS
- 9.1.2. Vertical
- 9.1.3. Cantilever
- 9.1.4. Speciality
- 9.1.5. Other Technologies
- 9.2. Market Analysis, Insights and Forecast - by Application
- 9.2.1. DRAM
- 9.2.2. Flash
- 9.2.3. Foundry and Logic
- 9.2.4. Parametric
- 9.2.5. Other Applications
- 9.3. Market Analysis, Insights and Forecast - by Type
- 9.3.1. Standard Probe Card
- 9.3.2. Advanced Probe Card
- 9.1. Market Analysis, Insights and Forecast - by Technology
- 10. Latin America Probe Card Market Analysis, Insights and Forecast, 2019-2031
- 10.1. Market Analysis, Insights and Forecast - by Technology
- 10.1.1. MEMS
- 10.1.2. Vertical
- 10.1.3. Cantilever
- 10.1.4. Speciality
- 10.1.5. Other Technologies
- 10.2. Market Analysis, Insights and Forecast - by Application
- 10.2.1. DRAM
- 10.2.2. Flash
- 10.2.3. Foundry and Logic
- 10.2.4. Parametric
- 10.2.5. Other Applications
- 10.3. Market Analysis, Insights and Forecast - by Type
- 10.3.1. Standard Probe Card
- 10.3.2. Advanced Probe Card
- 10.1. Market Analysis, Insights and Forecast - by Technology
- 11. Middle East and Africa Probe Card Market Analysis, Insights and Forecast, 2019-2031
- 11.1. Market Analysis, Insights and Forecast - by Technology
- 11.1.1. MEMS
- 11.1.2. Vertical
- 11.1.3. Cantilever
- 11.1.4. Speciality
- 11.1.5. Other Technologies
- 11.2. Market Analysis, Insights and Forecast - by Application
- 11.2.1. DRAM
- 11.2.2. Flash
- 11.2.3. Foundry and Logic
- 11.2.4. Parametric
- 11.2.5. Other Applications
- 11.3. Market Analysis, Insights and Forecast - by Type
- 11.3.1. Standard Probe Card
- 11.3.2. Advanced Probe Card
- 11.1. Market Analysis, Insights and Forecast - by Technology
- 12. North America Probe Card Market Analysis, Insights and Forecast, 2019-2031
- 12.1. Market Analysis, Insights and Forecast - By Country/Sub-region
- 12.1.1 United States
- 12.1.2 Canada
- 12.1.3 Mexico
- 13. Europe Probe Card Market Analysis, Insights and Forecast, 2019-2031
- 13.1. Market Analysis, Insights and Forecast - By Country/Sub-region
- 13.1.1 Germany
- 13.1.2 United Kingdom
- 13.1.3 France
- 13.1.4 Spain
- 13.1.5 Italy
- 13.1.6 Spain
- 13.1.7 Belgium
- 13.1.8 Netherland
- 13.1.9 Nordics
- 13.1.10 Rest of Europe
- 14. Asia Pacific Probe Card Market Analysis, Insights and Forecast, 2019-2031
- 14.1. Market Analysis, Insights and Forecast - By Country/Sub-region
- 14.1.1 China
- 14.1.2 Japan
- 14.1.3 India
- 14.1.4 South Korea
- 14.1.5 Southeast Asia
- 14.1.6 Australia
- 14.1.7 Indonesia
- 14.1.8 Phillipes
- 14.1.9 Singapore
- 14.1.10 Thailandc
- 14.1.11 Rest of Asia Pacific
- 15. South America Probe Card Market Analysis, Insights and Forecast, 2019-2031
- 15.1. Market Analysis, Insights and Forecast - By Country/Sub-region
- 15.1.1 Brazil
- 15.1.2 Argentina
- 15.1.3 Peru
- 15.1.4 Chile
- 15.1.5 Colombia
- 15.1.6 Ecuador
- 15.1.7 Venezuela
- 15.1.8 Rest of South America
- 16. North America Probe Card Market Analysis, Insights and Forecast, 2019-2031
- 16.1. Market Analysis, Insights and Forecast - By Country/Sub-region
- 16.1.1 United States
- 16.1.2 Canada
- 16.1.3 Mexico
- 17. MEA Probe Card Market Analysis, Insights and Forecast, 2019-2031
- 17.1. Market Analysis, Insights and Forecast - By Country/Sub-region
- 17.1.1 United Arab Emirates
- 17.1.2 Saudi Arabia
- 17.1.3 South Africa
- 17.1.4 Rest of Middle East and Africa
- 18. Competitive Analysis
- 18.1. Global Market Share Analysis 2024
- 18.2. Company Profiles
- 18.2.1 Nidec SV Probe
- 18.2.1.1. Overview
- 18.2.1.2. Products
- 18.2.1.3. SWOT Analysis
- 18.2.1.4. Recent Developments
- 18.2.1.5. Financials (Based on Availability)
- 18.2.2 Protec Mems Technology
- 18.2.2.1. Overview
- 18.2.2.2. Products
- 18.2.2.3. SWOT Analysis
- 18.2.2.4. Recent Developments
- 18.2.2.5. Financials (Based on Availability)
- 18.2.3 Willtechnology Co Ltd
- 18.2.3.1. Overview
- 18.2.3.2. Products
- 18.2.3.3. SWOT Analysis
- 18.2.3.4. Recent Developments
- 18.2.3.5. Financials (Based on Availability)
- 18.2.4 Formfactor Inc
- 18.2.4.1. Overview
- 18.2.4.2. Products
- 18.2.4.3. SWOT Analysis
- 18.2.4.4. Recent Developments
- 18.2.4.5. Financials (Based on Availability)
- 18.2.5 Wentworth Laboratories Inc
- 18.2.5.1. Overview
- 18.2.5.2. Products
- 18.2.5.3. SWOT Analysis
- 18.2.5.4. Recent Developments
- 18.2.5.5. Financials (Based on Availability)
- 18.2.6 Japan Electronic Materials Corporation
- 18.2.6.1. Overview
- 18.2.6.2. Products
- 18.2.6.3. SWOT Analysis
- 18.2.6.4. Recent Developments
- 18.2.6.5. Financials (Based on Availability)
- 18.2.7 Micronics Japan Co Ltd
- 18.2.7.1. Overview
- 18.2.7.2. Products
- 18.2.7.3. SWOT Analysis
- 18.2.7.4. Recent Developments
- 18.2.7.5. Financials (Based on Availability)
- 18.2.8 TSE Co Lt
- 18.2.8.1. Overview
- 18.2.8.2. Products
- 18.2.8.3. SWOT Analysis
- 18.2.8.4. Recent Developments
- 18.2.8.5. Financials (Based on Availability)
- 18.2.9 Feinmetall Gmbh
- 18.2.9.1. Overview
- 18.2.9.2. Products
- 18.2.9.3. SWOT Analysis
- 18.2.9.4. Recent Developments
- 18.2.9.5. Financials (Based on Availability)
- 18.2.10 Star Technologies Inc
- 18.2.10.1. Overview
- 18.2.10.2. Products
- 18.2.10.3. SWOT Analysis
- 18.2.10.4. Recent Developments
- 18.2.10.5. Financials (Based on Availability)
- 18.2.11 Technoprobe S P A
- 18.2.11.1. Overview
- 18.2.11.2. Products
- 18.2.11.3. SWOT Analysis
- 18.2.11.4. Recent Developments
- 18.2.11.5. Financials (Based on Availability)
- 18.2.12 Mpi Corporation
- 18.2.12.1. Overview
- 18.2.12.2. Products
- 18.2.12.3. SWOT Analysis
- 18.2.12.4. Recent Developments
- 18.2.12.5. Financials (Based on Availability)
- 18.2.13 GGB Industries Inc
- 18.2.13.1. Overview
- 18.2.13.2. Products
- 18.2.13.3. SWOT Analysis
- 18.2.13.4. Recent Developments
- 18.2.13.5. Financials (Based on Availability)
- 18.2.14 Korea Instruments Co Ltd
- 18.2.14.1. Overview
- 18.2.14.2. Products
- 18.2.14.3. SWOT Analysis
- 18.2.14.4. Recent Developments
- 18.2.14.5. Financials (Based on Availability)
- 18.2.1 Nidec SV Probe
List of Figures
- Figure 1: Global Probe Card Market Revenue Breakdown (Million, %) by Region 2024 & 2032
- Figure 2: Global Probe Card Market Volume Breakdown (K Unit, %) by Region 2024 & 2032
- Figure 3: North America Probe Card Market Revenue (Million), by Country 2024 & 2032
- Figure 4: North America Probe Card Market Volume (K Unit), by Country 2024 & 2032
- Figure 5: North America Probe Card Market Revenue Share (%), by Country 2024 & 2032
- Figure 6: North America Probe Card Market Volume Share (%), by Country 2024 & 2032
- Figure 7: Europe Probe Card Market Revenue (Million), by Country 2024 & 2032
- Figure 8: Europe Probe Card Market Volume (K Unit), by Country 2024 & 2032
- Figure 9: Europe Probe Card Market Revenue Share (%), by Country 2024 & 2032
- Figure 10: Europe Probe Card Market Volume Share (%), by Country 2024 & 2032
- Figure 11: Asia Pacific Probe Card Market Revenue (Million), by Country 2024 & 2032
- Figure 12: Asia Pacific Probe Card Market Volume (K Unit), by Country 2024 & 2032
- Figure 13: Asia Pacific Probe Card Market Revenue Share (%), by Country 2024 & 2032
- Figure 14: Asia Pacific Probe Card Market Volume Share (%), by Country 2024 & 2032
- Figure 15: South America Probe Card Market Revenue (Million), by Country 2024 & 2032
- Figure 16: South America Probe Card Market Volume (K Unit), by Country 2024 & 2032
- Figure 17: South America Probe Card Market Revenue Share (%), by Country 2024 & 2032
- Figure 18: South America Probe Card Market Volume Share (%), by Country 2024 & 2032
- Figure 19: North America Probe Card Market Revenue (Million), by Country 2024 & 2032
- Figure 20: North America Probe Card Market Volume (K Unit), by Country 2024 & 2032
- Figure 21: North America Probe Card Market Revenue Share (%), by Country 2024 & 2032
- Figure 22: North America Probe Card Market Volume Share (%), by Country 2024 & 2032
- Figure 23: MEA Probe Card Market Revenue (Million), by Country 2024 & 2032
- Figure 24: MEA Probe Card Market Volume (K Unit), by Country 2024 & 2032
- Figure 25: MEA Probe Card Market Revenue Share (%), by Country 2024 & 2032
- Figure 26: MEA Probe Card Market Volume Share (%), by Country 2024 & 2032
- Figure 27: North America Probe Card Market Revenue (Million), by Technology 2024 & 2032
- Figure 28: North America Probe Card Market Volume (K Unit), by Technology 2024 & 2032
- Figure 29: North America Probe Card Market Revenue Share (%), by Technology 2024 & 2032
- Figure 30: North America Probe Card Market Volume Share (%), by Technology 2024 & 2032
- Figure 31: North America Probe Card Market Revenue (Million), by Application 2024 & 2032
- Figure 32: North America Probe Card Market Volume (K Unit), by Application 2024 & 2032
- Figure 33: North America Probe Card Market Revenue Share (%), by Application 2024 & 2032
- Figure 34: North America Probe Card Market Volume Share (%), by Application 2024 & 2032
- Figure 35: North America Probe Card Market Revenue (Million), by Type 2024 & 2032
- Figure 36: North America Probe Card Market Volume (K Unit), by Type 2024 & 2032
- Figure 37: North America Probe Card Market Revenue Share (%), by Type 2024 & 2032
- Figure 38: North America Probe Card Market Volume Share (%), by Type 2024 & 2032
- Figure 39: North America Probe Card Market Revenue (Million), by Country 2024 & 2032
- Figure 40: North America Probe Card Market Volume (K Unit), by Country 2024 & 2032
- Figure 41: North America Probe Card Market Revenue Share (%), by Country 2024 & 2032
- Figure 42: North America Probe Card Market Volume Share (%), by Country 2024 & 2032
- Figure 43: Europe Probe Card Market Revenue (Million), by Technology 2024 & 2032
- Figure 44: Europe Probe Card Market Volume (K Unit), by Technology 2024 & 2032
- Figure 45: Europe Probe Card Market Revenue Share (%), by Technology 2024 & 2032
- Figure 46: Europe Probe Card Market Volume Share (%), by Technology 2024 & 2032
- Figure 47: Europe Probe Card Market Revenue (Million), by Application 2024 & 2032
- Figure 48: Europe Probe Card Market Volume (K Unit), by Application 2024 & 2032
- Figure 49: Europe Probe Card Market Revenue Share (%), by Application 2024 & 2032
- Figure 50: Europe Probe Card Market Volume Share (%), by Application 2024 & 2032
- Figure 51: Europe Probe Card Market Revenue (Million), by Type 2024 & 2032
- Figure 52: Europe Probe Card Market Volume (K Unit), by Type 2024 & 2032
- Figure 53: Europe Probe Card Market Revenue Share (%), by Type 2024 & 2032
- Figure 54: Europe Probe Card Market Volume Share (%), by Type 2024 & 2032
- Figure 55: Europe Probe Card Market Revenue (Million), by Country 2024 & 2032
- Figure 56: Europe Probe Card Market Volume (K Unit), by Country 2024 & 2032
- Figure 57: Europe Probe Card Market Revenue Share (%), by Country 2024 & 2032
- Figure 58: Europe Probe Card Market Volume Share (%), by Country 2024 & 2032
- Figure 59: Asia Probe Card Market Revenue (Million), by Technology 2024 & 2032
- Figure 60: Asia Probe Card Market Volume (K Unit), by Technology 2024 & 2032
- Figure 61: Asia Probe Card Market Revenue Share (%), by Technology 2024 & 2032
- Figure 62: Asia Probe Card Market Volume Share (%), by Technology 2024 & 2032
- Figure 63: Asia Probe Card Market Revenue (Million), by Application 2024 & 2032
- Figure 64: Asia Probe Card Market Volume (K Unit), by Application 2024 & 2032
- Figure 65: Asia Probe Card Market Revenue Share (%), by Application 2024 & 2032
- Figure 66: Asia Probe Card Market Volume Share (%), by Application 2024 & 2032
- Figure 67: Asia Probe Card Market Revenue (Million), by Type 2024 & 2032
- Figure 68: Asia Probe Card Market Volume (K Unit), by Type 2024 & 2032
- Figure 69: Asia Probe Card Market Revenue Share (%), by Type 2024 & 2032
- Figure 70: Asia Probe Card Market Volume Share (%), by Type 2024 & 2032
- Figure 71: Asia Probe Card Market Revenue (Million), by Country 2024 & 2032
- Figure 72: Asia Probe Card Market Volume (K Unit), by Country 2024 & 2032
- Figure 73: Asia Probe Card Market Revenue Share (%), by Country 2024 & 2032
- Figure 74: Asia Probe Card Market Volume Share (%), by Country 2024 & 2032
- Figure 75: Australia and New Zealand Probe Card Market Revenue (Million), by Technology 2024 & 2032
- Figure 76: Australia and New Zealand Probe Card Market Volume (K Unit), by Technology 2024 & 2032
- Figure 77: Australia and New Zealand Probe Card Market Revenue Share (%), by Technology 2024 & 2032
- Figure 78: Australia and New Zealand Probe Card Market Volume Share (%), by Technology 2024 & 2032
- Figure 79: Australia and New Zealand Probe Card Market Revenue (Million), by Application 2024 & 2032
- Figure 80: Australia and New Zealand Probe Card Market Volume (K Unit), by Application 2024 & 2032
- Figure 81: Australia and New Zealand Probe Card Market Revenue Share (%), by Application 2024 & 2032
- Figure 82: Australia and New Zealand Probe Card Market Volume Share (%), by Application 2024 & 2032
- Figure 83: Australia and New Zealand Probe Card Market Revenue (Million), by Type 2024 & 2032
- Figure 84: Australia and New Zealand Probe Card Market Volume (K Unit), by Type 2024 & 2032
- Figure 85: Australia and New Zealand Probe Card Market Revenue Share (%), by Type 2024 & 2032
- Figure 86: Australia and New Zealand Probe Card Market Volume Share (%), by Type 2024 & 2032
- Figure 87: Australia and New Zealand Probe Card Market Revenue (Million), by Country 2024 & 2032
- Figure 88: Australia and New Zealand Probe Card Market Volume (K Unit), by Country 2024 & 2032
- Figure 89: Australia and New Zealand Probe Card Market Revenue Share (%), by Country 2024 & 2032
- Figure 90: Australia and New Zealand Probe Card Market Volume Share (%), by Country 2024 & 2032
- Figure 91: Latin America Probe Card Market Revenue (Million), by Technology 2024 & 2032
- Figure 92: Latin America Probe Card Market Volume (K Unit), by Technology 2024 & 2032
- Figure 93: Latin America Probe Card Market Revenue Share (%), by Technology 2024 & 2032
- Figure 94: Latin America Probe Card Market Volume Share (%), by Technology 2024 & 2032
- Figure 95: Latin America Probe Card Market Revenue (Million), by Application 2024 & 2032
- Figure 96: Latin America Probe Card Market Volume (K Unit), by Application 2024 & 2032
- Figure 97: Latin America Probe Card Market Revenue Share (%), by Application 2024 & 2032
- Figure 98: Latin America Probe Card Market Volume Share (%), by Application 2024 & 2032
- Figure 99: Latin America Probe Card Market Revenue (Million), by Type 2024 & 2032
- Figure 100: Latin America Probe Card Market Volume (K Unit), by Type 2024 & 2032
- Figure 101: Latin America Probe Card Market Revenue Share (%), by Type 2024 & 2032
- Figure 102: Latin America Probe Card Market Volume Share (%), by Type 2024 & 2032
- Figure 103: Latin America Probe Card Market Revenue (Million), by Country 2024 & 2032
- Figure 104: Latin America Probe Card Market Volume (K Unit), by Country 2024 & 2032
- Figure 105: Latin America Probe Card Market Revenue Share (%), by Country 2024 & 2032
- Figure 106: Latin America Probe Card Market Volume Share (%), by Country 2024 & 2032
- Figure 107: Middle East and Africa Probe Card Market Revenue (Million), by Technology 2024 & 2032
- Figure 108: Middle East and Africa Probe Card Market Volume (K Unit), by Technology 2024 & 2032
- Figure 109: Middle East and Africa Probe Card Market Revenue Share (%), by Technology 2024 & 2032
- Figure 110: Middle East and Africa Probe Card Market Volume Share (%), by Technology 2024 & 2032
- Figure 111: Middle East and Africa Probe Card Market Revenue (Million), by Application 2024 & 2032
- Figure 112: Middle East and Africa Probe Card Market Volume (K Unit), by Application 2024 & 2032
- Figure 113: Middle East and Africa Probe Card Market Revenue Share (%), by Application 2024 & 2032
- Figure 114: Middle East and Africa Probe Card Market Volume Share (%), by Application 2024 & 2032
- Figure 115: Middle East and Africa Probe Card Market Revenue (Million), by Type 2024 & 2032
- Figure 116: Middle East and Africa Probe Card Market Volume (K Unit), by Type 2024 & 2032
- Figure 117: Middle East and Africa Probe Card Market Revenue Share (%), by Type 2024 & 2032
- Figure 118: Middle East and Africa Probe Card Market Volume Share (%), by Type 2024 & 2032
- Figure 119: Middle East and Africa Probe Card Market Revenue (Million), by Country 2024 & 2032
- Figure 120: Middle East and Africa Probe Card Market Volume (K Unit), by Country 2024 & 2032
- Figure 121: Middle East and Africa Probe Card Market Revenue Share (%), by Country 2024 & 2032
- Figure 122: Middle East and Africa Probe Card Market Volume Share (%), by Country 2024 & 2032
List of Tables
- Table 1: Global Probe Card Market Revenue Million Forecast, by Region 2019 & 2032
- Table 2: Global Probe Card Market Volume K Unit Forecast, by Region 2019 & 2032
- Table 3: Global Probe Card Market Revenue Million Forecast, by Technology 2019 & 2032
- Table 4: Global Probe Card Market Volume K Unit Forecast, by Technology 2019 & 2032
- Table 5: Global Probe Card Market Revenue Million Forecast, by Application 2019 & 2032
- Table 6: Global Probe Card Market Volume K Unit Forecast, by Application 2019 & 2032
- Table 7: Global Probe Card Market Revenue Million Forecast, by Type 2019 & 2032
- Table 8: Global Probe Card Market Volume K Unit Forecast, by Type 2019 & 2032
- Table 9: Global Probe Card Market Revenue Million Forecast, by Region 2019 & 2032
- Table 10: Global Probe Card Market Volume K Unit Forecast, by Region 2019 & 2032
- Table 11: Global Probe Card Market Revenue Million Forecast, by Country 2019 & 2032
- Table 12: Global Probe Card Market Volume K Unit Forecast, by Country 2019 & 2032
- Table 13: United States Probe Card Market Revenue (Million) Forecast, by Application 2019 & 2032
- Table 14: United States Probe Card Market Volume (K Unit) Forecast, by Application 2019 & 2032
- Table 15: Canada Probe Card Market Revenue (Million) Forecast, by Application 2019 & 2032
- Table 16: Canada Probe Card Market Volume (K Unit) Forecast, by Application 2019 & 2032
- Table 17: Mexico Probe Card Market Revenue (Million) Forecast, by Application 2019 & 2032
- Table 18: Mexico Probe Card Market Volume (K Unit) Forecast, by Application 2019 & 2032
- Table 19: Global Probe Card Market Revenue Million Forecast, by Country 2019 & 2032
- Table 20: Global Probe Card Market Volume K Unit Forecast, by Country 2019 & 2032
- Table 21: Germany Probe Card Market Revenue (Million) Forecast, by Application 2019 & 2032
- Table 22: Germany Probe Card Market Volume (K Unit) Forecast, by Application 2019 & 2032
- Table 23: United Kingdom Probe Card Market Revenue (Million) Forecast, by Application 2019 & 2032
- Table 24: United Kingdom Probe Card Market Volume (K Unit) Forecast, by Application 2019 & 2032
- Table 25: France Probe Card Market Revenue (Million) Forecast, by Application 2019 & 2032
- Table 26: France Probe Card Market Volume (K Unit) Forecast, by Application 2019 & 2032
- Table 27: Spain Probe Card Market Revenue (Million) Forecast, by Application 2019 & 2032
- Table 28: Spain Probe Card Market Volume (K Unit) Forecast, by Application 2019 & 2032
- Table 29: Italy Probe Card Market Revenue (Million) Forecast, by Application 2019 & 2032
- Table 30: Italy Probe Card Market Volume (K Unit) Forecast, by Application 2019 & 2032
- Table 31: Spain Probe Card Market Revenue (Million) Forecast, by Application 2019 & 2032
- Table 32: Spain Probe Card Market Volume (K Unit) Forecast, by Application 2019 & 2032
- Table 33: Belgium Probe Card Market Revenue (Million) Forecast, by Application 2019 & 2032
- Table 34: Belgium Probe Card Market Volume (K Unit) Forecast, by Application 2019 & 2032
- Table 35: Netherland Probe Card Market Revenue (Million) Forecast, by Application 2019 & 2032
- Table 36: Netherland Probe Card Market Volume (K Unit) Forecast, by Application 2019 & 2032
- Table 37: Nordics Probe Card Market Revenue (Million) Forecast, by Application 2019 & 2032
- Table 38: Nordics Probe Card Market Volume (K Unit) Forecast, by Application 2019 & 2032
- Table 39: Rest of Europe Probe Card Market Revenue (Million) Forecast, by Application 2019 & 2032
- Table 40: Rest of Europe Probe Card Market Volume (K Unit) Forecast, by Application 2019 & 2032
- Table 41: Global Probe Card Market Revenue Million Forecast, by Country 2019 & 2032
- Table 42: Global Probe Card Market Volume K Unit Forecast, by Country 2019 & 2032
- Table 43: China Probe Card Market Revenue (Million) Forecast, by Application 2019 & 2032
- Table 44: China Probe Card Market Volume (K Unit) Forecast, by Application 2019 & 2032
- Table 45: Japan Probe Card Market Revenue (Million) Forecast, by Application 2019 & 2032
- Table 46: Japan Probe Card Market Volume (K Unit) Forecast, by Application 2019 & 2032
- Table 47: India Probe Card Market Revenue (Million) Forecast, by Application 2019 & 2032
- Table 48: India Probe Card Market Volume (K Unit) Forecast, by Application 2019 & 2032
- Table 49: South Korea Probe Card Market Revenue (Million) Forecast, by Application 2019 & 2032
- Table 50: South Korea Probe Card Market Volume (K Unit) Forecast, by Application 2019 & 2032
- Table 51: Southeast Asia Probe Card Market Revenue (Million) Forecast, by Application 2019 & 2032
- Table 52: Southeast Asia Probe Card Market Volume (K Unit) Forecast, by Application 2019 & 2032
- Table 53: Australia Probe Card Market Revenue (Million) Forecast, by Application 2019 & 2032
- Table 54: Australia Probe Card Market Volume (K Unit) Forecast, by Application 2019 & 2032
- Table 55: Indonesia Probe Card Market Revenue (Million) Forecast, by Application 2019 & 2032
- Table 56: Indonesia Probe Card Market Volume (K Unit) Forecast, by Application 2019 & 2032
- Table 57: Phillipes Probe Card Market Revenue (Million) Forecast, by Application 2019 & 2032
- Table 58: Phillipes Probe Card Market Volume (K Unit) Forecast, by Application 2019 & 2032
- Table 59: Singapore Probe Card Market Revenue (Million) Forecast, by Application 2019 & 2032
- Table 60: Singapore Probe Card Market Volume (K Unit) Forecast, by Application 2019 & 2032
- Table 61: Thailandc Probe Card Market Revenue (Million) Forecast, by Application 2019 & 2032
- Table 62: Thailandc Probe Card Market Volume (K Unit) Forecast, by Application 2019 & 2032
- Table 63: Rest of Asia Pacific Probe Card Market Revenue (Million) Forecast, by Application 2019 & 2032
- Table 64: Rest of Asia Pacific Probe Card Market Volume (K Unit) Forecast, by Application 2019 & 2032
- Table 65: Global Probe Card Market Revenue Million Forecast, by Country 2019 & 2032
- Table 66: Global Probe Card Market Volume K Unit Forecast, by Country 2019 & 2032
- Table 67: Brazil Probe Card Market Revenue (Million) Forecast, by Application 2019 & 2032
- Table 68: Brazil Probe Card Market Volume (K Unit) Forecast, by Application 2019 & 2032
- Table 69: Argentina Probe Card Market Revenue (Million) Forecast, by Application 2019 & 2032
- Table 70: Argentina Probe Card Market Volume (K Unit) Forecast, by Application 2019 & 2032
- Table 71: Peru Probe Card Market Revenue (Million) Forecast, by Application 2019 & 2032
- Table 72: Peru Probe Card Market Volume (K Unit) Forecast, by Application 2019 & 2032
- Table 73: Chile Probe Card Market Revenue (Million) Forecast, by Application 2019 & 2032
- Table 74: Chile Probe Card Market Volume (K Unit) Forecast, by Application 2019 & 2032
- Table 75: Colombia Probe Card Market Revenue (Million) Forecast, by Application 2019 & 2032
- Table 76: Colombia Probe Card Market Volume (K Unit) Forecast, by Application 2019 & 2032
- Table 77: Ecuador Probe Card Market Revenue (Million) Forecast, by Application 2019 & 2032
- Table 78: Ecuador Probe Card Market Volume (K Unit) Forecast, by Application 2019 & 2032
- Table 79: Venezuela Probe Card Market Revenue (Million) Forecast, by Application 2019 & 2032
- Table 80: Venezuela Probe Card Market Volume (K Unit) Forecast, by Application 2019 & 2032
- Table 81: Rest of South America Probe Card Market Revenue (Million) Forecast, by Application 2019 & 2032
- Table 82: Rest of South America Probe Card Market Volume (K Unit) Forecast, by Application 2019 & 2032
- Table 83: Global Probe Card Market Revenue Million Forecast, by Country 2019 & 2032
- Table 84: Global Probe Card Market Volume K Unit Forecast, by Country 2019 & 2032
- Table 85: United States Probe Card Market Revenue (Million) Forecast, by Application 2019 & 2032
- Table 86: United States Probe Card Market Volume (K Unit) Forecast, by Application 2019 & 2032
- Table 87: Canada Probe Card Market Revenue (Million) Forecast, by Application 2019 & 2032
- Table 88: Canada Probe Card Market Volume (K Unit) Forecast, by Application 2019 & 2032
- Table 89: Mexico Probe Card Market Revenue (Million) Forecast, by Application 2019 & 2032
- Table 90: Mexico Probe Card Market Volume (K Unit) Forecast, by Application 2019 & 2032
- Table 91: Global Probe Card Market Revenue Million Forecast, by Country 2019 & 2032
- Table 92: Global Probe Card Market Volume K Unit Forecast, by Country 2019 & 2032
- Table 93: United Arab Emirates Probe Card Market Revenue (Million) Forecast, by Application 2019 & 2032
- Table 94: United Arab Emirates Probe Card Market Volume (K Unit) Forecast, by Application 2019 & 2032
- Table 95: Saudi Arabia Probe Card Market Revenue (Million) Forecast, by Application 2019 & 2032
- Table 96: Saudi Arabia Probe Card Market Volume (K Unit) Forecast, by Application 2019 & 2032
- Table 97: South Africa Probe Card Market Revenue (Million) Forecast, by Application 2019 & 2032
- Table 98: South Africa Probe Card Market Volume (K Unit) Forecast, by Application 2019 & 2032
- Table 99: Rest of Middle East and Africa Probe Card Market Revenue (Million) Forecast, by Application 2019 & 2032
- Table 100: Rest of Middle East and Africa Probe Card Market Volume (K Unit) Forecast, by Application 2019 & 2032
- Table 101: Global Probe Card Market Revenue Million Forecast, by Technology 2019 & 2032
- Table 102: Global Probe Card Market Volume K Unit Forecast, by Technology 2019 & 2032
- Table 103: Global Probe Card Market Revenue Million Forecast, by Application 2019 & 2032
- Table 104: Global Probe Card Market Volume K Unit Forecast, by Application 2019 & 2032
- Table 105: Global Probe Card Market Revenue Million Forecast, by Type 2019 & 2032
- Table 106: Global Probe Card Market Volume K Unit Forecast, by Type 2019 & 2032
- Table 107: Global Probe Card Market Revenue Million Forecast, by Country 2019 & 2032
- Table 108: Global Probe Card Market Volume K Unit Forecast, by Country 2019 & 2032
- Table 109: Global Probe Card Market Revenue Million Forecast, by Technology 2019 & 2032
- Table 110: Global Probe Card Market Volume K Unit Forecast, by Technology 2019 & 2032
- Table 111: Global Probe Card Market Revenue Million Forecast, by Application 2019 & 2032
- Table 112: Global Probe Card Market Volume K Unit Forecast, by Application 2019 & 2032
- Table 113: Global Probe Card Market Revenue Million Forecast, by Type 2019 & 2032
- Table 114: Global Probe Card Market Volume K Unit Forecast, by Type 2019 & 2032
- Table 115: Global Probe Card Market Revenue Million Forecast, by Country 2019 & 2032
- Table 116: Global Probe Card Market Volume K Unit Forecast, by Country 2019 & 2032
- Table 117: Global Probe Card Market Revenue Million Forecast, by Technology 2019 & 2032
- Table 118: Global Probe Card Market Volume K Unit Forecast, by Technology 2019 & 2032
- Table 119: Global Probe Card Market Revenue Million Forecast, by Application 2019 & 2032
- Table 120: Global Probe Card Market Volume K Unit Forecast, by Application 2019 & 2032
- Table 121: Global Probe Card Market Revenue Million Forecast, by Type 2019 & 2032
- Table 122: Global Probe Card Market Volume K Unit Forecast, by Type 2019 & 2032
- Table 123: Global Probe Card Market Revenue Million Forecast, by Country 2019 & 2032
- Table 124: Global Probe Card Market Volume K Unit Forecast, by Country 2019 & 2032
- Table 125: Global Probe Card Market Revenue Million Forecast, by Technology 2019 & 2032
- Table 126: Global Probe Card Market Volume K Unit Forecast, by Technology 2019 & 2032
- Table 127: Global Probe Card Market Revenue Million Forecast, by Application 2019 & 2032
- Table 128: Global Probe Card Market Volume K Unit Forecast, by Application 2019 & 2032
- Table 129: Global Probe Card Market Revenue Million Forecast, by Type 2019 & 2032
- Table 130: Global Probe Card Market Volume K Unit Forecast, by Type 2019 & 2032
- Table 131: Global Probe Card Market Revenue Million Forecast, by Country 2019 & 2032
- Table 132: Global Probe Card Market Volume K Unit Forecast, by Country 2019 & 2032
- Table 133: Global Probe Card Market Revenue Million Forecast, by Technology 2019 & 2032
- Table 134: Global Probe Card Market Volume K Unit Forecast, by Technology 2019 & 2032
- Table 135: Global Probe Card Market Revenue Million Forecast, by Application 2019 & 2032
- Table 136: Global Probe Card Market Volume K Unit Forecast, by Application 2019 & 2032
- Table 137: Global Probe Card Market Revenue Million Forecast, by Type 2019 & 2032
- Table 138: Global Probe Card Market Volume K Unit Forecast, by Type 2019 & 2032
- Table 139: Global Probe Card Market Revenue Million Forecast, by Country 2019 & 2032
- Table 140: Global Probe Card Market Volume K Unit Forecast, by Country 2019 & 2032
- Table 141: Global Probe Card Market Revenue Million Forecast, by Technology 2019 & 2032
- Table 142: Global Probe Card Market Volume K Unit Forecast, by Technology 2019 & 2032
- Table 143: Global Probe Card Market Revenue Million Forecast, by Application 2019 & 2032
- Table 144: Global Probe Card Market Volume K Unit Forecast, by Application 2019 & 2032
- Table 145: Global Probe Card Market Revenue Million Forecast, by Type 2019 & 2032
- Table 146: Global Probe Card Market Volume K Unit Forecast, by Type 2019 & 2032
- Table 147: Global Probe Card Market Revenue Million Forecast, by Country 2019 & 2032
- Table 148: Global Probe Card Market Volume K Unit Forecast, by Country 2019 & 2032
Frequently Asked Questions
1. What is the projected Compound Annual Growth Rate (CAGR) of the Probe Card Market?
The projected CAGR is approximately 10.60%.
2. Which companies are prominent players in the Probe Card Market?
Key companies in the market include Nidec SV Probe, Protec Mems Technology, Willtechnology Co Ltd, Formfactor Inc, Wentworth Laboratories Inc, Japan Electronic Materials Corporation, Micronics Japan Co Ltd, TSE Co Lt, Feinmetall Gmbh, Star Technologies Inc, Technoprobe S P A, Mpi Corporation, GGB Industries Inc, Korea Instruments Co Ltd.
3. What are the main segments of the Probe Card Market?
The market segments include Technology, Application, Type.
4. Can you provide details about the market size?
The market size is estimated to be USD 2.05 Million as of 2022.
5. What are some drivers contributing to market growth?
Increase in Demand for Consumer Electronics and IOT; Miniaturization of Electronic Products; Technological Advancement And Innovations in Semiconductor Industry.
6. What are the notable trends driving market growth?
MEMS to Dominate the Technology Segment.
7. Are there any restraints impacting market growth?
High Costs Associated with Probe Cards; Lack of Awareness Among Consumers Regarding The Benefits of Probe Card Solution.
8. Can you provide examples of recent developments in the market?
April 2024 - FormFactor released a new presentation called COMPASS, focusing on maximizing CCC in a Probe Card and the journey toward an Unburnable Probe. The presentation explores different tactics for probe card design to enhance CCC to achieve an effective CCC above 2.5A at an 80-um minimum pitch. The strategies mentioned involve implementing new probe designs and architectural improvements to maintain probe integrity in high-stress, high-current conditions.
9. What pricing options are available for accessing the report?
Pricing options include single-user, multi-user, and enterprise licenses priced at USD 4750, USD 5250, and USD 8750 respectively.
10. Is the market size provided in terms of value or volume?
The market size is provided in terms of value, measured in Million and volume, measured in K Unit.
11. Are there any specific market keywords associated with the report?
Yes, the market keyword associated with the report is "Probe Card Market," which aids in identifying and referencing the specific market segment covered.
12. How do I determine which pricing option suits my needs best?
The pricing options vary based on user requirements and access needs. Individual users may opt for single-user licenses, while businesses requiring broader access may choose multi-user or enterprise licenses for cost-effective access to the report.
13. Are there any additional resources or data provided in the Probe Card Market report?
While the report offers comprehensive insights, it's advisable to review the specific contents or supplementary materials provided to ascertain if additional resources or data are available.
14. How can I stay updated on further developments or reports in the Probe Card Market?
To stay informed about further developments, trends, and reports in the Probe Card Market, consider subscribing to industry newsletters, following relevant companies and organizations, or regularly checking reputable industry news sources and publications.
Methodology
Step 1 - Identification of Relevant Samples Size from Population Database


Step 2 - Approaches for Defining Global Market Size (Value, Volume* & Price*)

Note*: In applicable scenarios
Step 3 - Data Sources
Primary Research
- Web Analytics
- Survey Reports
- Research Institute
- Latest Research Reports
- Opinion Leaders
Secondary Research
- Annual Reports
- White Paper
- Latest Press Release
- Industry Association
- Paid Database
- Investor Presentations

Step 4 - Data Triangulation
Involves using different sources of information in order to increase the validity of a study
These sources are likely to be stakeholders in a program - participants, other researchers, program staff, other community members, and so on.
Then we put all data in single framework & apply various statistical tools to find out the dynamic on the market.
During the analysis stage, feedback from the stakeholder groups would be compared to determine areas of agreement as well as areas of divergence


