
Key Insights
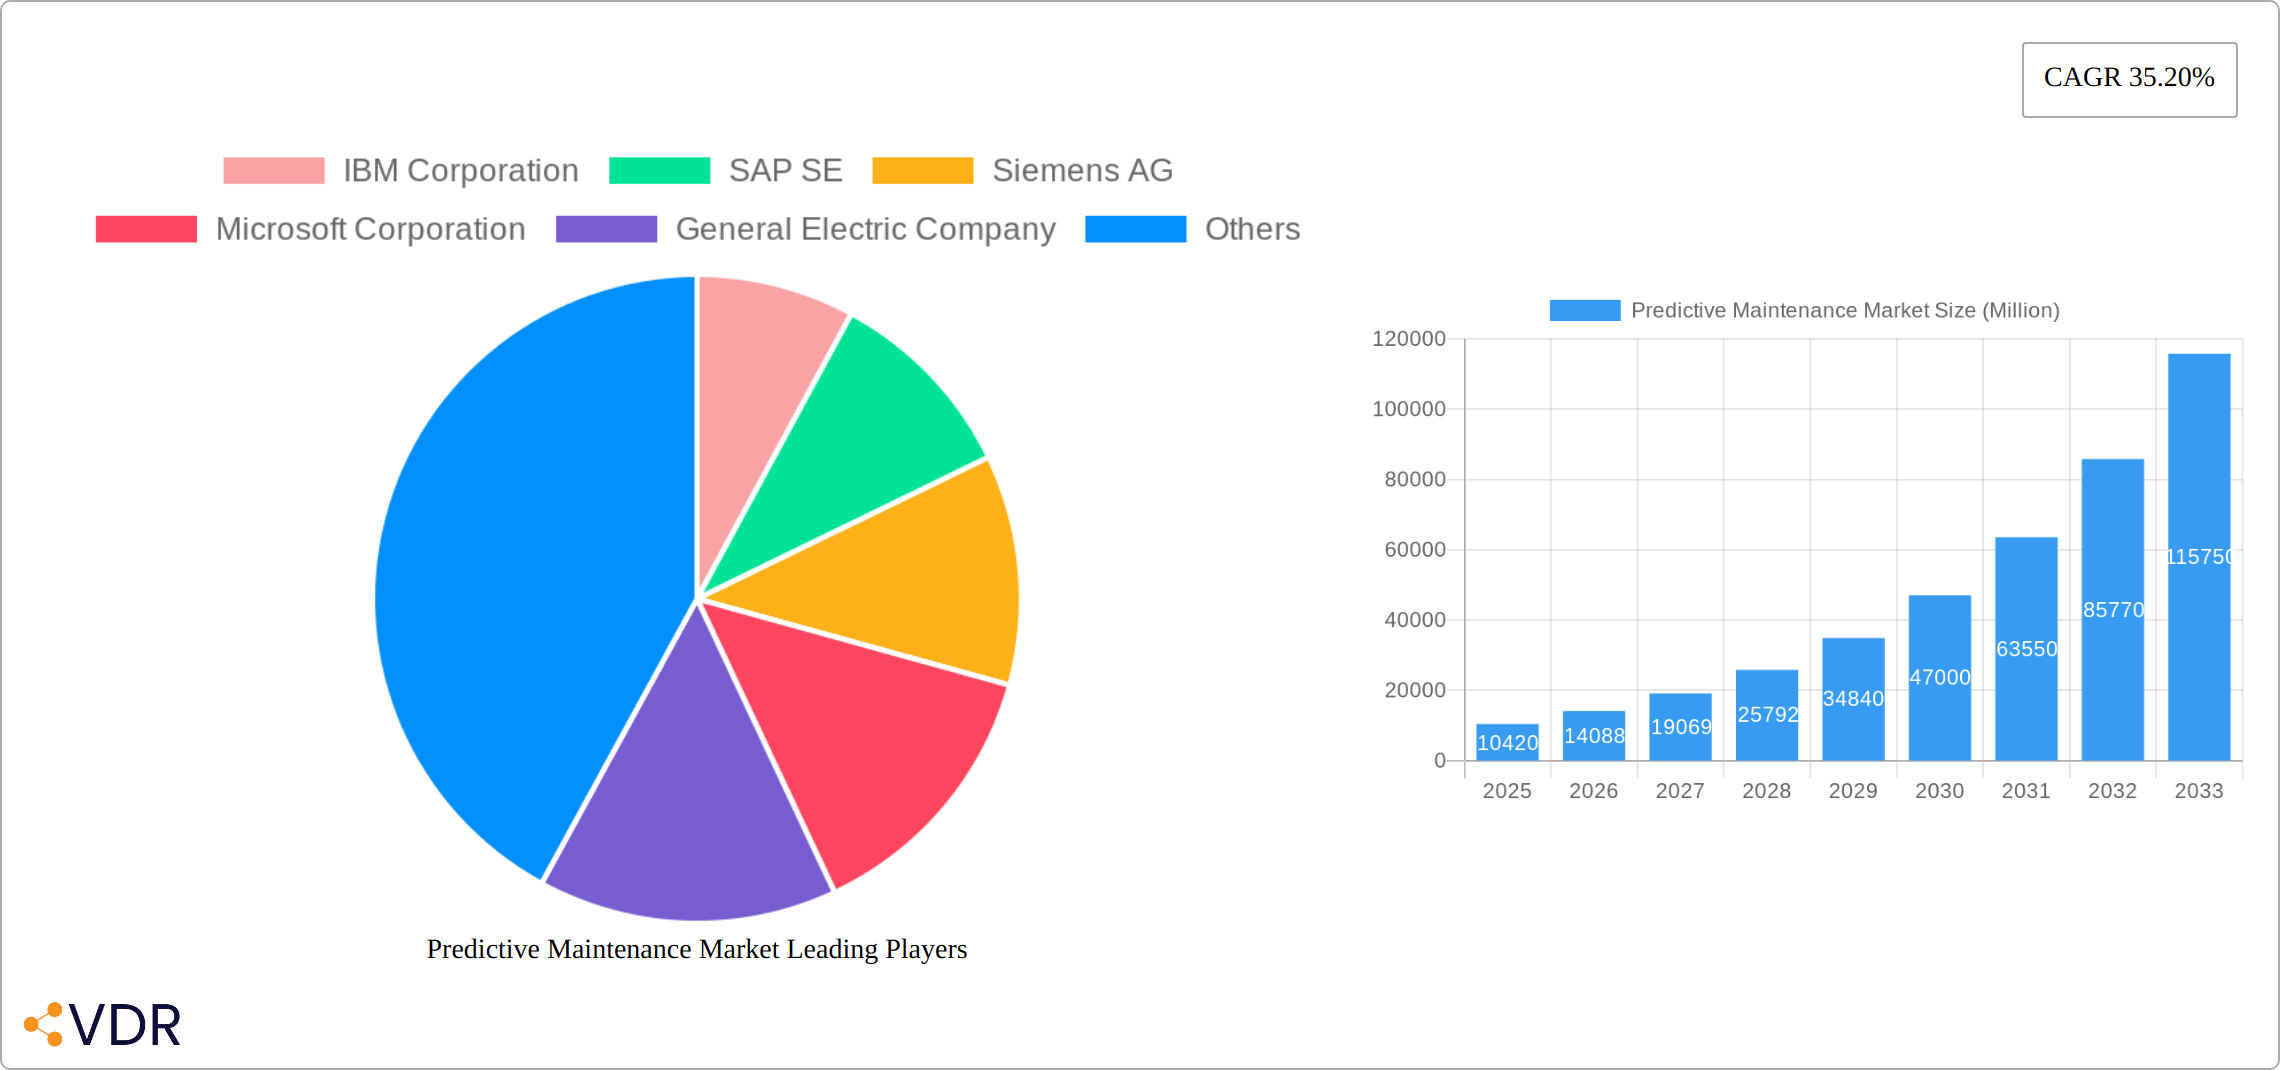
The Predictive Maintenance market is experiencing robust growth, projected to reach \$10.42 billion in 2025 and exhibiting a remarkable Compound Annual Growth Rate (CAGR) of 35.20% from 2025 to 2033. This expansion is driven by several key factors. The increasing adoption of Industry 4.0 technologies, including IoT sensors, big data analytics, and cloud computing, enables businesses to collect and analyze real-time equipment data, predicting potential failures before they occur. This proactive approach significantly reduces downtime, optimizes maintenance schedules, and lowers overall operational costs. Furthermore, the rising demand for enhanced operational efficiency across various industries, coupled with stringent regulatory compliance requirements, further fuels market growth. Leading players like IBM, SAP, Siemens, and Microsoft are investing heavily in developing advanced predictive maintenance solutions, fostering innovation and competition within the sector. This competitive landscape is pushing the boundaries of technological capabilities, resulting in more sophisticated and accessible predictive maintenance tools for businesses of all sizes.
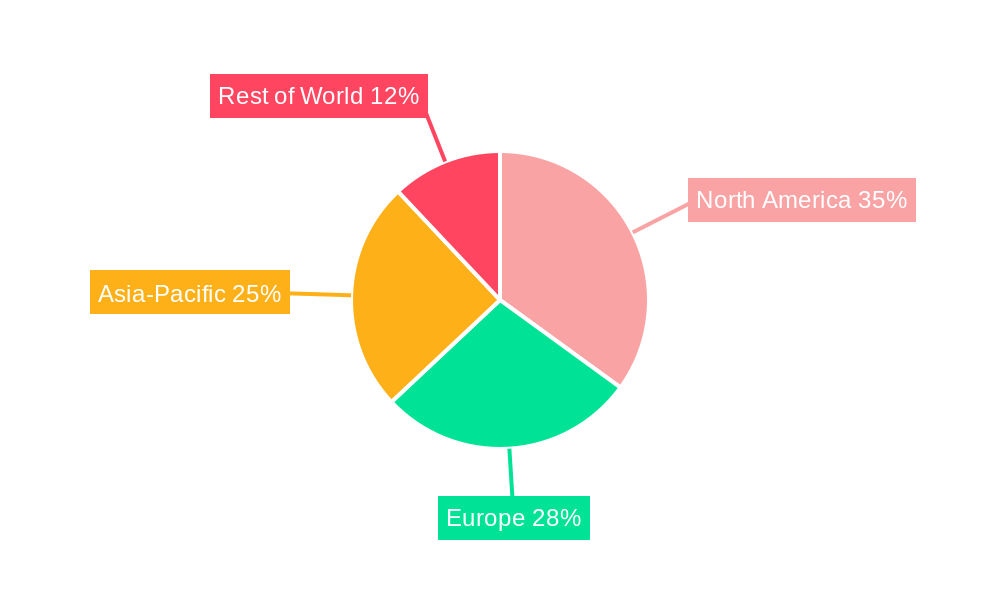
The market's segmentation, although not explicitly detailed, likely includes various industry verticals (manufacturing, energy, transportation, etc.), solution types (hardware, software, services), and deployment models (on-premise, cloud). The regional breakdown is also expected to show significant variations, with developed regions like North America and Europe leading in adoption due to their advanced technological infrastructure and higher industrial automation levels. However, emerging economies in Asia-Pacific and other regions are expected to witness significant growth, fueled by increasing industrialization and investment in digital transformation initiatives. The restraints to market growth could include initial high implementation costs, integration complexities, cybersecurity concerns related to data security, and the need for skilled professionals to effectively utilize and manage predictive maintenance systems. Despite these challenges, the long-term growth outlook for the predictive maintenance market remains exceptionally positive, driven by the compelling economic benefits and the ever-increasing need for optimized asset management.
Predictive Maintenance Market Report: 2019-2033
This comprehensive report provides a detailed analysis of the Predictive Maintenance Market, encompassing market dynamics, growth trends, regional segmentation, product landscape, key players, and future outlook. The study period covers 2019-2033, with 2025 as the base and estimated year. This report is invaluable for industry professionals, investors, and strategists seeking to understand and capitalize on the opportunities within this rapidly evolving sector. The parent market is Industrial Automation and the child market is Predictive Maintenance.
Predictive Maintenance Market Dynamics & Structure
The global Predictive Maintenance market, valued at xx Million in 2025, is characterized by a moderately concentrated landscape with several major players vying for market share. Technological innovation, particularly in artificial intelligence (AI) and machine learning (ML), is a key driver of market growth. Stringent regulatory frameworks concerning industrial safety and operational efficiency further fuel the adoption of predictive maintenance solutions. However, high initial investment costs and the need for specialized expertise can act as barriers to entry for some businesses. The market also faces competition from traditional maintenance strategies, though the advantages of predictive maintenance are increasingly evident. M&A activity in this space is relatively high, with a total of xx deals recorded between 2019-2024, indicating consolidation and expansion among key players.
- Market Concentration: Moderately concentrated, with top 5 players holding xx% market share in 2025.
- Technological Innovation: AI, ML, IoT, and big data analytics are key drivers.
- Regulatory Landscape: Stringent safety regulations and industry standards are pushing adoption.
- Competitive Substitutes: Traditional preventative and reactive maintenance strategies.
- End-User Demographics: Manufacturing, energy, transportation, and healthcare are key end-users.
- M&A Trends: Consolidation and expansion are leading to increased market concentration. xx M&A deals between 2019-2024.
Predictive Maintenance Market Growth Trends & Insights
The Predictive Maintenance market is experiencing robust growth, driven by the increasing adoption of Industry 4.0 technologies, a heightened focus on operational efficiency and uptime, and the realization of significant cost savings. We project a Compound Annual Growth Rate (CAGR) of [Insert Specific CAGR Percentage]% from 2025 to 2033, with market penetration rising from [Insert Current Penetration Percentage]% to [Insert Projected Penetration Percentage]% by 2033. This expansion is further accelerated by technological advancements, particularly the integration of generative AI and machine learning algorithms, enabling more accurate predictive models and proactive maintenance strategies. The market is expected to reach [Insert Projected Market Size in Millions] by 2033. A crucial factor contributing to this growth is the shift towards data-driven decision-making and proactive risk mitigation across various sectors.
Dominant Regions, Countries, or Segments in Predictive Maintenance Market
North America currently holds the largest market share, driven by robust technological advancements, a high concentration of industrial facilities, and early adoption of predictive maintenance solutions. However, Asia-Pacific is poised for significant growth, fueled by rapid industrialization, increasing digitalization, and government initiatives promoting smart manufacturing. Within segments, the manufacturing sector is the largest contributor, followed by the energy and transportation sectors.
- North America: High adoption rates, technological leadership, and strong regulatory support.
- Asia-Pacific: Rapid industrialization, increasing digitalization, and significant growth potential.
- Europe: Mature market with steady growth driven by regulatory compliance and industrial automation.
- Manufacturing Sector: Largest segment due to high asset intensity and need for optimal uptime.
Predictive Maintenance Market Product Landscape
The predictive maintenance product landscape is characterized by a diverse range of solutions, including software platforms, sensors, and analytics tools. These solutions offer unique selling propositions focused on data acquisition, advanced analytics, and user-friendly interfaces. Recent technological advancements include the integration of generative AI, which enhances the accuracy and efficiency of predictive maintenance models. These advancements enable real-time equipment monitoring and proactive identification of potential failures, leading to improved operational efficiency and reduced downtime.
Key Drivers, Barriers & Challenges in Predictive Maintenance Market
Key Drivers:
- Increasing adoption of IoT and big data analytics.
- Growing demand for operational efficiency and reduced downtime.
- Stringent government regulations promoting industrial safety.
- High return on investment potential.
Challenges:
- High initial investment costs.
- Lack of skilled workforce to implement and manage systems.
- Data security and privacy concerns.
- Integration challenges with legacy systems. The integration complexity impacts approximately xx% of implementations.
Emerging Opportunities in Predictive Maintenance Market
Significant untapped potential exists within the Predictive Maintenance market. Small and medium-sized enterprises (SMEs), often lacking the resources for comprehensive maintenance programs, represent a substantial area for growth. Developing economies also offer promising opportunities as industries modernize and embrace advanced technologies. The application of predictive maintenance is expanding into new sectors, including the crucial area of renewable energy infrastructure. AI-powered anomaly detection systems are becoming increasingly sophisticated, enabling earlier identification and mitigation of potential equipment failures. The overarching trend of consumers demanding more proactive and data-driven maintenance strategies further fuels market expansion.
Growth Accelerators in the Predictive Maintenance Market Industry
Technological breakthroughs in Artificial Intelligence (AI), Machine Learning (ML), and the Internet of Things (IoT) are fundamental drivers of market growth. These technologies enable more precise predictions and proactive maintenance interventions, minimizing downtime and optimizing operational efficiency. Strategic collaborations between technology providers and end-users are fostering innovation and streamlining market adoption. The development of tailored solutions to meet the specific requirements of various industries, coupled with the expansion into underserved markets, will continue to propel market expansion.
Key Players Shaping the Predictive Maintenance Market Market
- IBM Corporation
- SAP SE
- Siemens AG
- Microsoft Corporation
- General Electric Company
- Robert Bosch GmbH
- ABB Ltd
- Schneider Electric SE
- Honeywell International Inc
- Rockwell Automation
- Emerson
- List Not Exhaustive
Notable Milestones in Predictive Maintenance Market Sector
- June 2024: Hitachi and Microsoft announced a strategic partnership to leverage Generative AI for predictive maintenance, resulting in enhanced equipment monitoring and improved forecast accuracy. This partnership is expected to significantly impact the market by accelerating the adoption of AI-powered predictive maintenance solutions.
- February 2024: Siemens launched a generative AI feature in its Senseye Predictive Maintenance solution, improving the user experience and streamlining human-machine interaction. This innovation will further enhance the efficiency and effectiveness of predictive maintenance strategies.
In-Depth Predictive Maintenance Market Market Outlook
The future of the Predictive Maintenance market is characterized by sustained growth, driven by continuous technological advancements and the escalating demand for optimized operational efficiency. Strategic partnerships and collaborative efforts will play a pivotal role in shaping market dynamics. The incorporation of cutting-edge technologies, including generative AI, will result in the development of increasingly sophisticated and precise predictive models. This will ultimately lead to enhanced operational efficiency, substantial cost reductions, and improvements in overall safety across a wide range of industries. The expansion into new, untapped markets and the creation of customized solutions tailored to specific industry needs represent significant opportunities for growth and innovation.
Predictive Maintenance Market Segmentation
-
1. Component
- 1.1. Hardware
-
1.2. Software
- 1.2.1. Cloud
- 1.2.2. On-Premise
- 1.3. Services
-
2. Enterprise Size
- 2.1. Small and Medium Enterprises
- 2.2. Large Enterprises
-
3. End-user Industry
- 3.1. Healthcare
- 3.2. Automotive and Transportation
- 3.3. Industrial
- 3.4. Telecommunications
- 3.5. Energy and Utilities
- 3.6. Aerospace and Defense
- 3.7. Others
Predictive Maintenance Market Segmentation By Geography
- 1. North America
- 2. Europe
- 3. Asia
- 4. Australia and New Zealand
- 5. Middle East and Africa
- 6. Latin America
Predictive Maintenance Market REPORT HIGHLIGHTS
| Aspects | Details |
|---|---|
| Study Period | 2019-2033 |
| Base Year | 2024 |
| Estimated Year | 2025 |
| Forecast Period | 2025-2033 |
| Historical Period | 2019-2024 |
| Growth Rate | CAGR of 35.20% from 2019-2033 |
| Segmentation |
|
Table of Contents
- 1. Introduction
- 1.1. Research Scope
- 1.2. Market Segmentation
- 1.3. Research Methodology
- 1.4. Definitions and Assumptions
- 2. Executive Summary
- 2.1. Introduction
- 3. Market Dynamics
- 3.1. Introduction
- 3.2. Market Drivers
- 3.2.1. Advancement of Artificial Intelligence and Machine Learning; Rising Network Connectivity and Emerging New Network Technologies
- 3.3. Market Restrains
- 3.3.1. Advancement of Artificial Intelligence and Machine Learning; Rising Network Connectivity and Emerging New Network Technologies
- 3.4. Market Trends
- 3.4.1. Automotive and Transportation is Expected to Witness Remarkable Growth
- 4. Market Factor Analysis
- 4.1. Porters Five Forces
- 4.2. Supply/Value Chain
- 4.3. PESTEL analysis
- 4.4. Market Entropy
- 4.5. Patent/Trademark Analysis
- 5. Global Predictive Maintenance Market Analysis, Insights and Forecast, 2019-2031
- 5.1. Market Analysis, Insights and Forecast - by Component
- 5.1.1. Hardware
- 5.1.2. Software
- 5.1.2.1. Cloud
- 5.1.2.2. On-Premise
- 5.1.3. Services
- 5.2. Market Analysis, Insights and Forecast - by Enterprise Size
- 5.2.1. Small and Medium Enterprises
- 5.2.2. Large Enterprises
- 5.3. Market Analysis, Insights and Forecast - by End-user Industry
- 5.3.1. Healthcare
- 5.3.2. Automotive and Transportation
- 5.3.3. Industrial
- 5.3.4. Telecommunications
- 5.3.5. Energy and Utilities
- 5.3.6. Aerospace and Defense
- 5.3.7. Others
- 5.4. Market Analysis, Insights and Forecast - by Region
- 5.4.1. North America
- 5.4.2. Europe
- 5.4.3. Asia
- 5.4.4. Australia and New Zealand
- 5.4.5. Middle East and Africa
- 5.4.6. Latin America
- 5.1. Market Analysis, Insights and Forecast - by Component
- 6. North America Predictive Maintenance Market Analysis, Insights and Forecast, 2019-2031
- 6.1. Market Analysis, Insights and Forecast - by Component
- 6.1.1. Hardware
- 6.1.2. Software
- 6.1.2.1. Cloud
- 6.1.2.2. On-Premise
- 6.1.3. Services
- 6.2. Market Analysis, Insights and Forecast - by Enterprise Size
- 6.2.1. Small and Medium Enterprises
- 6.2.2. Large Enterprises
- 6.3. Market Analysis, Insights and Forecast - by End-user Industry
- 6.3.1. Healthcare
- 6.3.2. Automotive and Transportation
- 6.3.3. Industrial
- 6.3.4. Telecommunications
- 6.3.5. Energy and Utilities
- 6.3.6. Aerospace and Defense
- 6.3.7. Others
- 6.1. Market Analysis, Insights and Forecast - by Component
- 7. Europe Predictive Maintenance Market Analysis, Insights and Forecast, 2019-2031
- 7.1. Market Analysis, Insights and Forecast - by Component
- 7.1.1. Hardware
- 7.1.2. Software
- 7.1.2.1. Cloud
- 7.1.2.2. On-Premise
- 7.1.3. Services
- 7.2. Market Analysis, Insights and Forecast - by Enterprise Size
- 7.2.1. Small and Medium Enterprises
- 7.2.2. Large Enterprises
- 7.3. Market Analysis, Insights and Forecast - by End-user Industry
- 7.3.1. Healthcare
- 7.3.2. Automotive and Transportation
- 7.3.3. Industrial
- 7.3.4. Telecommunications
- 7.3.5. Energy and Utilities
- 7.3.6. Aerospace and Defense
- 7.3.7. Others
- 7.1. Market Analysis, Insights and Forecast - by Component
- 8. Asia Predictive Maintenance Market Analysis, Insights and Forecast, 2019-2031
- 8.1. Market Analysis, Insights and Forecast - by Component
- 8.1.1. Hardware
- 8.1.2. Software
- 8.1.2.1. Cloud
- 8.1.2.2. On-Premise
- 8.1.3. Services
- 8.2. Market Analysis, Insights and Forecast - by Enterprise Size
- 8.2.1. Small and Medium Enterprises
- 8.2.2. Large Enterprises
- 8.3. Market Analysis, Insights and Forecast - by End-user Industry
- 8.3.1. Healthcare
- 8.3.2. Automotive and Transportation
- 8.3.3. Industrial
- 8.3.4. Telecommunications
- 8.3.5. Energy and Utilities
- 8.3.6. Aerospace and Defense
- 8.3.7. Others
- 8.1. Market Analysis, Insights and Forecast - by Component
- 9. Australia and New Zealand Predictive Maintenance Market Analysis, Insights and Forecast, 2019-2031
- 9.1. Market Analysis, Insights and Forecast - by Component
- 9.1.1. Hardware
- 9.1.2. Software
- 9.1.2.1. Cloud
- 9.1.2.2. On-Premise
- 9.1.3. Services
- 9.2. Market Analysis, Insights and Forecast - by Enterprise Size
- 9.2.1. Small and Medium Enterprises
- 9.2.2. Large Enterprises
- 9.3. Market Analysis, Insights and Forecast - by End-user Industry
- 9.3.1. Healthcare
- 9.3.2. Automotive and Transportation
- 9.3.3. Industrial
- 9.3.4. Telecommunications
- 9.3.5. Energy and Utilities
- 9.3.6. Aerospace and Defense
- 9.3.7. Others
- 9.1. Market Analysis, Insights and Forecast - by Component
- 10. Middle East and Africa Predictive Maintenance Market Analysis, Insights and Forecast, 2019-2031
- 10.1. Market Analysis, Insights and Forecast - by Component
- 10.1.1. Hardware
- 10.1.2. Software
- 10.1.2.1. Cloud
- 10.1.2.2. On-Premise
- 10.1.3. Services
- 10.2. Market Analysis, Insights and Forecast - by Enterprise Size
- 10.2.1. Small and Medium Enterprises
- 10.2.2. Large Enterprises
- 10.3. Market Analysis, Insights and Forecast - by End-user Industry
- 10.3.1. Healthcare
- 10.3.2. Automotive and Transportation
- 10.3.3. Industrial
- 10.3.4. Telecommunications
- 10.3.5. Energy and Utilities
- 10.3.6. Aerospace and Defense
- 10.3.7. Others
- 10.1. Market Analysis, Insights and Forecast - by Component
- 11. Latin America Predictive Maintenance Market Analysis, Insights and Forecast, 2019-2031
- 11.1. Market Analysis, Insights and Forecast - by Component
- 11.1.1. Hardware
- 11.1.2. Software
- 11.1.2.1. Cloud
- 11.1.2.2. On-Premise
- 11.1.3. Services
- 11.2. Market Analysis, Insights and Forecast - by Enterprise Size
- 11.2.1. Small and Medium Enterprises
- 11.2.2. Large Enterprises
- 11.3. Market Analysis, Insights and Forecast - by End-user Industry
- 11.3.1. Healthcare
- 11.3.2. Automotive and Transportation
- 11.3.3. Industrial
- 11.3.4. Telecommunications
- 11.3.5. Energy and Utilities
- 11.3.6. Aerospace and Defense
- 11.3.7. Others
- 11.1. Market Analysis, Insights and Forecast - by Component
- 12. Competitive Analysis
- 12.1. Global Market Share Analysis 2024
- 12.2. Company Profiles
- 12.2.1 IBM Corporation
- 12.2.1.1. Overview
- 12.2.1.2. Products
- 12.2.1.3. SWOT Analysis
- 12.2.1.4. Recent Developments
- 12.2.1.5. Financials (Based on Availability)
- 12.2.2 SAP SE
- 12.2.2.1. Overview
- 12.2.2.2. Products
- 12.2.2.3. SWOT Analysis
- 12.2.2.4. Recent Developments
- 12.2.2.5. Financials (Based on Availability)
- 12.2.3 Siemens AG
- 12.2.3.1. Overview
- 12.2.3.2. Products
- 12.2.3.3. SWOT Analysis
- 12.2.3.4. Recent Developments
- 12.2.3.5. Financials (Based on Availability)
- 12.2.4 Microsoft Corporation
- 12.2.4.1. Overview
- 12.2.4.2. Products
- 12.2.4.3. SWOT Analysis
- 12.2.4.4. Recent Developments
- 12.2.4.5. Financials (Based on Availability)
- 12.2.5 General Electric Company
- 12.2.5.1. Overview
- 12.2.5.2. Products
- 12.2.5.3. SWOT Analysis
- 12.2.5.4. Recent Developments
- 12.2.5.5. Financials (Based on Availability)
- 12.2.6 Robert Bosch GmbH
- 12.2.6.1. Overview
- 12.2.6.2. Products
- 12.2.6.3. SWOT Analysis
- 12.2.6.4. Recent Developments
- 12.2.6.5. Financials (Based on Availability)
- 12.2.7 ABB Ltd
- 12.2.7.1. Overview
- 12.2.7.2. Products
- 12.2.7.3. SWOT Analysis
- 12.2.7.4. Recent Developments
- 12.2.7.5. Financials (Based on Availability)
- 12.2.8 Schneider Electric SE
- 12.2.8.1. Overview
- 12.2.8.2. Products
- 12.2.8.3. SWOT Analysis
- 12.2.8.4. Recent Developments
- 12.2.8.5. Financials (Based on Availability)
- 12.2.9 Honeywell International Inc
- 12.2.9.1. Overview
- 12.2.9.2. Products
- 12.2.9.3. SWOT Analysis
- 12.2.9.4. Recent Developments
- 12.2.9.5. Financials (Based on Availability)
- 12.2.10 Rockwell Automation
- 12.2.10.1. Overview
- 12.2.10.2. Products
- 12.2.10.3. SWOT Analysis
- 12.2.10.4. Recent Developments
- 12.2.10.5. Financials (Based on Availability)
- 12.2.11 Emerson*List Not Exhaustive
- 12.2.11.1. Overview
- 12.2.11.2. Products
- 12.2.11.3. SWOT Analysis
- 12.2.11.4. Recent Developments
- 12.2.11.5. Financials (Based on Availability)
- 12.2.1 IBM Corporation
List of Figures
- Figure 1: Global Predictive Maintenance Market Revenue Breakdown (Million, %) by Region 2024 & 2032
- Figure 2: Global Predictive Maintenance Market Volume Breakdown (Billion, %) by Region 2024 & 2032
- Figure 3: North America Predictive Maintenance Market Revenue (Million), by Component 2024 & 2032
- Figure 4: North America Predictive Maintenance Market Volume (Billion), by Component 2024 & 2032
- Figure 5: North America Predictive Maintenance Market Revenue Share (%), by Component 2024 & 2032
- Figure 6: North America Predictive Maintenance Market Volume Share (%), by Component 2024 & 2032
- Figure 7: North America Predictive Maintenance Market Revenue (Million), by Enterprise Size 2024 & 2032
- Figure 8: North America Predictive Maintenance Market Volume (Billion), by Enterprise Size 2024 & 2032
- Figure 9: North America Predictive Maintenance Market Revenue Share (%), by Enterprise Size 2024 & 2032
- Figure 10: North America Predictive Maintenance Market Volume Share (%), by Enterprise Size 2024 & 2032
- Figure 11: North America Predictive Maintenance Market Revenue (Million), by End-user Industry 2024 & 2032
- Figure 12: North America Predictive Maintenance Market Volume (Billion), by End-user Industry 2024 & 2032
- Figure 13: North America Predictive Maintenance Market Revenue Share (%), by End-user Industry 2024 & 2032
- Figure 14: North America Predictive Maintenance Market Volume Share (%), by End-user Industry 2024 & 2032
- Figure 15: North America Predictive Maintenance Market Revenue (Million), by Country 2024 & 2032
- Figure 16: North America Predictive Maintenance Market Volume (Billion), by Country 2024 & 2032
- Figure 17: North America Predictive Maintenance Market Revenue Share (%), by Country 2024 & 2032
- Figure 18: North America Predictive Maintenance Market Volume Share (%), by Country 2024 & 2032
- Figure 19: Europe Predictive Maintenance Market Revenue (Million), by Component 2024 & 2032
- Figure 20: Europe Predictive Maintenance Market Volume (Billion), by Component 2024 & 2032
- Figure 21: Europe Predictive Maintenance Market Revenue Share (%), by Component 2024 & 2032
- Figure 22: Europe Predictive Maintenance Market Volume Share (%), by Component 2024 & 2032
- Figure 23: Europe Predictive Maintenance Market Revenue (Million), by Enterprise Size 2024 & 2032
- Figure 24: Europe Predictive Maintenance Market Volume (Billion), by Enterprise Size 2024 & 2032
- Figure 25: Europe Predictive Maintenance Market Revenue Share (%), by Enterprise Size 2024 & 2032
- Figure 26: Europe Predictive Maintenance Market Volume Share (%), by Enterprise Size 2024 & 2032
- Figure 27: Europe Predictive Maintenance Market Revenue (Million), by End-user Industry 2024 & 2032
- Figure 28: Europe Predictive Maintenance Market Volume (Billion), by End-user Industry 2024 & 2032
- Figure 29: Europe Predictive Maintenance Market Revenue Share (%), by End-user Industry 2024 & 2032
- Figure 30: Europe Predictive Maintenance Market Volume Share (%), by End-user Industry 2024 & 2032
- Figure 31: Europe Predictive Maintenance Market Revenue (Million), by Country 2024 & 2032
- Figure 32: Europe Predictive Maintenance Market Volume (Billion), by Country 2024 & 2032
- Figure 33: Europe Predictive Maintenance Market Revenue Share (%), by Country 2024 & 2032
- Figure 34: Europe Predictive Maintenance Market Volume Share (%), by Country 2024 & 2032
- Figure 35: Asia Predictive Maintenance Market Revenue (Million), by Component 2024 & 2032
- Figure 36: Asia Predictive Maintenance Market Volume (Billion), by Component 2024 & 2032
- Figure 37: Asia Predictive Maintenance Market Revenue Share (%), by Component 2024 & 2032
- Figure 38: Asia Predictive Maintenance Market Volume Share (%), by Component 2024 & 2032
- Figure 39: Asia Predictive Maintenance Market Revenue (Million), by Enterprise Size 2024 & 2032
- Figure 40: Asia Predictive Maintenance Market Volume (Billion), by Enterprise Size 2024 & 2032
- Figure 41: Asia Predictive Maintenance Market Revenue Share (%), by Enterprise Size 2024 & 2032
- Figure 42: Asia Predictive Maintenance Market Volume Share (%), by Enterprise Size 2024 & 2032
- Figure 43: Asia Predictive Maintenance Market Revenue (Million), by End-user Industry 2024 & 2032
- Figure 44: Asia Predictive Maintenance Market Volume (Billion), by End-user Industry 2024 & 2032
- Figure 45: Asia Predictive Maintenance Market Revenue Share (%), by End-user Industry 2024 & 2032
- Figure 46: Asia Predictive Maintenance Market Volume Share (%), by End-user Industry 2024 & 2032
- Figure 47: Asia Predictive Maintenance Market Revenue (Million), by Country 2024 & 2032
- Figure 48: Asia Predictive Maintenance Market Volume (Billion), by Country 2024 & 2032
- Figure 49: Asia Predictive Maintenance Market Revenue Share (%), by Country 2024 & 2032
- Figure 50: Asia Predictive Maintenance Market Volume Share (%), by Country 2024 & 2032
- Figure 51: Australia and New Zealand Predictive Maintenance Market Revenue (Million), by Component 2024 & 2032
- Figure 52: Australia and New Zealand Predictive Maintenance Market Volume (Billion), by Component 2024 & 2032
- Figure 53: Australia and New Zealand Predictive Maintenance Market Revenue Share (%), by Component 2024 & 2032
- Figure 54: Australia and New Zealand Predictive Maintenance Market Volume Share (%), by Component 2024 & 2032
- Figure 55: Australia and New Zealand Predictive Maintenance Market Revenue (Million), by Enterprise Size 2024 & 2032
- Figure 56: Australia and New Zealand Predictive Maintenance Market Volume (Billion), by Enterprise Size 2024 & 2032
- Figure 57: Australia and New Zealand Predictive Maintenance Market Revenue Share (%), by Enterprise Size 2024 & 2032
- Figure 58: Australia and New Zealand Predictive Maintenance Market Volume Share (%), by Enterprise Size 2024 & 2032
- Figure 59: Australia and New Zealand Predictive Maintenance Market Revenue (Million), by End-user Industry 2024 & 2032
- Figure 60: Australia and New Zealand Predictive Maintenance Market Volume (Billion), by End-user Industry 2024 & 2032
- Figure 61: Australia and New Zealand Predictive Maintenance Market Revenue Share (%), by End-user Industry 2024 & 2032
- Figure 62: Australia and New Zealand Predictive Maintenance Market Volume Share (%), by End-user Industry 2024 & 2032
- Figure 63: Australia and New Zealand Predictive Maintenance Market Revenue (Million), by Country 2024 & 2032
- Figure 64: Australia and New Zealand Predictive Maintenance Market Volume (Billion), by Country 2024 & 2032
- Figure 65: Australia and New Zealand Predictive Maintenance Market Revenue Share (%), by Country 2024 & 2032
- Figure 66: Australia and New Zealand Predictive Maintenance Market Volume Share (%), by Country 2024 & 2032
- Figure 67: Middle East and Africa Predictive Maintenance Market Revenue (Million), by Component 2024 & 2032
- Figure 68: Middle East and Africa Predictive Maintenance Market Volume (Billion), by Component 2024 & 2032
- Figure 69: Middle East and Africa Predictive Maintenance Market Revenue Share (%), by Component 2024 & 2032
- Figure 70: Middle East and Africa Predictive Maintenance Market Volume Share (%), by Component 2024 & 2032
- Figure 71: Middle East and Africa Predictive Maintenance Market Revenue (Million), by Enterprise Size 2024 & 2032
- Figure 72: Middle East and Africa Predictive Maintenance Market Volume (Billion), by Enterprise Size 2024 & 2032
- Figure 73: Middle East and Africa Predictive Maintenance Market Revenue Share (%), by Enterprise Size 2024 & 2032
- Figure 74: Middle East and Africa Predictive Maintenance Market Volume Share (%), by Enterprise Size 2024 & 2032
- Figure 75: Middle East and Africa Predictive Maintenance Market Revenue (Million), by End-user Industry 2024 & 2032
- Figure 76: Middle East and Africa Predictive Maintenance Market Volume (Billion), by End-user Industry 2024 & 2032
- Figure 77: Middle East and Africa Predictive Maintenance Market Revenue Share (%), by End-user Industry 2024 & 2032
- Figure 78: Middle East and Africa Predictive Maintenance Market Volume Share (%), by End-user Industry 2024 & 2032
- Figure 79: Middle East and Africa Predictive Maintenance Market Revenue (Million), by Country 2024 & 2032
- Figure 80: Middle East and Africa Predictive Maintenance Market Volume (Billion), by Country 2024 & 2032
- Figure 81: Middle East and Africa Predictive Maintenance Market Revenue Share (%), by Country 2024 & 2032
- Figure 82: Middle East and Africa Predictive Maintenance Market Volume Share (%), by Country 2024 & 2032
- Figure 83: Latin America Predictive Maintenance Market Revenue (Million), by Component 2024 & 2032
- Figure 84: Latin America Predictive Maintenance Market Volume (Billion), by Component 2024 & 2032
- Figure 85: Latin America Predictive Maintenance Market Revenue Share (%), by Component 2024 & 2032
- Figure 86: Latin America Predictive Maintenance Market Volume Share (%), by Component 2024 & 2032
- Figure 87: Latin America Predictive Maintenance Market Revenue (Million), by Enterprise Size 2024 & 2032
- Figure 88: Latin America Predictive Maintenance Market Volume (Billion), by Enterprise Size 2024 & 2032
- Figure 89: Latin America Predictive Maintenance Market Revenue Share (%), by Enterprise Size 2024 & 2032
- Figure 90: Latin America Predictive Maintenance Market Volume Share (%), by Enterprise Size 2024 & 2032
- Figure 91: Latin America Predictive Maintenance Market Revenue (Million), by End-user Industry 2024 & 2032
- Figure 92: Latin America Predictive Maintenance Market Volume (Billion), by End-user Industry 2024 & 2032
- Figure 93: Latin America Predictive Maintenance Market Revenue Share (%), by End-user Industry 2024 & 2032
- Figure 94: Latin America Predictive Maintenance Market Volume Share (%), by End-user Industry 2024 & 2032
- Figure 95: Latin America Predictive Maintenance Market Revenue (Million), by Country 2024 & 2032
- Figure 96: Latin America Predictive Maintenance Market Volume (Billion), by Country 2024 & 2032
- Figure 97: Latin America Predictive Maintenance Market Revenue Share (%), by Country 2024 & 2032
- Figure 98: Latin America Predictive Maintenance Market Volume Share (%), by Country 2024 & 2032
List of Tables
- Table 1: Global Predictive Maintenance Market Revenue Million Forecast, by Region 2019 & 2032
- Table 2: Global Predictive Maintenance Market Volume Billion Forecast, by Region 2019 & 2032
- Table 3: Global Predictive Maintenance Market Revenue Million Forecast, by Component 2019 & 2032
- Table 4: Global Predictive Maintenance Market Volume Billion Forecast, by Component 2019 & 2032
- Table 5: Global Predictive Maintenance Market Revenue Million Forecast, by Enterprise Size 2019 & 2032
- Table 6: Global Predictive Maintenance Market Volume Billion Forecast, by Enterprise Size 2019 & 2032
- Table 7: Global Predictive Maintenance Market Revenue Million Forecast, by End-user Industry 2019 & 2032
- Table 8: Global Predictive Maintenance Market Volume Billion Forecast, by End-user Industry 2019 & 2032
- Table 9: Global Predictive Maintenance Market Revenue Million Forecast, by Region 2019 & 2032
- Table 10: Global Predictive Maintenance Market Volume Billion Forecast, by Region 2019 & 2032
- Table 11: Global Predictive Maintenance Market Revenue Million Forecast, by Component 2019 & 2032
- Table 12: Global Predictive Maintenance Market Volume Billion Forecast, by Component 2019 & 2032
- Table 13: Global Predictive Maintenance Market Revenue Million Forecast, by Enterprise Size 2019 & 2032
- Table 14: Global Predictive Maintenance Market Volume Billion Forecast, by Enterprise Size 2019 & 2032
- Table 15: Global Predictive Maintenance Market Revenue Million Forecast, by End-user Industry 2019 & 2032
- Table 16: Global Predictive Maintenance Market Volume Billion Forecast, by End-user Industry 2019 & 2032
- Table 17: Global Predictive Maintenance Market Revenue Million Forecast, by Country 2019 & 2032
- Table 18: Global Predictive Maintenance Market Volume Billion Forecast, by Country 2019 & 2032
- Table 19: Global Predictive Maintenance Market Revenue Million Forecast, by Component 2019 & 2032
- Table 20: Global Predictive Maintenance Market Volume Billion Forecast, by Component 2019 & 2032
- Table 21: Global Predictive Maintenance Market Revenue Million Forecast, by Enterprise Size 2019 & 2032
- Table 22: Global Predictive Maintenance Market Volume Billion Forecast, by Enterprise Size 2019 & 2032
- Table 23: Global Predictive Maintenance Market Revenue Million Forecast, by End-user Industry 2019 & 2032
- Table 24: Global Predictive Maintenance Market Volume Billion Forecast, by End-user Industry 2019 & 2032
- Table 25: Global Predictive Maintenance Market Revenue Million Forecast, by Country 2019 & 2032
- Table 26: Global Predictive Maintenance Market Volume Billion Forecast, by Country 2019 & 2032
- Table 27: Global Predictive Maintenance Market Revenue Million Forecast, by Component 2019 & 2032
- Table 28: Global Predictive Maintenance Market Volume Billion Forecast, by Component 2019 & 2032
- Table 29: Global Predictive Maintenance Market Revenue Million Forecast, by Enterprise Size 2019 & 2032
- Table 30: Global Predictive Maintenance Market Volume Billion Forecast, by Enterprise Size 2019 & 2032
- Table 31: Global Predictive Maintenance Market Revenue Million Forecast, by End-user Industry 2019 & 2032
- Table 32: Global Predictive Maintenance Market Volume Billion Forecast, by End-user Industry 2019 & 2032
- Table 33: Global Predictive Maintenance Market Revenue Million Forecast, by Country 2019 & 2032
- Table 34: Global Predictive Maintenance Market Volume Billion Forecast, by Country 2019 & 2032
- Table 35: Global Predictive Maintenance Market Revenue Million Forecast, by Component 2019 & 2032
- Table 36: Global Predictive Maintenance Market Volume Billion Forecast, by Component 2019 & 2032
- Table 37: Global Predictive Maintenance Market Revenue Million Forecast, by Enterprise Size 2019 & 2032
- Table 38: Global Predictive Maintenance Market Volume Billion Forecast, by Enterprise Size 2019 & 2032
- Table 39: Global Predictive Maintenance Market Revenue Million Forecast, by End-user Industry 2019 & 2032
- Table 40: Global Predictive Maintenance Market Volume Billion Forecast, by End-user Industry 2019 & 2032
- Table 41: Global Predictive Maintenance Market Revenue Million Forecast, by Country 2019 & 2032
- Table 42: Global Predictive Maintenance Market Volume Billion Forecast, by Country 2019 & 2032
- Table 43: Global Predictive Maintenance Market Revenue Million Forecast, by Component 2019 & 2032
- Table 44: Global Predictive Maintenance Market Volume Billion Forecast, by Component 2019 & 2032
- Table 45: Global Predictive Maintenance Market Revenue Million Forecast, by Enterprise Size 2019 & 2032
- Table 46: Global Predictive Maintenance Market Volume Billion Forecast, by Enterprise Size 2019 & 2032
- Table 47: Global Predictive Maintenance Market Revenue Million Forecast, by End-user Industry 2019 & 2032
- Table 48: Global Predictive Maintenance Market Volume Billion Forecast, by End-user Industry 2019 & 2032
- Table 49: Global Predictive Maintenance Market Revenue Million Forecast, by Country 2019 & 2032
- Table 50: Global Predictive Maintenance Market Volume Billion Forecast, by Country 2019 & 2032
- Table 51: Global Predictive Maintenance Market Revenue Million Forecast, by Component 2019 & 2032
- Table 52: Global Predictive Maintenance Market Volume Billion Forecast, by Component 2019 & 2032
- Table 53: Global Predictive Maintenance Market Revenue Million Forecast, by Enterprise Size 2019 & 2032
- Table 54: Global Predictive Maintenance Market Volume Billion Forecast, by Enterprise Size 2019 & 2032
- Table 55: Global Predictive Maintenance Market Revenue Million Forecast, by End-user Industry 2019 & 2032
- Table 56: Global Predictive Maintenance Market Volume Billion Forecast, by End-user Industry 2019 & 2032
- Table 57: Global Predictive Maintenance Market Revenue Million Forecast, by Country 2019 & 2032
- Table 58: Global Predictive Maintenance Market Volume Billion Forecast, by Country 2019 & 2032
Frequently Asked Questions
1. What is the projected Compound Annual Growth Rate (CAGR) of the Predictive Maintenance Market?
The projected CAGR is approximately 35.20%.
2. Which companies are prominent players in the Predictive Maintenance Market?
Key companies in the market include IBM Corporation, SAP SE, Siemens AG, Microsoft Corporation, General Electric Company, Robert Bosch GmbH, ABB Ltd, Schneider Electric SE, Honeywell International Inc, Rockwell Automation, Emerson*List Not Exhaustive.
3. What are the main segments of the Predictive Maintenance Market?
The market segments include Component, Enterprise Size, End-user Industry.
4. Can you provide details about the market size?
The market size is estimated to be USD 10.42 Million as of 2022.
5. What are some drivers contributing to market growth?
Advancement of Artificial Intelligence and Machine Learning; Rising Network Connectivity and Emerging New Network Technologies.
6. What are the notable trends driving market growth?
Automotive and Transportation is Expected to Witness Remarkable Growth.
7. Are there any restraints impacting market growth?
Advancement of Artificial Intelligence and Machine Learning; Rising Network Connectivity and Emerging New Network Technologies.
8. Can you provide examples of recent developments in the market?
June 2024: Hitachi and Microsoft entered into a strategic partnership to propel business and social innovation through Generative AI. This three-year strategic alliance, projected to be worth several billion dollars, aims to craft pioneering industry solutions that yield transformative results for both businesses and society. In collaboration with Microsoft, Hitachi’s Generative AI Center*3 will harness tools like Copilot for Microsoft 365 and GitHub Copilot to boost operational efficiency and streamline application development within the Hitachi Group. Meanwhile, Hitachi Rail is leveraging GenAI for predictive maintenance, leading to enhanced equipment monitoring and improved forecast accuracy. Such a forward-thinking strategy not only averts breakdowns but also elevates service quality, curtails operating costs, and bolsters safety.February 2024: Siemens unveiled a new generative artificial intelligence (AI) feature in its predictive maintenance solution, Senseye Predictive Maintenance. This enhancement aims to make predictive maintenance more conversational and intuitive. With this generative AI upgrade, Siemens is set to accelerate and streamline human-machine interactions in predictive maintenance, building upon its established machine-learning capabilities.
9. What pricing options are available for accessing the report?
Pricing options include single-user, multi-user, and enterprise licenses priced at USD 4750, USD 5250, and USD 8750 respectively.
10. Is the market size provided in terms of value or volume?
The market size is provided in terms of value, measured in Million and volume, measured in Billion.
11. Are there any specific market keywords associated with the report?
Yes, the market keyword associated with the report is "Predictive Maintenance Market," which aids in identifying and referencing the specific market segment covered.
12. How do I determine which pricing option suits my needs best?
The pricing options vary based on user requirements and access needs. Individual users may opt for single-user licenses, while businesses requiring broader access may choose multi-user or enterprise licenses for cost-effective access to the report.
13. Are there any additional resources or data provided in the Predictive Maintenance Market report?
While the report offers comprehensive insights, it's advisable to review the specific contents or supplementary materials provided to ascertain if additional resources or data are available.
14. How can I stay updated on further developments or reports in the Predictive Maintenance Market?
To stay informed about further developments, trends, and reports in the Predictive Maintenance Market, consider subscribing to industry newsletters, following relevant companies and organizations, or regularly checking reputable industry news sources and publications.
Methodology
Step 1 - Identification of Relevant Samples Size from Population Database


Step 2 - Approaches for Defining Global Market Size (Value, Volume* & Price*)

Note*: In applicable scenarios
Step 3 - Data Sources
Primary Research
- Web Analytics
- Survey Reports
- Research Institute
- Latest Research Reports
- Opinion Leaders
Secondary Research
- Annual Reports
- White Paper
- Latest Press Release
- Industry Association
- Paid Database
- Investor Presentations

Step 4 - Data Triangulation
Involves using different sources of information in order to increase the validity of a study
These sources are likely to be stakeholders in a program - participants, other researchers, program staff, other community members, and so on.
Then we put all data in single framework & apply various statistical tools to find out the dynamic on the market.
During the analysis stage, feedback from the stakeholder groups would be compared to determine areas of agreement as well as areas of divergence


