
Key Insights
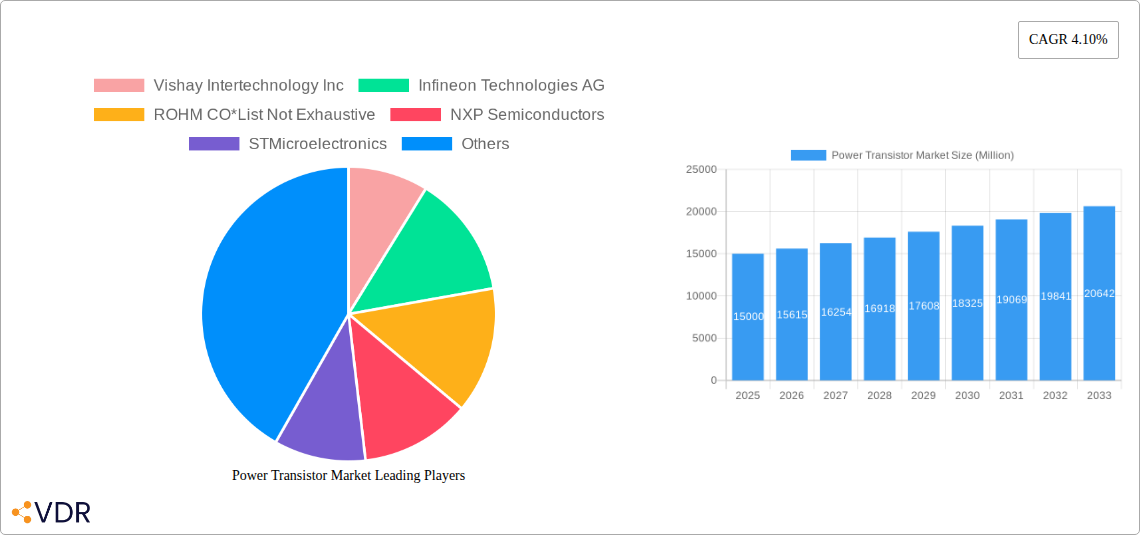
The global power transistor market, currently experiencing robust growth, is projected to reach a significant value in the coming years. Driven by the increasing demand for energy-efficient electronics across diverse sectors, this market is expected to maintain a healthy Compound Annual Growth Rate (CAGR) of 4.10% from 2025 to 2033. Several key factors fuel this expansion. The surging adoption of electric vehicles (EVs) and hybrid electric vehicles (HEVs) in the automotive sector significantly boosts demand for high-power transistors capable of handling the substantial power requirements of EV motors and onboard charging systems. Furthermore, advancements in renewable energy technologies, particularly solar and wind power, necessitate efficient power conversion and control systems, creating a strong demand for power transistors in energy and power applications. The expansion of 5G networks and the growing adoption of smart devices and IoT applications in consumer electronics and communication technologies further contribute to the market's growth trajectory. The market is segmented by type (Bipolar Junction Transistors (BJTs) and Field-Effect Transistors (FETs)) and end-user (Consumer Electronics, Communication & Technology, Automotive, Manufacturing, and Energy & Power). While BJTs retain a significant market share due to their established presence and cost-effectiveness in certain applications, FETs, particularly MOSFETs and IGBTs, are witnessing rapid growth due to their superior performance characteristics in high-power applications. The competitive landscape comprises major players such as Vishay Intertechnology, Infineon Technologies, ROHM, NXP Semiconductors, STMicroelectronics, and Texas Instruments, who are actively engaged in product innovation and strategic partnerships to capture market share.
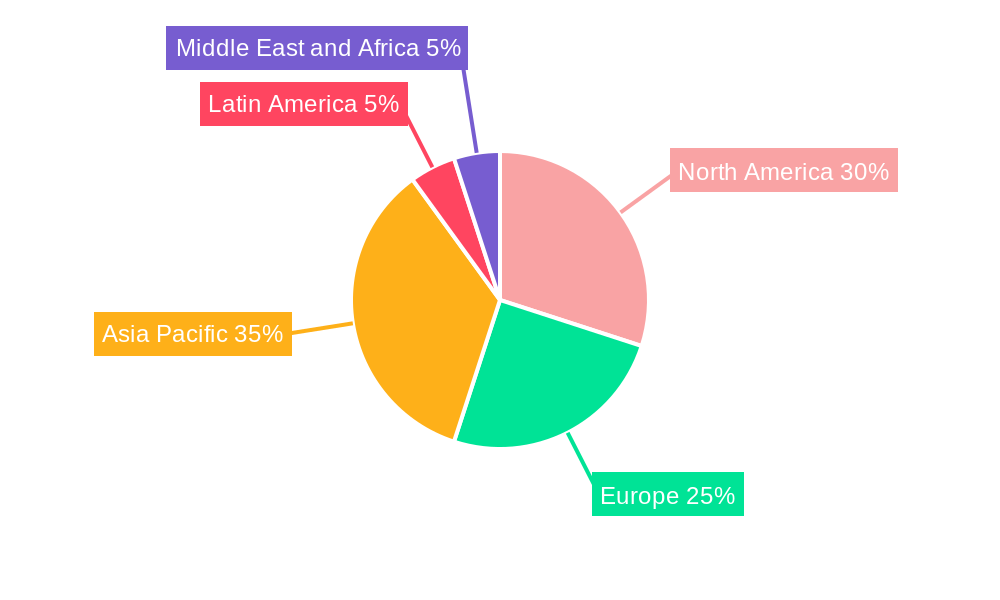
Geographical distribution shows a substantial concentration of market share in the Asia-Pacific region, driven by the rapid growth of electronics manufacturing and the increasing adoption of advanced technologies in this region. North America and Europe also hold significant market shares, primarily due to the strong presence of established manufacturers and a mature electronics market. However, emerging economies in Latin America and the Middle East and Africa are expected to exhibit substantial growth potential over the forecast period, fueled by rising disposable incomes and increasing investments in infrastructure development. Challenges include the increasing complexity and cost of high-power transistor designs, the need for improved thermal management solutions, and the ongoing push for miniaturization and higher power density. Nevertheless, continuous advancements in semiconductor technology and the development of innovative materials are expected to mitigate these challenges and further propel the growth of the power transistor market in the years to come. The market will likely see further consolidation among key players through mergers, acquisitions, and strategic collaborations.
Power Transistor Market: A Comprehensive Market Report (2019-2033)
This comprehensive report provides a detailed analysis of the Power Transistor Market, encompassing market dynamics, growth trends, regional segmentation, product landscape, key players, and future outlook. The study period covers 2019-2033, with 2025 serving as the base and estimated year. The report utilizes a robust methodology, incorporating both qualitative and quantitative data to offer actionable insights for industry professionals, investors, and strategists. The market is segmented by type (Bipolar Junction Transistor, Field Effect Transistor) and end-user (Consumer Electronics, Communication and Technology, Automotive, Manufacturing, Energy and Power). The total market size is projected to reach xx Million units by 2033.
Power Transistor Market Dynamics & Structure
The power transistor market is characterized by a moderately concentrated landscape, with key players like Vishay Intertechnology Inc, Infineon Technologies AG, ROHM CO., NXP Semiconductors, STMicroelectronics, Diodes Incorporated, Linear Systems, Renesas Electronics Corporation, Texas Instruments Incorporated, and Semiconductor Components Industries LLC holding significant market share. Market concentration is estimated at xx% in 2025.
- Technological Innovation: Continuous advancements in semiconductor technology, such as the development of wide-bandgap transistors (SiC and GaN), are driving market growth. These advancements lead to improved efficiency, higher power density, and better thermal management.
- Regulatory Landscape: Government regulations concerning energy efficiency and emission reduction are influencing the adoption of power transistors in various sectors.
- Competitive Substitutes: While power transistors dominate many applications, alternative technologies like integrated circuits (ICs) present some level of competition, particularly in specific niche applications.
- End-User Demographics: The increasing demand for power transistors across diverse end-user sectors, including automotive, consumer electronics, and renewable energy, significantly contributes to market expansion.
- M&A Trends: The past five years have witnessed xx M&A deals in the power transistor market, primarily driven by strategic acquisitions to expand product portfolios and market reach. These deals accounted for an approximate xx% increase in market share for the acquiring companies. Innovation barriers include high R&D costs and the complexity of manufacturing advanced power transistors.
Power Transistor Market Growth Trends & Insights
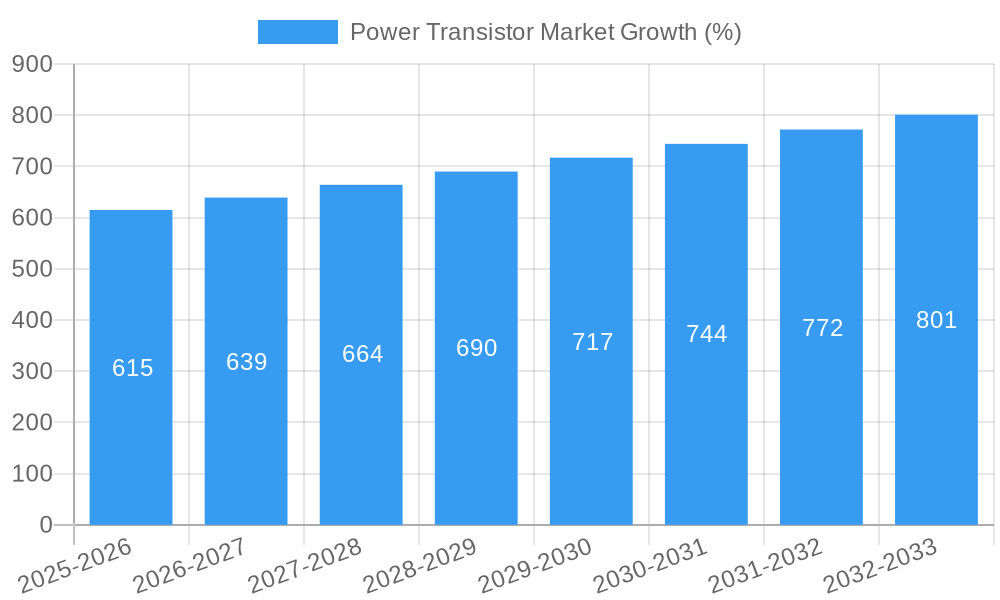
The power transistor market is experiencing robust growth, driven by several factors. The market size expanded from xx Million units in 2019 to xx Million units in 2024, exhibiting a CAGR of xx%. This growth is projected to continue, with a forecast CAGR of xx% from 2025 to 2033, reaching xx Million units by 2033. The increasing penetration of power electronics in various applications, coupled with technological advancements, is significantly fueling market expansion. Furthermore, evolving consumer preferences for energy-efficient devices and the growing adoption of electric vehicles (EVs) are creating lucrative opportunities for power transistor manufacturers. The shift towards renewable energy sources and smart grids is also stimulating demand.
Dominant Regions, Countries, or Segments in Power Transistor Market
The Asia-Pacific region currently holds the largest market share for power transistors, driven by rapid industrialization, growing consumer electronics demand, and robust automotive production. Within the Asia-Pacific region, China and Japan are prominent markets.
By Type:
- Field Effect Transistors (FETs): FETs are experiencing faster growth compared to BJTs, primarily due to their superior switching speeds and efficiency.
- Bipolar Junction Transistors (BJTs): BJTs maintain a significant market share due to their cost-effectiveness and suitability for specific applications.
By End-User:
- Automotive: The rising adoption of electric vehicles and hybrid electric vehicles (HEVs) is a key growth driver for the automotive segment. Advancements in automotive electronics are further fueling demand.
- Consumer Electronics: The increasing demand for portable electronic devices and smart home appliances is bolstering market growth in this segment.
- Renewable Energy: The growth of solar and wind energy industries is creating significant demand for high-power transistors used in power inverters and converters.
Power Transistor Market Product Landscape
Power transistor technology is continuously evolving, with innovations focused on increasing efficiency, reducing power loss, and improving switching speeds. Recent advancements include the development of wide-bandgap (WBG) transistors, such as silicon carbide (SiC) and gallium nitride (GaN) transistors, offering superior performance compared to traditional silicon-based transistors. These advancements lead to smaller, lighter, and more energy-efficient electronic systems. Unique selling propositions include higher power density, faster switching speeds, and improved thermal management capabilities.
Key Drivers, Barriers & Challenges in Power Transistor Market
Key Drivers:
- Increasing demand for energy-efficient electronic devices
- Growth of electric vehicles and renewable energy sectors
- Advancements in semiconductor technology
Key Challenges & Restraints:
- High manufacturing costs for advanced power transistors, especially wide-bandgap devices
- Supply chain disruptions impacting component availability
- Intense competition among manufacturers
Emerging Opportunities in Power Transistor Market
- Expansion into developing economies with rising energy demands.
- Development of next-generation power transistors with enhanced performance characteristics.
- Integration of power transistors into smart grids and Internet of Things (IoT) applications.
Growth Accelerators in the Power Transistor Market Industry
The long-term growth of the power transistor market is driven by strategic collaborations among manufacturers, focusing on technology licensing and joint development programs. The market expansion is further catalyzed by the introduction of innovative power transistor designs and the growing demand for high-efficiency power systems across numerous industries.
Key Players Shaping the Power Transistor Market Market
- Vishay Intertechnology Inc
- Infineon Technologies AG
- ROHM CO.
- NXP Semiconductors
- STMicroelectronics
- Diodes Incorporated
- Linear Systems
- Renesas Electronics Corporation
- Texas Instruments Incorporated
- Semiconductor Components Industries LLC
Notable Milestones in Power Transistor Market Sector
- December 2021: ROHM group announced a new production facility in Malaysia (RWEM) to increase analog LSI and transistor production capacity by approximately 1.5 times.
- January 2022: Harvard University researchers designed and simulated the first topological acoustic transistors.
In-Depth Power Transistor Market Market Outlook
The power transistor market exhibits significant future potential, driven by ongoing technological advancements and the increasing adoption of power electronics in diverse applications. Strategic partnerships, capacity expansions, and the exploration of new markets will play pivotal roles in shaping the market landscape. The market's continuous growth is poised to create lucrative opportunities for manufacturers, fostering innovation and driving further expansion in the coming years.
Power Transistor Market Segmentation
-
1. Types
- 1.1. Bipolar Junction Transistor
-
1.2. Field Effect Transistor
- 1.2.1. Metal ox
- 1.2.2. Junction Field-effect Transistor (JFET)
-
2. End-Users
- 2.1. Consumer Electronics
- 2.2. Communication and Technology
- 2.3. Automotive
- 2.4. Manufacturing
- 2.5. Energy and Power
Power Transistor Market Segmentation By Geography
- 1. North America
- 2. Europe
- 3. Asia Pacific
- 4. Latin America
- 5. Middle East and Africa
Power Transistor Market REPORT HIGHLIGHTS
| Aspects | Details |
|---|---|
| Study Period | 2019-2033 |
| Base Year | 2024 |
| Estimated Year | 2025 |
| Forecast Period | 2025-2033 |
| Historical Period | 2019-2024 |
| Growth Rate | CAGR of 4.10% from 2019-2033 |
| Segmentation |
|
Table of Contents
- 1. Introduction
- 1.1. Research Scope
- 1.2. Market Segmentation
- 1.3. Research Methodology
- 1.4. Definitions and Assumptions
- 2. Executive Summary
- 2.1. Introduction
- 3. Market Dynamics
- 3.1. Introduction
- 3.2. Market Drivers
- 3.2.1. Increase In Demand of Power Efficient Electronic Devices is Driving The Transistor Market to Grow; Proliferation of Consumer Electronics and Increased Use of Electronics in the Industrial Sector will Drive the Demand
- 3.3. Market Restrains
- 3.3.1. Scaling Down the Size of Transistors and Simultaneously maintaining High Performance is a Biggest Restraint for the Market
- 3.4. Market Trends
- 3.4.1. Proliferation of Consumer Electronics market and Increase in Use of Electronics in the Industrial Sector
- 4. Market Factor Analysis
- 4.1. Porters Five Forces
- 4.2. Supply/Value Chain
- 4.3. PESTEL analysis
- 4.4. Market Entropy
- 4.5. Patent/Trademark Analysis
- 5. Global Power Transistor Market Analysis, Insights and Forecast, 2019-2031
- 5.1. Market Analysis, Insights and Forecast - by Types
- 5.1.1. Bipolar Junction Transistor
- 5.1.2. Field Effect Transistor
- 5.1.2.1. Metal ox
- 5.1.2.2. Junction Field-effect Transistor (JFET)
- 5.2. Market Analysis, Insights and Forecast - by End-Users
- 5.2.1. Consumer Electronics
- 5.2.2. Communication and Technology
- 5.2.3. Automotive
- 5.2.4. Manufacturing
- 5.2.5. Energy and Power
- 5.3. Market Analysis, Insights and Forecast - by Region
- 5.3.1. North America
- 5.3.2. Europe
- 5.3.3. Asia Pacific
- 5.3.4. Latin America
- 5.3.5. Middle East and Africa
- 5.1. Market Analysis, Insights and Forecast - by Types
- 6. North America Power Transistor Market Analysis, Insights and Forecast, 2019-2031
- 6.1. Market Analysis, Insights and Forecast - by Types
- 6.1.1. Bipolar Junction Transistor
- 6.1.2. Field Effect Transistor
- 6.1.2.1. Metal ox
- 6.1.2.2. Junction Field-effect Transistor (JFET)
- 6.2. Market Analysis, Insights and Forecast - by End-Users
- 6.2.1. Consumer Electronics
- 6.2.2. Communication and Technology
- 6.2.3. Automotive
- 6.2.4. Manufacturing
- 6.2.5. Energy and Power
- 6.1. Market Analysis, Insights and Forecast - by Types
- 7. Europe Power Transistor Market Analysis, Insights and Forecast, 2019-2031
- 7.1. Market Analysis, Insights and Forecast - by Types
- 7.1.1. Bipolar Junction Transistor
- 7.1.2. Field Effect Transistor
- 7.1.2.1. Metal ox
- 7.1.2.2. Junction Field-effect Transistor (JFET)
- 7.2. Market Analysis, Insights and Forecast - by End-Users
- 7.2.1. Consumer Electronics
- 7.2.2. Communication and Technology
- 7.2.3. Automotive
- 7.2.4. Manufacturing
- 7.2.5. Energy and Power
- 7.1. Market Analysis, Insights and Forecast - by Types
- 8. Asia Pacific Power Transistor Market Analysis, Insights and Forecast, 2019-2031
- 8.1. Market Analysis, Insights and Forecast - by Types
- 8.1.1. Bipolar Junction Transistor
- 8.1.2. Field Effect Transistor
- 8.1.2.1. Metal ox
- 8.1.2.2. Junction Field-effect Transistor (JFET)
- 8.2. Market Analysis, Insights and Forecast - by End-Users
- 8.2.1. Consumer Electronics
- 8.2.2. Communication and Technology
- 8.2.3. Automotive
- 8.2.4. Manufacturing
- 8.2.5. Energy and Power
- 8.1. Market Analysis, Insights and Forecast - by Types
- 9. Latin America Power Transistor Market Analysis, Insights and Forecast, 2019-2031
- 9.1. Market Analysis, Insights and Forecast - by Types
- 9.1.1. Bipolar Junction Transistor
- 9.1.2. Field Effect Transistor
- 9.1.2.1. Metal ox
- 9.1.2.2. Junction Field-effect Transistor (JFET)
- 9.2. Market Analysis, Insights and Forecast - by End-Users
- 9.2.1. Consumer Electronics
- 9.2.2. Communication and Technology
- 9.2.3. Automotive
- 9.2.4. Manufacturing
- 9.2.5. Energy and Power
- 9.1. Market Analysis, Insights and Forecast - by Types
- 10. Middle East and Africa Power Transistor Market Analysis, Insights and Forecast, 2019-2031
- 10.1. Market Analysis, Insights and Forecast - by Types
- 10.1.1. Bipolar Junction Transistor
- 10.1.2. Field Effect Transistor
- 10.1.2.1. Metal ox
- 10.1.2.2. Junction Field-effect Transistor (JFET)
- 10.2. Market Analysis, Insights and Forecast - by End-Users
- 10.2.1. Consumer Electronics
- 10.2.2. Communication and Technology
- 10.2.3. Automotive
- 10.2.4. Manufacturing
- 10.2.5. Energy and Power
- 10.1. Market Analysis, Insights and Forecast - by Types
- 11. North America Power Transistor Market Analysis, Insights and Forecast, 2019-2031
- 11.1. Market Analysis, Insights and Forecast - By Country/Sub-region
- 11.1.1.
- 12. Europe Power Transistor Market Analysis, Insights and Forecast, 2019-2031
- 12.1. Market Analysis, Insights and Forecast - By Country/Sub-region
- 12.1.1.
- 13. Asia Pacific Power Transistor Market Analysis, Insights and Forecast, 2019-2031
- 13.1. Market Analysis, Insights and Forecast - By Country/Sub-region
- 13.1.1.
- 14. Latin America Power Transistor Market Analysis, Insights and Forecast, 2019-2031
- 14.1. Market Analysis, Insights and Forecast - By Country/Sub-region
- 14.1.1.
- 15. Middle East and Africa Power Transistor Market Analysis, Insights and Forecast, 2019-2031
- 15.1. Market Analysis, Insights and Forecast - By Country/Sub-region
- 15.1.1.
- 16. Competitive Analysis
- 16.1. Global Market Share Analysis 2024
- 16.2. Company Profiles
- 16.2.1 Vishay Intertechnology Inc
- 16.2.1.1. Overview
- 16.2.1.2. Products
- 16.2.1.3. SWOT Analysis
- 16.2.1.4. Recent Developments
- 16.2.1.5. Financials (Based on Availability)
- 16.2.2 Infineon Technologies AG
- 16.2.2.1. Overview
- 16.2.2.2. Products
- 16.2.2.3. SWOT Analysis
- 16.2.2.4. Recent Developments
- 16.2.2.5. Financials (Based on Availability)
- 16.2.3 ROHM CO*List Not Exhaustive
- 16.2.3.1. Overview
- 16.2.3.2. Products
- 16.2.3.3. SWOT Analysis
- 16.2.3.4. Recent Developments
- 16.2.3.5. Financials (Based on Availability)
- 16.2.4 NXP Semiconductors
- 16.2.4.1. Overview
- 16.2.4.2. Products
- 16.2.4.3. SWOT Analysis
- 16.2.4.4. Recent Developments
- 16.2.4.5. Financials (Based on Availability)
- 16.2.5 STMicroelectronics
- 16.2.5.1. Overview
- 16.2.5.2. Products
- 16.2.5.3. SWOT Analysis
- 16.2.5.4. Recent Developments
- 16.2.5.5. Financials (Based on Availability)
- 16.2.6 Diodes Incorporated
- 16.2.6.1. Overview
- 16.2.6.2. Products
- 16.2.6.3. SWOT Analysis
- 16.2.6.4. Recent Developments
- 16.2.6.5. Financials (Based on Availability)
- 16.2.7 Linear Systems
- 16.2.7.1. Overview
- 16.2.7.2. Products
- 16.2.7.3. SWOT Analysis
- 16.2.7.4. Recent Developments
- 16.2.7.5. Financials (Based on Availability)
- 16.2.8 Renesas Electronics Corporation
- 16.2.8.1. Overview
- 16.2.8.2. Products
- 16.2.8.3. SWOT Analysis
- 16.2.8.4. Recent Developments
- 16.2.8.5. Financials (Based on Availability)
- 16.2.9 Texas Instruments Incorporated
- 16.2.9.1. Overview
- 16.2.9.2. Products
- 16.2.9.3. SWOT Analysis
- 16.2.9.4. Recent Developments
- 16.2.9.5. Financials (Based on Availability)
- 16.2.10 Semiconductor Components Industries LLC
- 16.2.10.1. Overview
- 16.2.10.2. Products
- 16.2.10.3. SWOT Analysis
- 16.2.10.4. Recent Developments
- 16.2.10.5. Financials (Based on Availability)
- 16.2.1 Vishay Intertechnology Inc
List of Figures
- Figure 1: Global Power Transistor Market Revenue Breakdown (Million, %) by Region 2024 & 2032
- Figure 2: North America Power Transistor Market Revenue (Million), by Country 2024 & 2032
- Figure 3: North America Power Transistor Market Revenue Share (%), by Country 2024 & 2032
- Figure 4: Europe Power Transistor Market Revenue (Million), by Country 2024 & 2032
- Figure 5: Europe Power Transistor Market Revenue Share (%), by Country 2024 & 2032
- Figure 6: Asia Pacific Power Transistor Market Revenue (Million), by Country 2024 & 2032
- Figure 7: Asia Pacific Power Transistor Market Revenue Share (%), by Country 2024 & 2032
- Figure 8: Latin America Power Transistor Market Revenue (Million), by Country 2024 & 2032
- Figure 9: Latin America Power Transistor Market Revenue Share (%), by Country 2024 & 2032
- Figure 10: Middle East and Africa Power Transistor Market Revenue (Million), by Country 2024 & 2032
- Figure 11: Middle East and Africa Power Transistor Market Revenue Share (%), by Country 2024 & 2032
- Figure 12: North America Power Transistor Market Revenue (Million), by Types 2024 & 2032
- Figure 13: North America Power Transistor Market Revenue Share (%), by Types 2024 & 2032
- Figure 14: North America Power Transistor Market Revenue (Million), by End-Users 2024 & 2032
- Figure 15: North America Power Transistor Market Revenue Share (%), by End-Users 2024 & 2032
- Figure 16: North America Power Transistor Market Revenue (Million), by Country 2024 & 2032
- Figure 17: North America Power Transistor Market Revenue Share (%), by Country 2024 & 2032
- Figure 18: Europe Power Transistor Market Revenue (Million), by Types 2024 & 2032
- Figure 19: Europe Power Transistor Market Revenue Share (%), by Types 2024 & 2032
- Figure 20: Europe Power Transistor Market Revenue (Million), by End-Users 2024 & 2032
- Figure 21: Europe Power Transistor Market Revenue Share (%), by End-Users 2024 & 2032
- Figure 22: Europe Power Transistor Market Revenue (Million), by Country 2024 & 2032
- Figure 23: Europe Power Transistor Market Revenue Share (%), by Country 2024 & 2032
- Figure 24: Asia Pacific Power Transistor Market Revenue (Million), by Types 2024 & 2032
- Figure 25: Asia Pacific Power Transistor Market Revenue Share (%), by Types 2024 & 2032
- Figure 26: Asia Pacific Power Transistor Market Revenue (Million), by End-Users 2024 & 2032
- Figure 27: Asia Pacific Power Transistor Market Revenue Share (%), by End-Users 2024 & 2032
- Figure 28: Asia Pacific Power Transistor Market Revenue (Million), by Country 2024 & 2032
- Figure 29: Asia Pacific Power Transistor Market Revenue Share (%), by Country 2024 & 2032
- Figure 30: Latin America Power Transistor Market Revenue (Million), by Types 2024 & 2032
- Figure 31: Latin America Power Transistor Market Revenue Share (%), by Types 2024 & 2032
- Figure 32: Latin America Power Transistor Market Revenue (Million), by End-Users 2024 & 2032
- Figure 33: Latin America Power Transistor Market Revenue Share (%), by End-Users 2024 & 2032
- Figure 34: Latin America Power Transistor Market Revenue (Million), by Country 2024 & 2032
- Figure 35: Latin America Power Transistor Market Revenue Share (%), by Country 2024 & 2032
- Figure 36: Middle East and Africa Power Transistor Market Revenue (Million), by Types 2024 & 2032
- Figure 37: Middle East and Africa Power Transistor Market Revenue Share (%), by Types 2024 & 2032
- Figure 38: Middle East and Africa Power Transistor Market Revenue (Million), by End-Users 2024 & 2032
- Figure 39: Middle East and Africa Power Transistor Market Revenue Share (%), by End-Users 2024 & 2032
- Figure 40: Middle East and Africa Power Transistor Market Revenue (Million), by Country 2024 & 2032
- Figure 41: Middle East and Africa Power Transistor Market Revenue Share (%), by Country 2024 & 2032
List of Tables
- Table 1: Global Power Transistor Market Revenue Million Forecast, by Region 2019 & 2032
- Table 2: Global Power Transistor Market Revenue Million Forecast, by Types 2019 & 2032
- Table 3: Global Power Transistor Market Revenue Million Forecast, by End-Users 2019 & 2032
- Table 4: Global Power Transistor Market Revenue Million Forecast, by Region 2019 & 2032
- Table 5: Global Power Transistor Market Revenue Million Forecast, by Country 2019 & 2032
- Table 6: Power Transistor Market Revenue (Million) Forecast, by Application 2019 & 2032
- Table 7: Global Power Transistor Market Revenue Million Forecast, by Country 2019 & 2032
- Table 8: Power Transistor Market Revenue (Million) Forecast, by Application 2019 & 2032
- Table 9: Global Power Transistor Market Revenue Million Forecast, by Country 2019 & 2032
- Table 10: Power Transistor Market Revenue (Million) Forecast, by Application 2019 & 2032
- Table 11: Global Power Transistor Market Revenue Million Forecast, by Country 2019 & 2032
- Table 12: Power Transistor Market Revenue (Million) Forecast, by Application 2019 & 2032
- Table 13: Global Power Transistor Market Revenue Million Forecast, by Country 2019 & 2032
- Table 14: Power Transistor Market Revenue (Million) Forecast, by Application 2019 & 2032
- Table 15: Global Power Transistor Market Revenue Million Forecast, by Types 2019 & 2032
- Table 16: Global Power Transistor Market Revenue Million Forecast, by End-Users 2019 & 2032
- Table 17: Global Power Transistor Market Revenue Million Forecast, by Country 2019 & 2032
- Table 18: Global Power Transistor Market Revenue Million Forecast, by Types 2019 & 2032
- Table 19: Global Power Transistor Market Revenue Million Forecast, by End-Users 2019 & 2032
- Table 20: Global Power Transistor Market Revenue Million Forecast, by Country 2019 & 2032
- Table 21: Global Power Transistor Market Revenue Million Forecast, by Types 2019 & 2032
- Table 22: Global Power Transistor Market Revenue Million Forecast, by End-Users 2019 & 2032
- Table 23: Global Power Transistor Market Revenue Million Forecast, by Country 2019 & 2032
- Table 24: Global Power Transistor Market Revenue Million Forecast, by Types 2019 & 2032
- Table 25: Global Power Transistor Market Revenue Million Forecast, by End-Users 2019 & 2032
- Table 26: Global Power Transistor Market Revenue Million Forecast, by Country 2019 & 2032
- Table 27: Global Power Transistor Market Revenue Million Forecast, by Types 2019 & 2032
- Table 28: Global Power Transistor Market Revenue Million Forecast, by End-Users 2019 & 2032
- Table 29: Global Power Transistor Market Revenue Million Forecast, by Country 2019 & 2032
Frequently Asked Questions
1. What is the projected Compound Annual Growth Rate (CAGR) of the Power Transistor Market?
The projected CAGR is approximately 4.10%.
2. Which companies are prominent players in the Power Transistor Market?
Key companies in the market include Vishay Intertechnology Inc, Infineon Technologies AG, ROHM CO*List Not Exhaustive, NXP Semiconductors, STMicroelectronics, Diodes Incorporated, Linear Systems, Renesas Electronics Corporation, Texas Instruments Incorporated, Semiconductor Components Industries LLC.
3. What are the main segments of the Power Transistor Market?
The market segments include Types, End-Users.
4. Can you provide details about the market size?
The market size is estimated to be USD XX Million as of 2022.
5. What are some drivers contributing to market growth?
Increase In Demand of Power Efficient Electronic Devices is Driving The Transistor Market to Grow; Proliferation of Consumer Electronics and Increased Use of Electronics in the Industrial Sector will Drive the Demand.
6. What are the notable trends driving market growth?
Proliferation of Consumer Electronics market and Increase in Use of Electronics in the Industrial Sector.
7. Are there any restraints impacting market growth?
Scaling Down the Size of Transistors and Simultaneously maintaining High Performance is a Biggest Restraint for the Market.
8. Can you provide examples of recent developments in the market?
Dec 2021: ROHM group has announced a new production facility at its manufacturing subsidiary in Malaysia called RWEM to increase the production capacity of analog LSIs and transistors due to growing demands. The construction of the new building will increase the overall production capacity of RWEM by approximately 1.5 times.
9. What pricing options are available for accessing the report?
Pricing options include single-user, multi-user, and enterprise licenses priced at USD 4750, USD 5250, and USD 8750 respectively.
10. Is the market size provided in terms of value or volume?
The market size is provided in terms of value, measured in Million.
11. Are there any specific market keywords associated with the report?
Yes, the market keyword associated with the report is "Power Transistor Market," which aids in identifying and referencing the specific market segment covered.
12. How do I determine which pricing option suits my needs best?
The pricing options vary based on user requirements and access needs. Individual users may opt for single-user licenses, while businesses requiring broader access may choose multi-user or enterprise licenses for cost-effective access to the report.
13. Are there any additional resources or data provided in the Power Transistor Market report?
While the report offers comprehensive insights, it's advisable to review the specific contents or supplementary materials provided to ascertain if additional resources or data are available.
14. How can I stay updated on further developments or reports in the Power Transistor Market?
To stay informed about further developments, trends, and reports in the Power Transistor Market, consider subscribing to industry newsletters, following relevant companies and organizations, or regularly checking reputable industry news sources and publications.
Methodology
Step 1 - Identification of Relevant Samples Size from Population Database


Step 2 - Approaches for Defining Global Market Size (Value, Volume* & Price*)

Note*: In applicable scenarios
Step 3 - Data Sources
Primary Research
- Web Analytics
- Survey Reports
- Research Institute
- Latest Research Reports
- Opinion Leaders
Secondary Research
- Annual Reports
- White Paper
- Latest Press Release
- Industry Association
- Paid Database
- Investor Presentations

Step 4 - Data Triangulation
Involves using different sources of information in order to increase the validity of a study
These sources are likely to be stakeholders in a program - participants, other researchers, program staff, other community members, and so on.
Then we put all data in single framework & apply various statistical tools to find out the dynamic on the market.
During the analysis stage, feedback from the stakeholder groups would be compared to determine areas of agreement as well as areas of divergence


