
Key Insights
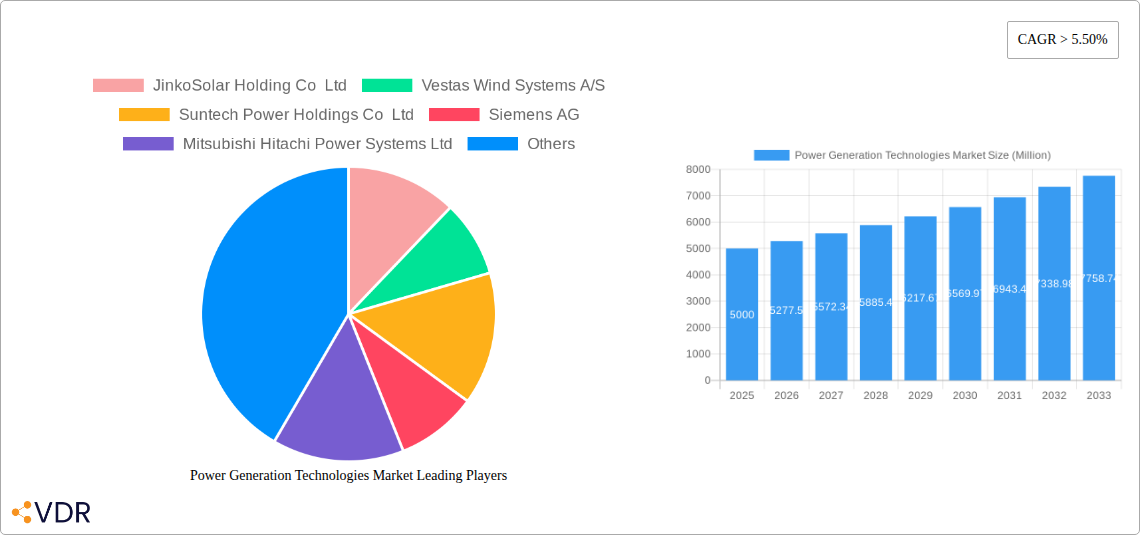
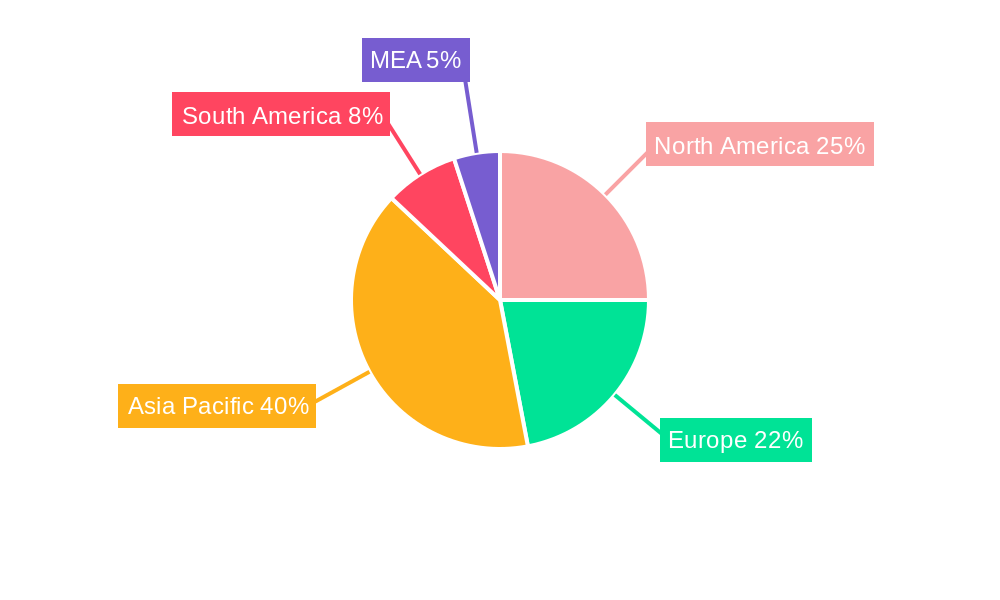
The Power Generation Technologies market is experiencing robust growth, projected to maintain a Compound Annual Growth Rate (CAGR) exceeding 5.50% from 2025 to 2033. This expansion is driven by several key factors. The increasing global energy demand, fueled by population growth and industrialization, necessitates a continuous expansion of power generation capacity. Furthermore, the urgent need to transition towards cleaner and more sustainable energy sources is significantly bolstering the adoption of renewable technologies like solar photovoltaic (PV) and wind turbines. Government initiatives promoting renewable energy through subsidies, tax incentives, and carbon emission reduction targets are further accelerating market growth. Technological advancements leading to improved efficiency, reduced costs, and enhanced reliability of renewable energy systems are also contributing factors. While the market faces some restraints, such as the intermittent nature of renewable energy sources and the high initial investment costs associated with some technologies, the long-term benefits of sustainability and energy independence are overriding these challenges. The market is segmented by technology type (steam turbine, gas turbine, hydro turbine, wind turbine, solar PV, and others), with renewable energy segments exhibiting particularly strong growth trajectories. Geographically, Asia Pacific, particularly China and India, is anticipated to dominate the market due to high energy demand and supportive government policies. North America and Europe also represent significant markets with robust growth potential driven by increasing environmental awareness and investments in clean energy infrastructure.
The competitive landscape is characterized by a mix of established players and emerging companies. Major players such as Siemens AG, General Electric Company, and Vestas Wind Systems A/S are leveraging their technological expertise and global reach to maintain market leadership. However, innovative smaller companies are also gaining traction by focusing on niche technologies and cost-effective solutions. The market's future will likely see increased mergers and acquisitions, strategic partnerships, and technological innovation, as companies strive to capitalize on the growing demand for sustainable and efficient power generation technologies. The forecast period of 2025-2033 presents substantial opportunities for market participants to expand their presence and capture market share within this dynamic and expanding sector. The continuing global focus on climate change mitigation will remain the primary driver for long-term market expansion.
Power Generation Technologies Market: A Comprehensive Report (2019-2033)
This comprehensive report provides an in-depth analysis of the Power Generation Technologies Market, encompassing its dynamics, growth trends, regional dominance, product landscape, and key players. With a study period spanning 2019-2033, a base year of 2025, and a forecast period of 2025-2033, this report offers invaluable insights for industry professionals, investors, and strategists seeking to navigate this dynamic sector. The market is segmented by type: Steam Turbine, Gas Turbine, Hydro Turbine, Wind Turbine, Solar Photovoltaic (PV), and Others. The report analyzes a parent market of Renewable Energy and a child market of Solar Power. The total market size in 2025 is estimated at XXX Million.
Power Generation Technologies Market Dynamics & Structure
The Power Generation Technologies market is characterized by moderate concentration, with a few major players holding significant market share. The market is driven by technological innovations, particularly in renewable energy sources like solar PV and wind power. Stringent environmental regulations globally are pushing a transition away from fossil fuels, creating a favorable environment for cleaner technologies. However, high initial investment costs and grid integration challenges act as barriers to entry. Competition from established players and emerging technologies necessitates continuous innovation and adaptation. M&A activity remains significant, with approximately xx deals recorded in the past 5 years, primarily focused on consolidating market share and expanding technological capabilities.
- Market Concentration: Moderately concentrated, with top 5 players holding approximately xx% market share in 2025.
- Technological Innovation Drivers: Advancements in solar PV efficiency, wind turbine design, and energy storage technologies.
- Regulatory Frameworks: Government incentives, carbon emission reduction targets, and renewable portfolio standards significantly influence market growth.
- Competitive Product Substitutes: Fossil fuel-based power generation remains a significant competitor, although its market share is declining.
- End-User Demographics: The market is driven by a combination of utilities, industrial consumers, and residential sectors.
- M&A Trends: Consolidation through acquisitions and mergers is a prominent trend, aiming for economies of scale and technological integration.
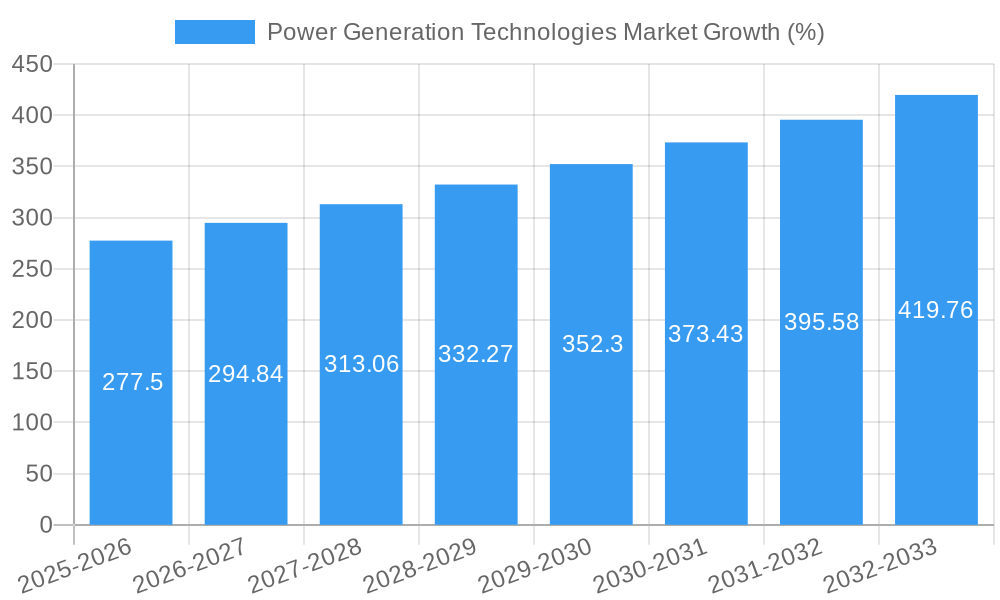
Power Generation Technologies Market Growth Trends & Insights
The Power Generation Technologies market is projected to experience substantial growth during the forecast period (2025-2033). The market size is estimated at XXX Million in 2025 and is expected to reach XXX Million by 2033, exhibiting a CAGR of xx%. This growth is fueled by several factors, including increasing global energy demand, rising environmental awareness, supportive government policies, and falling costs of renewable energy technologies. The adoption rate of renewable energy sources, particularly solar PV and wind power, is accelerating rapidly, driven by decreasing costs and technological advancements. Consumer behavior shifts towards sustainable energy solutions are further propelling market growth. Technological disruptions, such as the emergence of advanced energy storage systems, are enhancing the reliability and affordability of renewable energy sources.
Dominant Regions, Countries, or Segments in Power Generation Technologies Market
Asia-Pacific is the dominant region in the Power Generation Technologies market, accounting for approximately xx% of the global market share in 2025. This dominance is primarily attributed to China's substantial investments in renewable energy infrastructure and rapid economic growth. The strong government support for renewable energy development in many Asian countries, including India and Japan, also contributes to this regional dominance. Within the segment breakdown, Solar Photovoltaic (PV) is the fastest-growing segment globally, driven by continuously decreasing costs, increased efficiency, and government incentives.
- Key Drivers in Asia-Pacific:
- Massive investments in renewable energy infrastructure.
- Strong government support and favorable policies.
- Rapid economic growth and increasing energy demand.
- Solar PV Segment Dominance:
- Decreasing costs and improving efficiency.
- Government incentives and subsidies.
- Growing awareness of environmental sustainability.
Power Generation Technologies Market Product Landscape
The Power Generation Technologies market features a diverse range of products, encompassing various turbine types (steam, gas, hydro, wind), solar PV panels of differing technologies and efficiencies, and other emerging technologies like geothermal and tidal power. Significant advancements in materials science, energy storage, and control systems have improved efficiency, reliability, and performance across the product spectrum. Key selling propositions include higher energy conversion efficiency, reduced operating costs, longer lifespans, and reduced environmental impact.
Key Drivers, Barriers & Challenges in Power Generation Technologies Market
Key Drivers:
- Increasing global energy demand
- Growing environmental concerns and regulations
- Technological advancements leading to cost reductions
- Government incentives and supportive policies
Challenges:
- High initial investment costs for renewable energy projects.
- Grid integration challenges for intermittent renewable sources.
- Supply chain disruptions impacting the availability of raw materials.
- Intense competition among established and emerging players.
Emerging Opportunities in Power Generation Technologies Market
- Untapped markets in developing economies with high growth potential.
- Integration of renewable energy with smart grid technologies.
- Development of advanced energy storage solutions.
- Growing demand for off-grid and micro-grid power solutions.
Growth Accelerators in the Power Generation Technologies Market Industry
Technological breakthroughs in energy storage, particularly battery technology, are significantly accelerating market growth. Strategic partnerships between technology providers, energy companies, and governments are fostering innovation and market expansion. The increasing adoption of distributed generation and microgrids is creating new opportunities for smaller-scale power generation technologies.
Key Players Shaping the Power Generation Technologies Market Market
- JinkoSolar Holding Co Ltd
- Vestas Wind Systems A/S
- Suntech Power Holdings Co Ltd
- Siemens AG
- Mitsubishi Hitachi Power Systems Ltd
- Trina Solar Ltd
- Suzlon Energy Ltd
- JA Solar Holdings Co Ltd
- General Electric Company
- Andritz AG
Notable Milestones in Power Generation Technologies Market Sector
- 2021: Significant increase in global investment in renewable energy projects.
- 2022: Launch of several innovative solar PV panel technologies with enhanced efficiency.
- 2023: Several large-scale wind farm projects commenced operations.
- 2024: Major mergers and acquisitions within the renewable energy sector.
In-Depth Power Generation Technologies Market Market Outlook
The Power Generation Technologies market is poised for continued strong growth, driven by increasing energy demand, environmental concerns, and technological advancements. The ongoing decline in the cost of renewable energy technologies and supportive government policies will further fuel this expansion. Strategic opportunities exist for companies that can innovate in areas like energy storage, smart grids, and microgrids. The focus on sustainable and decarbonized energy sources will continue to shape the market landscape in the coming years, presenting significant opportunities for growth and investment.
Power Generation Technologies Market Segmentation
-
1. Type
- 1.1. Steam Turbine
- 1.2. Gas Turbine
- 1.3. Hydro Turbine
- 1.4. Wind Turbine
- 1.5. Solar Photovoltaic (PV)
- 1.6. Others
Power Generation Technologies Market Segmentation By Geography
- 1. North America
- 2. Europe
- 3. Asia Pacific
- 4. South America
- 5. Middle East and Africa
Power Generation Technologies Market REPORT HIGHLIGHTS
| Aspects | Details |
|---|---|
| Study Period | 2019-2033 |
| Base Year | 2024 |
| Estimated Year | 2025 |
| Forecast Period | 2025-2033 |
| Historical Period | 2019-2024 |
| Growth Rate | CAGR of > 5.50% from 2019-2033 |
| Segmentation |
|
Table of Contents
- 1. Introduction
- 1.1. Research Scope
- 1.2. Market Segmentation
- 1.3. Research Methodology
- 1.4. Definitions and Assumptions
- 2. Executive Summary
- 2.1. Introduction
- 3. Market Dynamics
- 3.1. Introduction
- 3.2. Market Drivers
- 3.2.1. 4.; Increasing Adoption of Smart Technology in Power Grid Infrastructure4.; Aging of Transmission and Distribution (T&D) Infrastructure
- 3.3. Market Restrains
- 3.3.1. 4.; Low Accessibility to Electricity in Underdeveloped Nations
- 3.4. Market Trends
- 3.4.1. Solar Photovoltaic (PV) as a Fastest Growing Segment
- 4. Market Factor Analysis
- 4.1. Porters Five Forces
- 4.2. Supply/Value Chain
- 4.3. PESTEL analysis
- 4.4. Market Entropy
- 4.5. Patent/Trademark Analysis
- 5. Global Power Generation Technologies Market Analysis, Insights and Forecast, 2019-2031
- 5.1. Market Analysis, Insights and Forecast - by Type
- 5.1.1. Steam Turbine
- 5.1.2. Gas Turbine
- 5.1.3. Hydro Turbine
- 5.1.4. Wind Turbine
- 5.1.5. Solar Photovoltaic (PV)
- 5.1.6. Others
- 5.2. Market Analysis, Insights and Forecast - by Region
- 5.2.1. North America
- 5.2.2. Europe
- 5.2.3. Asia Pacific
- 5.2.4. South America
- 5.2.5. Middle East and Africa
- 5.1. Market Analysis, Insights and Forecast - by Type
- 6. North America Power Generation Technologies Market Analysis, Insights and Forecast, 2019-2031
- 6.1. Market Analysis, Insights and Forecast - by Type
- 6.1.1. Steam Turbine
- 6.1.2. Gas Turbine
- 6.1.3. Hydro Turbine
- 6.1.4. Wind Turbine
- 6.1.5. Solar Photovoltaic (PV)
- 6.1.6. Others
- 6.1. Market Analysis, Insights and Forecast - by Type
- 7. Europe Power Generation Technologies Market Analysis, Insights and Forecast, 2019-2031
- 7.1. Market Analysis, Insights and Forecast - by Type
- 7.1.1. Steam Turbine
- 7.1.2. Gas Turbine
- 7.1.3. Hydro Turbine
- 7.1.4. Wind Turbine
- 7.1.5. Solar Photovoltaic (PV)
- 7.1.6. Others
- 7.1. Market Analysis, Insights and Forecast - by Type
- 8. Asia Pacific Power Generation Technologies Market Analysis, Insights and Forecast, 2019-2031
- 8.1. Market Analysis, Insights and Forecast - by Type
- 8.1.1. Steam Turbine
- 8.1.2. Gas Turbine
- 8.1.3. Hydro Turbine
- 8.1.4. Wind Turbine
- 8.1.5. Solar Photovoltaic (PV)
- 8.1.6. Others
- 8.1. Market Analysis, Insights and Forecast - by Type
- 9. South America Power Generation Technologies Market Analysis, Insights and Forecast, 2019-2031
- 9.1. Market Analysis, Insights and Forecast - by Type
- 9.1.1. Steam Turbine
- 9.1.2. Gas Turbine
- 9.1.3. Hydro Turbine
- 9.1.4. Wind Turbine
- 9.1.5. Solar Photovoltaic (PV)
- 9.1.6. Others
- 9.1. Market Analysis, Insights and Forecast - by Type
- 10. Middle East and Africa Power Generation Technologies Market Analysis, Insights and Forecast, 2019-2031
- 10.1. Market Analysis, Insights and Forecast - by Type
- 10.1.1. Steam Turbine
- 10.1.2. Gas Turbine
- 10.1.3. Hydro Turbine
- 10.1.4. Wind Turbine
- 10.1.5. Solar Photovoltaic (PV)
- 10.1.6. Others
- 10.1. Market Analysis, Insights and Forecast - by Type
- 11. North America Power Generation Technologies Market Analysis, Insights and Forecast, 2019-2031
- 11.1. Market Analysis, Insights and Forecast - By Country/Sub-region
- 11.1.1 United States
- 11.1.2 Canada
- 11.1.3 Mexico
- 12. Europe Power Generation Technologies Market Analysis, Insights and Forecast, 2019-2031
- 12.1. Market Analysis, Insights and Forecast - By Country/Sub-region
- 12.1.1 Germany
- 12.1.2 United Kingdom
- 12.1.3 France
- 12.1.4 Spain
- 12.1.5 Italy
- 12.1.6 Spain
- 12.1.7 Belgium
- 12.1.8 Netherland
- 12.1.9 Nordics
- 12.1.10 Rest of Europe
- 13. Asia Pacific Power Generation Technologies Market Analysis, Insights and Forecast, 2019-2031
- 13.1. Market Analysis, Insights and Forecast - By Country/Sub-region
- 13.1.1 China
- 13.1.2 Japan
- 13.1.3 India
- 13.1.4 South Korea
- 13.1.5 Southeast Asia
- 13.1.6 Australia
- 13.1.7 Indonesia
- 13.1.8 Phillipes
- 13.1.9 Singapore
- 13.1.10 Thailandc
- 13.1.11 Rest of Asia Pacific
- 14. South America Power Generation Technologies Market Analysis, Insights and Forecast, 2019-2031
- 14.1. Market Analysis, Insights and Forecast - By Country/Sub-region
- 14.1.1 Brazil
- 14.1.2 Argentina
- 14.1.3 Peru
- 14.1.4 Chile
- 14.1.5 Colombia
- 14.1.6 Ecuador
- 14.1.7 Venezuela
- 14.1.8 Rest of South America
- 15. MEA Power Generation Technologies Market Analysis, Insights and Forecast, 2019-2031
- 15.1. Market Analysis, Insights and Forecast - By Country/Sub-region
- 15.1.1 United Arab Emirates
- 15.1.2 Saudi Arabia
- 15.1.3 South Africa
- 15.1.4 Rest of Middle East and Africa
- 16. Competitive Analysis
- 16.1. Global Market Share Analysis 2024
- 16.2. Company Profiles
- 16.2.1 JinkoSolar Holding Co Ltd
- 16.2.1.1. Overview
- 16.2.1.2. Products
- 16.2.1.3. SWOT Analysis
- 16.2.1.4. Recent Developments
- 16.2.1.5. Financials (Based on Availability)
- 16.2.2 Vestas Wind Systems A/S
- 16.2.2.1. Overview
- 16.2.2.2. Products
- 16.2.2.3. SWOT Analysis
- 16.2.2.4. Recent Developments
- 16.2.2.5. Financials (Based on Availability)
- 16.2.3 Suntech Power Holdings Co Ltd
- 16.2.3.1. Overview
- 16.2.3.2. Products
- 16.2.3.3. SWOT Analysis
- 16.2.3.4. Recent Developments
- 16.2.3.5. Financials (Based on Availability)
- 16.2.4 Siemens AG
- 16.2.4.1. Overview
- 16.2.4.2. Products
- 16.2.4.3. SWOT Analysis
- 16.2.4.4. Recent Developments
- 16.2.4.5. Financials (Based on Availability)
- 16.2.5 Mitsubishi Hitachi Power Systems Ltd
- 16.2.5.1. Overview
- 16.2.5.2. Products
- 16.2.5.3. SWOT Analysis
- 16.2.5.4. Recent Developments
- 16.2.5.5. Financials (Based on Availability)
- 16.2.6 Trina Solar Ltd
- 16.2.6.1. Overview
- 16.2.6.2. Products
- 16.2.6.3. SWOT Analysis
- 16.2.6.4. Recent Developments
- 16.2.6.5. Financials (Based on Availability)
- 16.2.7 Suzlon Energy Ltd
- 16.2.7.1. Overview
- 16.2.7.2. Products
- 16.2.7.3. SWOT Analysis
- 16.2.7.4. Recent Developments
- 16.2.7.5. Financials (Based on Availability)
- 16.2.8 JA Solar Holdings Co Ltd
- 16.2.8.1. Overview
- 16.2.8.2. Products
- 16.2.8.3. SWOT Analysis
- 16.2.8.4. Recent Developments
- 16.2.8.5. Financials (Based on Availability)
- 16.2.9 General Electric Company
- 16.2.9.1. Overview
- 16.2.9.2. Products
- 16.2.9.3. SWOT Analysis
- 16.2.9.4. Recent Developments
- 16.2.9.5. Financials (Based on Availability)
- 16.2.10 Andritz AG
- 16.2.10.1. Overview
- 16.2.10.2. Products
- 16.2.10.3. SWOT Analysis
- 16.2.10.4. Recent Developments
- 16.2.10.5. Financials (Based on Availability)
- 16.2.1 JinkoSolar Holding Co Ltd
List of Figures
- Figure 1: Global Power Generation Technologies Market Revenue Breakdown (Million, %) by Region 2024 & 2032
- Figure 2: North America Power Generation Technologies Market Revenue (Million), by Country 2024 & 2032
- Figure 3: North America Power Generation Technologies Market Revenue Share (%), by Country 2024 & 2032
- Figure 4: Europe Power Generation Technologies Market Revenue (Million), by Country 2024 & 2032
- Figure 5: Europe Power Generation Technologies Market Revenue Share (%), by Country 2024 & 2032
- Figure 6: Asia Pacific Power Generation Technologies Market Revenue (Million), by Country 2024 & 2032
- Figure 7: Asia Pacific Power Generation Technologies Market Revenue Share (%), by Country 2024 & 2032
- Figure 8: South America Power Generation Technologies Market Revenue (Million), by Country 2024 & 2032
- Figure 9: South America Power Generation Technologies Market Revenue Share (%), by Country 2024 & 2032
- Figure 10: MEA Power Generation Technologies Market Revenue (Million), by Country 2024 & 2032
- Figure 11: MEA Power Generation Technologies Market Revenue Share (%), by Country 2024 & 2032
- Figure 12: North America Power Generation Technologies Market Revenue (Million), by Type 2024 & 2032
- Figure 13: North America Power Generation Technologies Market Revenue Share (%), by Type 2024 & 2032
- Figure 14: North America Power Generation Technologies Market Revenue (Million), by Country 2024 & 2032
- Figure 15: North America Power Generation Technologies Market Revenue Share (%), by Country 2024 & 2032
- Figure 16: Europe Power Generation Technologies Market Revenue (Million), by Type 2024 & 2032
- Figure 17: Europe Power Generation Technologies Market Revenue Share (%), by Type 2024 & 2032
- Figure 18: Europe Power Generation Technologies Market Revenue (Million), by Country 2024 & 2032
- Figure 19: Europe Power Generation Technologies Market Revenue Share (%), by Country 2024 & 2032
- Figure 20: Asia Pacific Power Generation Technologies Market Revenue (Million), by Type 2024 & 2032
- Figure 21: Asia Pacific Power Generation Technologies Market Revenue Share (%), by Type 2024 & 2032
- Figure 22: Asia Pacific Power Generation Technologies Market Revenue (Million), by Country 2024 & 2032
- Figure 23: Asia Pacific Power Generation Technologies Market Revenue Share (%), by Country 2024 & 2032
- Figure 24: South America Power Generation Technologies Market Revenue (Million), by Type 2024 & 2032
- Figure 25: South America Power Generation Technologies Market Revenue Share (%), by Type 2024 & 2032
- Figure 26: South America Power Generation Technologies Market Revenue (Million), by Country 2024 & 2032
- Figure 27: South America Power Generation Technologies Market Revenue Share (%), by Country 2024 & 2032
- Figure 28: Middle East and Africa Power Generation Technologies Market Revenue (Million), by Type 2024 & 2032
- Figure 29: Middle East and Africa Power Generation Technologies Market Revenue Share (%), by Type 2024 & 2032
- Figure 30: Middle East and Africa Power Generation Technologies Market Revenue (Million), by Country 2024 & 2032
- Figure 31: Middle East and Africa Power Generation Technologies Market Revenue Share (%), by Country 2024 & 2032
List of Tables
- Table 1: Global Power Generation Technologies Market Revenue Million Forecast, by Region 2019 & 2032
- Table 2: Global Power Generation Technologies Market Revenue Million Forecast, by Type 2019 & 2032
- Table 3: Global Power Generation Technologies Market Revenue Million Forecast, by Region 2019 & 2032
- Table 4: Global Power Generation Technologies Market Revenue Million Forecast, by Country 2019 & 2032
- Table 5: United States Power Generation Technologies Market Revenue (Million) Forecast, by Application 2019 & 2032
- Table 6: Canada Power Generation Technologies Market Revenue (Million) Forecast, by Application 2019 & 2032
- Table 7: Mexico Power Generation Technologies Market Revenue (Million) Forecast, by Application 2019 & 2032
- Table 8: Global Power Generation Technologies Market Revenue Million Forecast, by Country 2019 & 2032
- Table 9: Germany Power Generation Technologies Market Revenue (Million) Forecast, by Application 2019 & 2032
- Table 10: United Kingdom Power Generation Technologies Market Revenue (Million) Forecast, by Application 2019 & 2032
- Table 11: France Power Generation Technologies Market Revenue (Million) Forecast, by Application 2019 & 2032
- Table 12: Spain Power Generation Technologies Market Revenue (Million) Forecast, by Application 2019 & 2032
- Table 13: Italy Power Generation Technologies Market Revenue (Million) Forecast, by Application 2019 & 2032
- Table 14: Spain Power Generation Technologies Market Revenue (Million) Forecast, by Application 2019 & 2032
- Table 15: Belgium Power Generation Technologies Market Revenue (Million) Forecast, by Application 2019 & 2032
- Table 16: Netherland Power Generation Technologies Market Revenue (Million) Forecast, by Application 2019 & 2032
- Table 17: Nordics Power Generation Technologies Market Revenue (Million) Forecast, by Application 2019 & 2032
- Table 18: Rest of Europe Power Generation Technologies Market Revenue (Million) Forecast, by Application 2019 & 2032
- Table 19: Global Power Generation Technologies Market Revenue Million Forecast, by Country 2019 & 2032
- Table 20: China Power Generation Technologies Market Revenue (Million) Forecast, by Application 2019 & 2032
- Table 21: Japan Power Generation Technologies Market Revenue (Million) Forecast, by Application 2019 & 2032
- Table 22: India Power Generation Technologies Market Revenue (Million) Forecast, by Application 2019 & 2032
- Table 23: South Korea Power Generation Technologies Market Revenue (Million) Forecast, by Application 2019 & 2032
- Table 24: Southeast Asia Power Generation Technologies Market Revenue (Million) Forecast, by Application 2019 & 2032
- Table 25: Australia Power Generation Technologies Market Revenue (Million) Forecast, by Application 2019 & 2032
- Table 26: Indonesia Power Generation Technologies Market Revenue (Million) Forecast, by Application 2019 & 2032
- Table 27: Phillipes Power Generation Technologies Market Revenue (Million) Forecast, by Application 2019 & 2032
- Table 28: Singapore Power Generation Technologies Market Revenue (Million) Forecast, by Application 2019 & 2032
- Table 29: Thailandc Power Generation Technologies Market Revenue (Million) Forecast, by Application 2019 & 2032
- Table 30: Rest of Asia Pacific Power Generation Technologies Market Revenue (Million) Forecast, by Application 2019 & 2032
- Table 31: Global Power Generation Technologies Market Revenue Million Forecast, by Country 2019 & 2032
- Table 32: Brazil Power Generation Technologies Market Revenue (Million) Forecast, by Application 2019 & 2032
- Table 33: Argentina Power Generation Technologies Market Revenue (Million) Forecast, by Application 2019 & 2032
- Table 34: Peru Power Generation Technologies Market Revenue (Million) Forecast, by Application 2019 & 2032
- Table 35: Chile Power Generation Technologies Market Revenue (Million) Forecast, by Application 2019 & 2032
- Table 36: Colombia Power Generation Technologies Market Revenue (Million) Forecast, by Application 2019 & 2032
- Table 37: Ecuador Power Generation Technologies Market Revenue (Million) Forecast, by Application 2019 & 2032
- Table 38: Venezuela Power Generation Technologies Market Revenue (Million) Forecast, by Application 2019 & 2032
- Table 39: Rest of South America Power Generation Technologies Market Revenue (Million) Forecast, by Application 2019 & 2032
- Table 40: Global Power Generation Technologies Market Revenue Million Forecast, by Country 2019 & 2032
- Table 41: United Arab Emirates Power Generation Technologies Market Revenue (Million) Forecast, by Application 2019 & 2032
- Table 42: Saudi Arabia Power Generation Technologies Market Revenue (Million) Forecast, by Application 2019 & 2032
- Table 43: South Africa Power Generation Technologies Market Revenue (Million) Forecast, by Application 2019 & 2032
- Table 44: Rest of Middle East and Africa Power Generation Technologies Market Revenue (Million) Forecast, by Application 2019 & 2032
- Table 45: Global Power Generation Technologies Market Revenue Million Forecast, by Type 2019 & 2032
- Table 46: Global Power Generation Technologies Market Revenue Million Forecast, by Country 2019 & 2032
- Table 47: Global Power Generation Technologies Market Revenue Million Forecast, by Type 2019 & 2032
- Table 48: Global Power Generation Technologies Market Revenue Million Forecast, by Country 2019 & 2032
- Table 49: Global Power Generation Technologies Market Revenue Million Forecast, by Type 2019 & 2032
- Table 50: Global Power Generation Technologies Market Revenue Million Forecast, by Country 2019 & 2032
- Table 51: Global Power Generation Technologies Market Revenue Million Forecast, by Type 2019 & 2032
- Table 52: Global Power Generation Technologies Market Revenue Million Forecast, by Country 2019 & 2032
- Table 53: Global Power Generation Technologies Market Revenue Million Forecast, by Type 2019 & 2032
- Table 54: Global Power Generation Technologies Market Revenue Million Forecast, by Country 2019 & 2032
Frequently Asked Questions
1. What is the projected Compound Annual Growth Rate (CAGR) of the Power Generation Technologies Market?
The projected CAGR is approximately > 5.50%.
2. Which companies are prominent players in the Power Generation Technologies Market?
Key companies in the market include JinkoSolar Holding Co Ltd, Vestas Wind Systems A/S, Suntech Power Holdings Co Ltd, Siemens AG, Mitsubishi Hitachi Power Systems Ltd, Trina Solar Ltd, Suzlon Energy Ltd, JA Solar Holdings Co Ltd, General Electric Company, Andritz AG.
3. What are the main segments of the Power Generation Technologies Market?
The market segments include Type.
4. Can you provide details about the market size?
The market size is estimated to be USD XX Million as of 2022.
5. What are some drivers contributing to market growth?
4.; Increasing Adoption of Smart Technology in Power Grid Infrastructure4.; Aging of Transmission and Distribution (T&D) Infrastructure.
6. What are the notable trends driving market growth?
Solar Photovoltaic (PV) as a Fastest Growing Segment.
7. Are there any restraints impacting market growth?
4.; Low Accessibility to Electricity in Underdeveloped Nations.
8. Can you provide examples of recent developments in the market?
N/A
9. What pricing options are available for accessing the report?
Pricing options include single-user, multi-user, and enterprise licenses priced at USD 4750, USD 5250, and USD 8750 respectively.
10. Is the market size provided in terms of value or volume?
The market size is provided in terms of value, measured in Million.
11. Are there any specific market keywords associated with the report?
Yes, the market keyword associated with the report is "Power Generation Technologies Market," which aids in identifying and referencing the specific market segment covered.
12. How do I determine which pricing option suits my needs best?
The pricing options vary based on user requirements and access needs. Individual users may opt for single-user licenses, while businesses requiring broader access may choose multi-user or enterprise licenses for cost-effective access to the report.
13. Are there any additional resources or data provided in the Power Generation Technologies Market report?
While the report offers comprehensive insights, it's advisable to review the specific contents or supplementary materials provided to ascertain if additional resources or data are available.
14. How can I stay updated on further developments or reports in the Power Generation Technologies Market?
To stay informed about further developments, trends, and reports in the Power Generation Technologies Market, consider subscribing to industry newsletters, following relevant companies and organizations, or regularly checking reputable industry news sources and publications.
Methodology
Step 1 - Identification of Relevant Samples Size from Population Database


Step 2 - Approaches for Defining Global Market Size (Value, Volume* & Price*)

Note*: In applicable scenarios
Step 3 - Data Sources
Primary Research
- Web Analytics
- Survey Reports
- Research Institute
- Latest Research Reports
- Opinion Leaders
Secondary Research
- Annual Reports
- White Paper
- Latest Press Release
- Industry Association
- Paid Database
- Investor Presentations

Step 4 - Data Triangulation
Involves using different sources of information in order to increase the validity of a study
These sources are likely to be stakeholders in a program - participants, other researchers, program staff, other community members, and so on.
Then we put all data in single framework & apply various statistical tools to find out the dynamic on the market.
During the analysis stage, feedback from the stakeholder groups would be compared to determine areas of agreement as well as areas of divergence


