
Key Insights
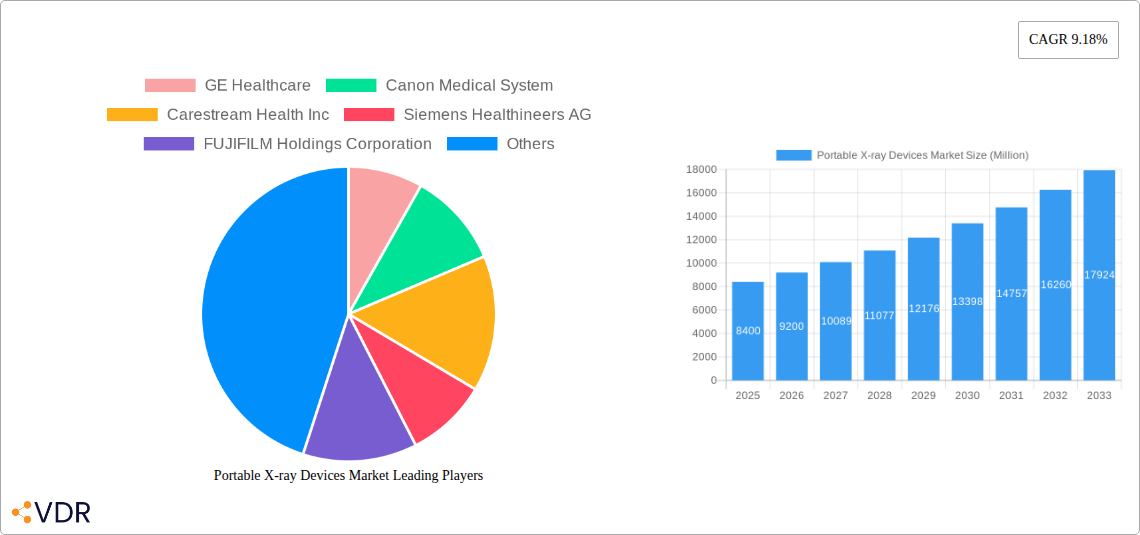
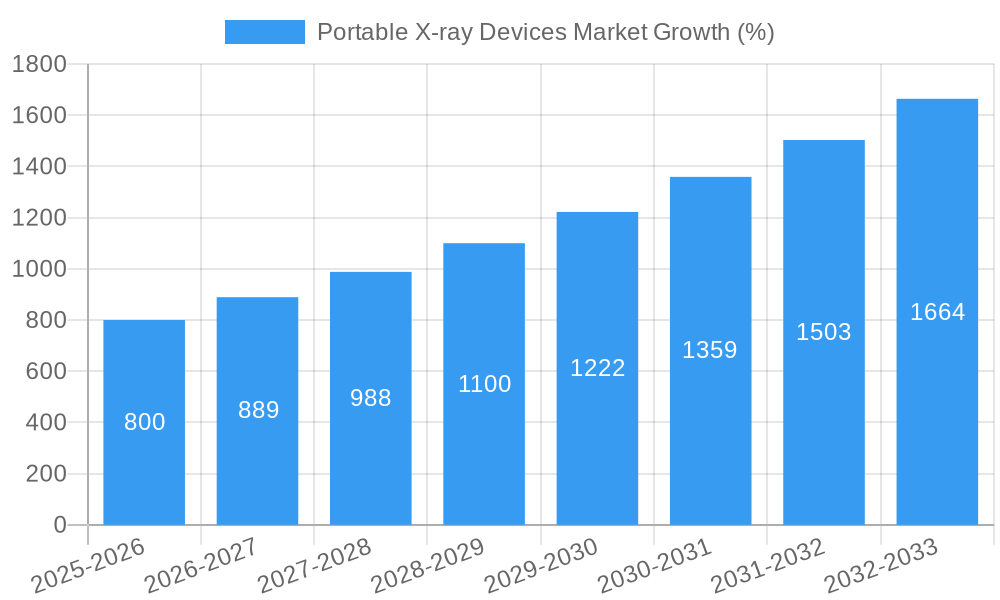
The portable X-ray devices market, valued at $8.40 billion in 2025, is projected to experience robust growth, driven by a Compound Annual Growth Rate (CAGR) of 9.18% from 2025 to 2033. This expansion is fueled by several key factors. The increasing prevalence of chronic diseases requiring frequent imaging, coupled with the rising demand for point-of-care diagnostics in remote areas and emergency settings, significantly boosts market demand. Technological advancements, such as the development of lighter, more compact, and wireless handheld X-ray devices, enhance portability and ease of use, making them indispensable tools for healthcare professionals. Furthermore, the integration of digital imaging technologies like DR (Digital Radiography) and improved image processing capabilities ensures superior image quality and faster diagnosis, further driving market adoption. The growing preference for minimally invasive procedures and the rising adoption of portable X-ray systems in ambulances and mobile clinics also contribute to market growth. Different applications including dental X-rays, mammography, chest X-rays, and abdominal X-rays, along with various modalities like handheld and mobile devices cater to diverse needs, fueling market segmentation and expansion.
Major players like GE Healthcare, Canon Medical Systems, and Siemens Healthineers are shaping the market landscape through continuous innovation and strategic partnerships. However, high initial investment costs associated with purchasing and maintaining portable X-ray systems, coupled with stringent regulatory requirements and the potential for radiation exposure, represent key market restraints. Despite these challenges, the market's growth trajectory remains positive, particularly in developing economies where access to advanced medical imaging is limited. The expansion into these regions, driven by increasing healthcare infrastructure development and rising disposable incomes, is expected to significantly boost market revenue in the coming years. Future growth will likely be influenced by the continued integration of AI and machine learning for improved image analysis and the development of more advanced, user-friendly portable X-ray systems.
Portable X-ray Devices Market: A Comprehensive Report (2019-2033)
This comprehensive report provides an in-depth analysis of the Portable X-ray Devices market, encompassing market dynamics, growth trends, regional segmentation, product landscape, and key players. The report covers the period from 2019 to 2033, with 2025 as the base year and a forecast period spanning 2025-2033. It caters to industry professionals, investors, and researchers seeking a detailed understanding of this dynamic market. The parent market is the medical imaging equipment market and the child market is the portable diagnostic imaging market. The global market size is predicted to reach xx Million units by 2033.
Portable X-ray Devices Market Market Dynamics & Structure
The Portable X-ray Devices market is characterized by a moderately concentrated landscape, with key players such as GE Healthcare, Canon Medical Systems, and Siemens Healthineers holding significant market share (xx%). Technological innovation, particularly in digital X-ray technology and wireless capabilities, is a major driver. Stringent regulatory frameworks governing medical devices influence market entry and product development. The market also faces competition from alternative imaging modalities like ultrasound and MRI. End-user demographics, primarily hospitals, clinics, and dental practices, significantly impact demand. M&A activity in the sector has been moderate, with xx deals recorded between 2019 and 2024.
- Market Concentration: Moderately concentrated, with top 5 players holding xx% market share.
- Technological Innovation: Digital X-ray and wireless capabilities are driving growth.
- Regulatory Framework: Stringent regulations impacting product development and market entry.
- Competitive Substitutes: Ultrasound and MRI pose competitive challenges.
- End-User Demographics: Hospitals, clinics, and dental practices are key end-users.
- M&A Activity: xx deals recorded between 2019 and 2024.
- Innovation Barriers: High R&D costs and regulatory hurdles.
Portable X-ray Devices Market Growth Trends & Insights
The Portable X-ray Devices market has witnessed significant growth during the historical period (2019-2024), driven by factors such as increasing prevalence of chronic diseases, technological advancements, and rising healthcare expenditure. The market size is estimated at xx Million units in 2025, exhibiting a CAGR of xx% during the forecast period (2025-2033). Adoption rates of digital X-ray systems are increasing steadily, fueled by superior image quality and reduced processing time. The shift towards point-of-care diagnostics and the growing demand for mobile healthcare solutions are further contributing to market expansion. Consumer behavior is leaning towards convenient and efficient diagnostic solutions. Technological disruptions, including the introduction of AI-powered image analysis tools, are expected to shape the market landscape in the coming years.
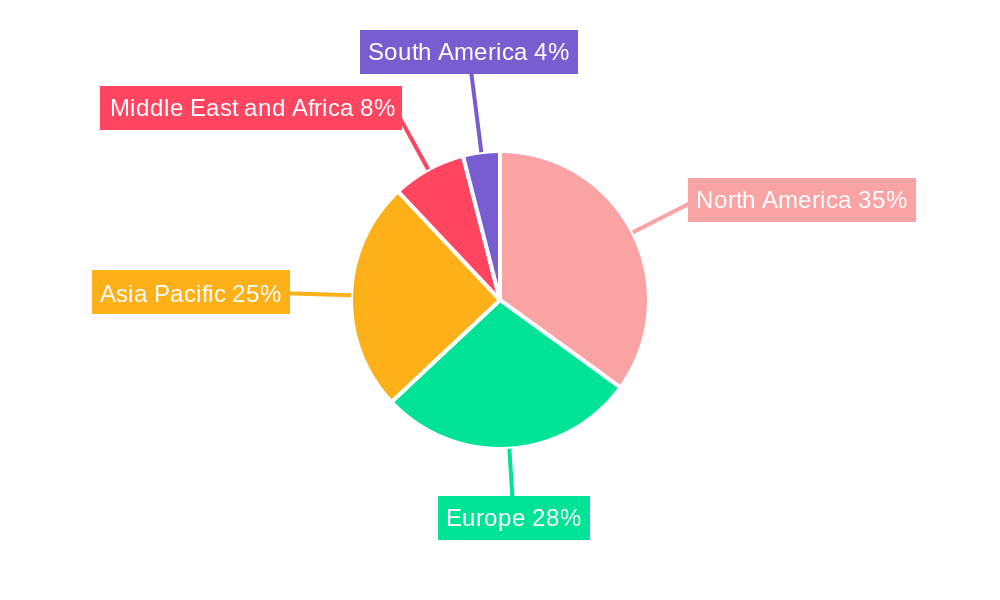
Dominant Regions, Countries, or Segments in Portable X-ray Devices Market
North America currently dominates the Portable X-ray Devices market, followed by Europe and Asia Pacific. This dominance is attributed to factors such as higher healthcare spending, advanced healthcare infrastructure, and a robust regulatory framework. Within the segments, Digital X-ray technology holds the largest market share due to its superior image quality and diagnostic capabilities. In terms of application, the Dental X-ray segment is a significant contributor, driven by the growing prevalence of dental diseases and increasing dental tourism. Mobile X-ray devices dominate the modality segment due to their flexibility and ease of use.
- Key Drivers (North America): High healthcare expenditure, advanced infrastructure, robust regulatory environment.
- Key Drivers (Europe): Rising prevalence of chronic diseases, increasing adoption of digital technologies.
- Key Drivers (Asia Pacific): Growing healthcare infrastructure, increasing disposable incomes.
- Segment Dominance: Digital X-ray technology, Dental X-ray application, Mobile X-ray devices modality.
Portable X-ray Devices Market Product Landscape
Portable X-ray devices are evolving rapidly, with manufacturers focusing on enhancing image quality, portability, and ease of use. Recent innovations include wireless capabilities, advanced image processing algorithms, and compact designs. Unique selling propositions often center on improved image clarity, reduced radiation exposure, and user-friendly interfaces. Technological advancements are focusing on integrating AI for automated image analysis and improved diagnostic accuracy.
Key Drivers, Barriers & Challenges in Portable X-ray Devices Market
Key Drivers:
- Increasing prevalence of chronic diseases requiring frequent X-rays.
- Growing demand for point-of-care diagnostics.
- Technological advancements in digital X-ray and wireless technologies.
- Rising healthcare expenditure and improving healthcare infrastructure in emerging markets.
Challenges:
- High initial investment costs for advanced systems.
- Stringent regulatory requirements for medical device approval.
- Competition from alternative imaging modalities.
- Supply chain disruptions impacting production and availability. This resulted in a xx% increase in device costs in 2022.
Emerging Opportunities in Portable X-ray Devices Market
- Expanding into underserved regions with limited access to healthcare.
- Development of AI-powered diagnostic tools for improved accuracy and efficiency.
- Integration of portable X-ray devices with telehealth platforms.
- Focus on developing portable X-ray systems for specialized applications, such as veterinary medicine.
Growth Accelerators in the Portable X-ray Devices Market Industry
Technological breakthroughs in areas like AI-powered image analysis, improved detectors, and miniaturization are significantly accelerating market growth. Strategic partnerships between manufacturers and healthcare providers are fostering wider adoption. Market expansion strategies, including targeted marketing campaigns and product diversification, are further driving growth.
Key Players Shaping the Portable X-ray Devices Market Market
- GE Healthcare
- Canon Medical Systems
- Carestream Health Inc
- Siemens Healthineers AG
- FUJIFILM Holdings Corporation
- Koninklijke Philips NV
- Envista Holdings Corporation (KaVo Dental GmbH)
- Shimadzu Corporations
- MinXray
Notable Milestones in Portable X-ray Devices Market Sector
- July 2022: Fujifilm Europe launched FDR Cross, a hybrid C-arm and portable x-ray device.
- March 2022: Konica Minolta Inc. launched AeroDR TX m01, a wireless portable X-ray system in Japan.
In-Depth Portable X-ray Devices Market Market Outlook
The future of the Portable X-ray Devices market looks promising, driven by continuous technological advancements, increasing healthcare expenditure, and the rising prevalence of chronic diseases. Strategic partnerships, market expansion into emerging economies, and the development of innovative applications will further propel market growth. The integration of AI and the development of more user-friendly, compact devices present significant opportunities for market players to capitalize on.
Portable X-ray Devices Market Segmentation
-
1. Technology
- 1.1. Analog X-ray
- 1.2. Digital X-ray
-
2. Application
- 2.1. Dental X-ray
- 2.2. Mammography
- 2.3. Chest X-ray
- 2.4. Abdomen X-ray
-
3. Modality
- 3.1. Handheld X-ray Devices
- 3.2. Mobile X-ray Devices
Portable X-ray Devices Market Segmentation By Geography
-
1. North America
- 1.1. United States
- 1.2. Canada
- 1.3. Mexico
-
2. Europe
- 2.1. Germany
- 2.2. United Kingdom
- 2.3. France
- 2.4. Italy
- 2.5. Spain
- 2.6. Rest of Europe
-
3. Asia Pacific
- 3.1. China
- 3.2. Japan
- 3.3. India
- 3.4. Australia
- 3.5. South Korea
- 3.6. Rest of Asia Pacific
-
4. Middle East and Africa
- 4.1. GCC
- 4.2. South Africa
- 4.3. Rest of Middle East and Africa
-
5. South America
- 5.1. Brazil
- 5.2. Argentina
- 5.3. Rest of South America
Portable X-ray Devices Market REPORT HIGHLIGHTS
| Aspects | Details |
|---|---|
| Study Period | 2019-2033 |
| Base Year | 2024 |
| Estimated Year | 2025 |
| Forecast Period | 2025-2033 |
| Historical Period | 2019-2024 |
| Growth Rate | CAGR of 9.18% from 2019-2033 |
| Segmentation |
|
Table of Contents
- 1. Introduction
- 1.1. Research Scope
- 1.2. Market Segmentation
- 1.3. Research Methodology
- 1.4. Definitions and Assumptions
- 2. Executive Summary
- 2.1. Introduction
- 3. Market Dynamics
- 3.1. Introduction
- 3.2. Market Drivers
- 3.2.1. Technological Advancements; Growing Geriatric Population and Increasing Prevalence of Vascular Diseases; Huge Funding for R&D of Portable Technologies by Private Players and Governments
- 3.3. Market Restrains
- 3.3.1. Stringent Regulatory Scenario; High Risk of Radiation Exposure
- 3.4. Market Trends
- 3.4.1. Digital X-ray Segment is Expected to Witness Significant Growth Over the Forecast Period
- 4. Market Factor Analysis
- 4.1. Porters Five Forces
- 4.2. Supply/Value Chain
- 4.3. PESTEL analysis
- 4.4. Market Entropy
- 4.5. Patent/Trademark Analysis
- 5. Global Portable X-ray Devices Market Analysis, Insights and Forecast, 2019-2031
- 5.1. Market Analysis, Insights and Forecast - by Technology
- 5.1.1. Analog X-ray
- 5.1.2. Digital X-ray
- 5.2. Market Analysis, Insights and Forecast - by Application
- 5.2.1. Dental X-ray
- 5.2.2. Mammography
- 5.2.3. Chest X-ray
- 5.2.4. Abdomen X-ray
- 5.3. Market Analysis, Insights and Forecast - by Modality
- 5.3.1. Handheld X-ray Devices
- 5.3.2. Mobile X-ray Devices
- 5.4. Market Analysis, Insights and Forecast - by Region
- 5.4.1. North America
- 5.4.2. Europe
- 5.4.3. Asia Pacific
- 5.4.4. Middle East and Africa
- 5.4.5. South America
- 5.1. Market Analysis, Insights and Forecast - by Technology
- 6. North America Portable X-ray Devices Market Analysis, Insights and Forecast, 2019-2031
- 6.1. Market Analysis, Insights and Forecast - by Technology
- 6.1.1. Analog X-ray
- 6.1.2. Digital X-ray
- 6.2. Market Analysis, Insights and Forecast - by Application
- 6.2.1. Dental X-ray
- 6.2.2. Mammography
- 6.2.3. Chest X-ray
- 6.2.4. Abdomen X-ray
- 6.3. Market Analysis, Insights and Forecast - by Modality
- 6.3.1. Handheld X-ray Devices
- 6.3.2. Mobile X-ray Devices
- 6.1. Market Analysis, Insights and Forecast - by Technology
- 7. Europe Portable X-ray Devices Market Analysis, Insights and Forecast, 2019-2031
- 7.1. Market Analysis, Insights and Forecast - by Technology
- 7.1.1. Analog X-ray
- 7.1.2. Digital X-ray
- 7.2. Market Analysis, Insights and Forecast - by Application
- 7.2.1. Dental X-ray
- 7.2.2. Mammography
- 7.2.3. Chest X-ray
- 7.2.4. Abdomen X-ray
- 7.3. Market Analysis, Insights and Forecast - by Modality
- 7.3.1. Handheld X-ray Devices
- 7.3.2. Mobile X-ray Devices
- 7.1. Market Analysis, Insights and Forecast - by Technology
- 8. Asia Pacific Portable X-ray Devices Market Analysis, Insights and Forecast, 2019-2031
- 8.1. Market Analysis, Insights and Forecast - by Technology
- 8.1.1. Analog X-ray
- 8.1.2. Digital X-ray
- 8.2. Market Analysis, Insights and Forecast - by Application
- 8.2.1. Dental X-ray
- 8.2.2. Mammography
- 8.2.3. Chest X-ray
- 8.2.4. Abdomen X-ray
- 8.3. Market Analysis, Insights and Forecast - by Modality
- 8.3.1. Handheld X-ray Devices
- 8.3.2. Mobile X-ray Devices
- 8.1. Market Analysis, Insights and Forecast - by Technology
- 9. Middle East and Africa Portable X-ray Devices Market Analysis, Insights and Forecast, 2019-2031
- 9.1. Market Analysis, Insights and Forecast - by Technology
- 9.1.1. Analog X-ray
- 9.1.2. Digital X-ray
- 9.2. Market Analysis, Insights and Forecast - by Application
- 9.2.1. Dental X-ray
- 9.2.2. Mammography
- 9.2.3. Chest X-ray
- 9.2.4. Abdomen X-ray
- 9.3. Market Analysis, Insights and Forecast - by Modality
- 9.3.1. Handheld X-ray Devices
- 9.3.2. Mobile X-ray Devices
- 9.1. Market Analysis, Insights and Forecast - by Technology
- 10. South America Portable X-ray Devices Market Analysis, Insights and Forecast, 2019-2031
- 10.1. Market Analysis, Insights and Forecast - by Technology
- 10.1.1. Analog X-ray
- 10.1.2. Digital X-ray
- 10.2. Market Analysis, Insights and Forecast - by Application
- 10.2.1. Dental X-ray
- 10.2.2. Mammography
- 10.2.3. Chest X-ray
- 10.2.4. Abdomen X-ray
- 10.3. Market Analysis, Insights and Forecast - by Modality
- 10.3.1. Handheld X-ray Devices
- 10.3.2. Mobile X-ray Devices
- 10.1. Market Analysis, Insights and Forecast - by Technology
- 11. North America Portable X-ray Devices Market Analysis, Insights and Forecast, 2019-2031
- 11.1. Market Analysis, Insights and Forecast - By Country/Sub-region
- 11.1.1. undefined
- 12. Europe Portable X-ray Devices Market Analysis, Insights and Forecast, 2019-2031
- 12.1. Market Analysis, Insights and Forecast - By Country/Sub-region
- 12.1.1. undefined
- 13. Asia Pacific Portable X-ray Devices Market Analysis, Insights and Forecast, 2019-2031
- 13.1. Market Analysis, Insights and Forecast - By Country/Sub-region
- 13.1.1. undefined
- 14. Middle East and Africa Portable X-ray Devices Market Analysis, Insights and Forecast, 2019-2031
- 14.1. Market Analysis, Insights and Forecast - By Country/Sub-region
- 14.1.1. undefined
- 15. South America Portable X-ray Devices Market Analysis, Insights and Forecast, 2019-2031
- 15.1. Market Analysis, Insights and Forecast - By Country/Sub-region
- 15.1.1. undefined
- 16. Competitive Analysis
- 16.1. Global Market Share Analysis 2024
- 16.2. Company Profiles
- 16.2.1 GE Healthcare
- 16.2.1.1. Overview
- 16.2.1.2. Products
- 16.2.1.3. SWOT Analysis
- 16.2.1.4. Recent Developments
- 16.2.1.5. Financials (Based on Availability)
- 16.2.2 Canon Medical System
- 16.2.2.1. Overview
- 16.2.2.2. Products
- 16.2.2.3. SWOT Analysis
- 16.2.2.4. Recent Developments
- 16.2.2.5. Financials (Based on Availability)
- 16.2.3 Carestream Health Inc
- 16.2.3.1. Overview
- 16.2.3.2. Products
- 16.2.3.3. SWOT Analysis
- 16.2.3.4. Recent Developments
- 16.2.3.5. Financials (Based on Availability)
- 16.2.4 Siemens Healthineers AG
- 16.2.4.1. Overview
- 16.2.4.2. Products
- 16.2.4.3. SWOT Analysis
- 16.2.4.4. Recent Developments
- 16.2.4.5. Financials (Based on Availability)
- 16.2.5 FUJIFILM Holdings Corporation
- 16.2.5.1. Overview
- 16.2.5.2. Products
- 16.2.5.3. SWOT Analysis
- 16.2.5.4. Recent Developments
- 16.2.5.5. Financials (Based on Availability)
- 16.2.6 Koninklijke Philips NV
- 16.2.6.1. Overview
- 16.2.6.2. Products
- 16.2.6.3. SWOT Analysis
- 16.2.6.4. Recent Developments
- 16.2.6.5. Financials (Based on Availability)
- 16.2.7 Envista Holdings Corporation (KaVo Dental GmbH)
- 16.2.7.1. Overview
- 16.2.7.2. Products
- 16.2.7.3. SWOT Analysis
- 16.2.7.4. Recent Developments
- 16.2.7.5. Financials (Based on Availability)
- 16.2.8 Shimadzu Corporations
- 16.2.8.1. Overview
- 16.2.8.2. Products
- 16.2.8.3. SWOT Analysis
- 16.2.8.4. Recent Developments
- 16.2.8.5. Financials (Based on Availability)
- 16.2.9 MinXray
- 16.2.9.1. Overview
- 16.2.9.2. Products
- 16.2.9.3. SWOT Analysis
- 16.2.9.4. Recent Developments
- 16.2.9.5. Financials (Based on Availability)
- 16.2.1 GE Healthcare
List of Figures
- Figure 1: Global Portable X-ray Devices Market Revenue Breakdown (Million, %) by Region 2024 & 2032
- Figure 2: Global Portable X-ray Devices Market Volume Breakdown (K Unit, %) by Region 2024 & 2032
- Figure 3: North America Portable X-ray Devices Market Revenue (Million), by Country 2024 & 2032
- Figure 4: North America Portable X-ray Devices Market Volume (K Unit), by Country 2024 & 2032
- Figure 5: North America Portable X-ray Devices Market Revenue Share (%), by Country 2024 & 2032
- Figure 6: North America Portable X-ray Devices Market Volume Share (%), by Country 2024 & 2032
- Figure 7: Europe Portable X-ray Devices Market Revenue (Million), by Country 2024 & 2032
- Figure 8: Europe Portable X-ray Devices Market Volume (K Unit), by Country 2024 & 2032
- Figure 9: Europe Portable X-ray Devices Market Revenue Share (%), by Country 2024 & 2032
- Figure 10: Europe Portable X-ray Devices Market Volume Share (%), by Country 2024 & 2032
- Figure 11: Asia Pacific Portable X-ray Devices Market Revenue (Million), by Country 2024 & 2032
- Figure 12: Asia Pacific Portable X-ray Devices Market Volume (K Unit), by Country 2024 & 2032
- Figure 13: Asia Pacific Portable X-ray Devices Market Revenue Share (%), by Country 2024 & 2032
- Figure 14: Asia Pacific Portable X-ray Devices Market Volume Share (%), by Country 2024 & 2032
- Figure 15: Middle East and Africa Portable X-ray Devices Market Revenue (Million), by Country 2024 & 2032
- Figure 16: Middle East and Africa Portable X-ray Devices Market Volume (K Unit), by Country 2024 & 2032
- Figure 17: Middle East and Africa Portable X-ray Devices Market Revenue Share (%), by Country 2024 & 2032
- Figure 18: Middle East and Africa Portable X-ray Devices Market Volume Share (%), by Country 2024 & 2032
- Figure 19: South America Portable X-ray Devices Market Revenue (Million), by Country 2024 & 2032
- Figure 20: South America Portable X-ray Devices Market Volume (K Unit), by Country 2024 & 2032
- Figure 21: South America Portable X-ray Devices Market Revenue Share (%), by Country 2024 & 2032
- Figure 22: South America Portable X-ray Devices Market Volume Share (%), by Country 2024 & 2032
- Figure 23: North America Portable X-ray Devices Market Revenue (Million), by Technology 2024 & 2032
- Figure 24: North America Portable X-ray Devices Market Volume (K Unit), by Technology 2024 & 2032
- Figure 25: North America Portable X-ray Devices Market Revenue Share (%), by Technology 2024 & 2032
- Figure 26: North America Portable X-ray Devices Market Volume Share (%), by Technology 2024 & 2032
- Figure 27: North America Portable X-ray Devices Market Revenue (Million), by Application 2024 & 2032
- Figure 28: North America Portable X-ray Devices Market Volume (K Unit), by Application 2024 & 2032
- Figure 29: North America Portable X-ray Devices Market Revenue Share (%), by Application 2024 & 2032
- Figure 30: North America Portable X-ray Devices Market Volume Share (%), by Application 2024 & 2032
- Figure 31: North America Portable X-ray Devices Market Revenue (Million), by Modality 2024 & 2032
- Figure 32: North America Portable X-ray Devices Market Volume (K Unit), by Modality 2024 & 2032
- Figure 33: North America Portable X-ray Devices Market Revenue Share (%), by Modality 2024 & 2032
- Figure 34: North America Portable X-ray Devices Market Volume Share (%), by Modality 2024 & 2032
- Figure 35: North America Portable X-ray Devices Market Revenue (Million), by Country 2024 & 2032
- Figure 36: North America Portable X-ray Devices Market Volume (K Unit), by Country 2024 & 2032
- Figure 37: North America Portable X-ray Devices Market Revenue Share (%), by Country 2024 & 2032
- Figure 38: North America Portable X-ray Devices Market Volume Share (%), by Country 2024 & 2032
- Figure 39: Europe Portable X-ray Devices Market Revenue (Million), by Technology 2024 & 2032
- Figure 40: Europe Portable X-ray Devices Market Volume (K Unit), by Technology 2024 & 2032
- Figure 41: Europe Portable X-ray Devices Market Revenue Share (%), by Technology 2024 & 2032
- Figure 42: Europe Portable X-ray Devices Market Volume Share (%), by Technology 2024 & 2032
- Figure 43: Europe Portable X-ray Devices Market Revenue (Million), by Application 2024 & 2032
- Figure 44: Europe Portable X-ray Devices Market Volume (K Unit), by Application 2024 & 2032
- Figure 45: Europe Portable X-ray Devices Market Revenue Share (%), by Application 2024 & 2032
- Figure 46: Europe Portable X-ray Devices Market Volume Share (%), by Application 2024 & 2032
- Figure 47: Europe Portable X-ray Devices Market Revenue (Million), by Modality 2024 & 2032
- Figure 48: Europe Portable X-ray Devices Market Volume (K Unit), by Modality 2024 & 2032
- Figure 49: Europe Portable X-ray Devices Market Revenue Share (%), by Modality 2024 & 2032
- Figure 50: Europe Portable X-ray Devices Market Volume Share (%), by Modality 2024 & 2032
- Figure 51: Europe Portable X-ray Devices Market Revenue (Million), by Country 2024 & 2032
- Figure 52: Europe Portable X-ray Devices Market Volume (K Unit), by Country 2024 & 2032
- Figure 53: Europe Portable X-ray Devices Market Revenue Share (%), by Country 2024 & 2032
- Figure 54: Europe Portable X-ray Devices Market Volume Share (%), by Country 2024 & 2032
- Figure 55: Asia Pacific Portable X-ray Devices Market Revenue (Million), by Technology 2024 & 2032
- Figure 56: Asia Pacific Portable X-ray Devices Market Volume (K Unit), by Technology 2024 & 2032
- Figure 57: Asia Pacific Portable X-ray Devices Market Revenue Share (%), by Technology 2024 & 2032
- Figure 58: Asia Pacific Portable X-ray Devices Market Volume Share (%), by Technology 2024 & 2032
- Figure 59: Asia Pacific Portable X-ray Devices Market Revenue (Million), by Application 2024 & 2032
- Figure 60: Asia Pacific Portable X-ray Devices Market Volume (K Unit), by Application 2024 & 2032
- Figure 61: Asia Pacific Portable X-ray Devices Market Revenue Share (%), by Application 2024 & 2032
- Figure 62: Asia Pacific Portable X-ray Devices Market Volume Share (%), by Application 2024 & 2032
- Figure 63: Asia Pacific Portable X-ray Devices Market Revenue (Million), by Modality 2024 & 2032
- Figure 64: Asia Pacific Portable X-ray Devices Market Volume (K Unit), by Modality 2024 & 2032
- Figure 65: Asia Pacific Portable X-ray Devices Market Revenue Share (%), by Modality 2024 & 2032
- Figure 66: Asia Pacific Portable X-ray Devices Market Volume Share (%), by Modality 2024 & 2032
- Figure 67: Asia Pacific Portable X-ray Devices Market Revenue (Million), by Country 2024 & 2032
- Figure 68: Asia Pacific Portable X-ray Devices Market Volume (K Unit), by Country 2024 & 2032
- Figure 69: Asia Pacific Portable X-ray Devices Market Revenue Share (%), by Country 2024 & 2032
- Figure 70: Asia Pacific Portable X-ray Devices Market Volume Share (%), by Country 2024 & 2032
- Figure 71: Middle East and Africa Portable X-ray Devices Market Revenue (Million), by Technology 2024 & 2032
- Figure 72: Middle East and Africa Portable X-ray Devices Market Volume (K Unit), by Technology 2024 & 2032
- Figure 73: Middle East and Africa Portable X-ray Devices Market Revenue Share (%), by Technology 2024 & 2032
- Figure 74: Middle East and Africa Portable X-ray Devices Market Volume Share (%), by Technology 2024 & 2032
- Figure 75: Middle East and Africa Portable X-ray Devices Market Revenue (Million), by Application 2024 & 2032
- Figure 76: Middle East and Africa Portable X-ray Devices Market Volume (K Unit), by Application 2024 & 2032
- Figure 77: Middle East and Africa Portable X-ray Devices Market Revenue Share (%), by Application 2024 & 2032
- Figure 78: Middle East and Africa Portable X-ray Devices Market Volume Share (%), by Application 2024 & 2032
- Figure 79: Middle East and Africa Portable X-ray Devices Market Revenue (Million), by Modality 2024 & 2032
- Figure 80: Middle East and Africa Portable X-ray Devices Market Volume (K Unit), by Modality 2024 & 2032
- Figure 81: Middle East and Africa Portable X-ray Devices Market Revenue Share (%), by Modality 2024 & 2032
- Figure 82: Middle East and Africa Portable X-ray Devices Market Volume Share (%), by Modality 2024 & 2032
- Figure 83: Middle East and Africa Portable X-ray Devices Market Revenue (Million), by Country 2024 & 2032
- Figure 84: Middle East and Africa Portable X-ray Devices Market Volume (K Unit), by Country 2024 & 2032
- Figure 85: Middle East and Africa Portable X-ray Devices Market Revenue Share (%), by Country 2024 & 2032
- Figure 86: Middle East and Africa Portable X-ray Devices Market Volume Share (%), by Country 2024 & 2032
- Figure 87: South America Portable X-ray Devices Market Revenue (Million), by Technology 2024 & 2032
- Figure 88: South America Portable X-ray Devices Market Volume (K Unit), by Technology 2024 & 2032
- Figure 89: South America Portable X-ray Devices Market Revenue Share (%), by Technology 2024 & 2032
- Figure 90: South America Portable X-ray Devices Market Volume Share (%), by Technology 2024 & 2032
- Figure 91: South America Portable X-ray Devices Market Revenue (Million), by Application 2024 & 2032
- Figure 92: South America Portable X-ray Devices Market Volume (K Unit), by Application 2024 & 2032
- Figure 93: South America Portable X-ray Devices Market Revenue Share (%), by Application 2024 & 2032
- Figure 94: South America Portable X-ray Devices Market Volume Share (%), by Application 2024 & 2032
- Figure 95: South America Portable X-ray Devices Market Revenue (Million), by Modality 2024 & 2032
- Figure 96: South America Portable X-ray Devices Market Volume (K Unit), by Modality 2024 & 2032
- Figure 97: South America Portable X-ray Devices Market Revenue Share (%), by Modality 2024 & 2032
- Figure 98: South America Portable X-ray Devices Market Volume Share (%), by Modality 2024 & 2032
- Figure 99: South America Portable X-ray Devices Market Revenue (Million), by Country 2024 & 2032
- Figure 100: South America Portable X-ray Devices Market Volume (K Unit), by Country 2024 & 2032
- Figure 101: South America Portable X-ray Devices Market Revenue Share (%), by Country 2024 & 2032
- Figure 102: South America Portable X-ray Devices Market Volume Share (%), by Country 2024 & 2032
List of Tables
- Table 1: Global Portable X-ray Devices Market Revenue Million Forecast, by Region 2019 & 2032
- Table 2: Global Portable X-ray Devices Market Volume K Unit Forecast, by Region 2019 & 2032
- Table 3: Global Portable X-ray Devices Market Revenue Million Forecast, by Technology 2019 & 2032
- Table 4: Global Portable X-ray Devices Market Volume K Unit Forecast, by Technology 2019 & 2032
- Table 5: Global Portable X-ray Devices Market Revenue Million Forecast, by Application 2019 & 2032
- Table 6: Global Portable X-ray Devices Market Volume K Unit Forecast, by Application 2019 & 2032
- Table 7: Global Portable X-ray Devices Market Revenue Million Forecast, by Modality 2019 & 2032
- Table 8: Global Portable X-ray Devices Market Volume K Unit Forecast, by Modality 2019 & 2032
- Table 9: Global Portable X-ray Devices Market Revenue Million Forecast, by Region 2019 & 2032
- Table 10: Global Portable X-ray Devices Market Volume K Unit Forecast, by Region 2019 & 2032
- Table 11: Global Portable X-ray Devices Market Revenue Million Forecast, by Country 2019 & 2032
- Table 12: Global Portable X-ray Devices Market Volume K Unit Forecast, by Country 2019 & 2032
- Table 13: Global Portable X-ray Devices Market Revenue Million Forecast, by Country 2019 & 2032
- Table 14: Global Portable X-ray Devices Market Volume K Unit Forecast, by Country 2019 & 2032
- Table 15: Global Portable X-ray Devices Market Revenue Million Forecast, by Country 2019 & 2032
- Table 16: Global Portable X-ray Devices Market Volume K Unit Forecast, by Country 2019 & 2032
- Table 17: Global Portable X-ray Devices Market Revenue Million Forecast, by Country 2019 & 2032
- Table 18: Global Portable X-ray Devices Market Volume K Unit Forecast, by Country 2019 & 2032
- Table 19: Global Portable X-ray Devices Market Revenue Million Forecast, by Country 2019 & 2032
- Table 20: Global Portable X-ray Devices Market Volume K Unit Forecast, by Country 2019 & 2032
- Table 21: Global Portable X-ray Devices Market Revenue Million Forecast, by Technology 2019 & 2032
- Table 22: Global Portable X-ray Devices Market Volume K Unit Forecast, by Technology 2019 & 2032
- Table 23: Global Portable X-ray Devices Market Revenue Million Forecast, by Application 2019 & 2032
- Table 24: Global Portable X-ray Devices Market Volume K Unit Forecast, by Application 2019 & 2032
- Table 25: Global Portable X-ray Devices Market Revenue Million Forecast, by Modality 2019 & 2032
- Table 26: Global Portable X-ray Devices Market Volume K Unit Forecast, by Modality 2019 & 2032
- Table 27: Global Portable X-ray Devices Market Revenue Million Forecast, by Country 2019 & 2032
- Table 28: Global Portable X-ray Devices Market Volume K Unit Forecast, by Country 2019 & 2032
- Table 29: United States Portable X-ray Devices Market Revenue (Million) Forecast, by Application 2019 & 2032
- Table 30: United States Portable X-ray Devices Market Volume (K Unit) Forecast, by Application 2019 & 2032
- Table 31: Canada Portable X-ray Devices Market Revenue (Million) Forecast, by Application 2019 & 2032
- Table 32: Canada Portable X-ray Devices Market Volume (K Unit) Forecast, by Application 2019 & 2032
- Table 33: Mexico Portable X-ray Devices Market Revenue (Million) Forecast, by Application 2019 & 2032
- Table 34: Mexico Portable X-ray Devices Market Volume (K Unit) Forecast, by Application 2019 & 2032
- Table 35: Global Portable X-ray Devices Market Revenue Million Forecast, by Technology 2019 & 2032
- Table 36: Global Portable X-ray Devices Market Volume K Unit Forecast, by Technology 2019 & 2032
- Table 37: Global Portable X-ray Devices Market Revenue Million Forecast, by Application 2019 & 2032
- Table 38: Global Portable X-ray Devices Market Volume K Unit Forecast, by Application 2019 & 2032
- Table 39: Global Portable X-ray Devices Market Revenue Million Forecast, by Modality 2019 & 2032
- Table 40: Global Portable X-ray Devices Market Volume K Unit Forecast, by Modality 2019 & 2032
- Table 41: Global Portable X-ray Devices Market Revenue Million Forecast, by Country 2019 & 2032
- Table 42: Global Portable X-ray Devices Market Volume K Unit Forecast, by Country 2019 & 2032
- Table 43: Germany Portable X-ray Devices Market Revenue (Million) Forecast, by Application 2019 & 2032
- Table 44: Germany Portable X-ray Devices Market Volume (K Unit) Forecast, by Application 2019 & 2032
- Table 45: United Kingdom Portable X-ray Devices Market Revenue (Million) Forecast, by Application 2019 & 2032
- Table 46: United Kingdom Portable X-ray Devices Market Volume (K Unit) Forecast, by Application 2019 & 2032
- Table 47: France Portable X-ray Devices Market Revenue (Million) Forecast, by Application 2019 & 2032
- Table 48: France Portable X-ray Devices Market Volume (K Unit) Forecast, by Application 2019 & 2032
- Table 49: Italy Portable X-ray Devices Market Revenue (Million) Forecast, by Application 2019 & 2032
- Table 50: Italy Portable X-ray Devices Market Volume (K Unit) Forecast, by Application 2019 & 2032
- Table 51: Spain Portable X-ray Devices Market Revenue (Million) Forecast, by Application 2019 & 2032
- Table 52: Spain Portable X-ray Devices Market Volume (K Unit) Forecast, by Application 2019 & 2032
- Table 53: Rest of Europe Portable X-ray Devices Market Revenue (Million) Forecast, by Application 2019 & 2032
- Table 54: Rest of Europe Portable X-ray Devices Market Volume (K Unit) Forecast, by Application 2019 & 2032
- Table 55: Global Portable X-ray Devices Market Revenue Million Forecast, by Technology 2019 & 2032
- Table 56: Global Portable X-ray Devices Market Volume K Unit Forecast, by Technology 2019 & 2032
- Table 57: Global Portable X-ray Devices Market Revenue Million Forecast, by Application 2019 & 2032
- Table 58: Global Portable X-ray Devices Market Volume K Unit Forecast, by Application 2019 & 2032
- Table 59: Global Portable X-ray Devices Market Revenue Million Forecast, by Modality 2019 & 2032
- Table 60: Global Portable X-ray Devices Market Volume K Unit Forecast, by Modality 2019 & 2032
- Table 61: Global Portable X-ray Devices Market Revenue Million Forecast, by Country 2019 & 2032
- Table 62: Global Portable X-ray Devices Market Volume K Unit Forecast, by Country 2019 & 2032
- Table 63: China Portable X-ray Devices Market Revenue (Million) Forecast, by Application 2019 & 2032
- Table 64: China Portable X-ray Devices Market Volume (K Unit) Forecast, by Application 2019 & 2032
- Table 65: Japan Portable X-ray Devices Market Revenue (Million) Forecast, by Application 2019 & 2032
- Table 66: Japan Portable X-ray Devices Market Volume (K Unit) Forecast, by Application 2019 & 2032
- Table 67: India Portable X-ray Devices Market Revenue (Million) Forecast, by Application 2019 & 2032
- Table 68: India Portable X-ray Devices Market Volume (K Unit) Forecast, by Application 2019 & 2032
- Table 69: Australia Portable X-ray Devices Market Revenue (Million) Forecast, by Application 2019 & 2032
- Table 70: Australia Portable X-ray Devices Market Volume (K Unit) Forecast, by Application 2019 & 2032
- Table 71: South Korea Portable X-ray Devices Market Revenue (Million) Forecast, by Application 2019 & 2032
- Table 72: South Korea Portable X-ray Devices Market Volume (K Unit) Forecast, by Application 2019 & 2032
- Table 73: Rest of Asia Pacific Portable X-ray Devices Market Revenue (Million) Forecast, by Application 2019 & 2032
- Table 74: Rest of Asia Pacific Portable X-ray Devices Market Volume (K Unit) Forecast, by Application 2019 & 2032
- Table 75: Global Portable X-ray Devices Market Revenue Million Forecast, by Technology 2019 & 2032
- Table 76: Global Portable X-ray Devices Market Volume K Unit Forecast, by Technology 2019 & 2032
- Table 77: Global Portable X-ray Devices Market Revenue Million Forecast, by Application 2019 & 2032
- Table 78: Global Portable X-ray Devices Market Volume K Unit Forecast, by Application 2019 & 2032
- Table 79: Global Portable X-ray Devices Market Revenue Million Forecast, by Modality 2019 & 2032
- Table 80: Global Portable X-ray Devices Market Volume K Unit Forecast, by Modality 2019 & 2032
- Table 81: Global Portable X-ray Devices Market Revenue Million Forecast, by Country 2019 & 2032
- Table 82: Global Portable X-ray Devices Market Volume K Unit Forecast, by Country 2019 & 2032
- Table 83: GCC Portable X-ray Devices Market Revenue (Million) Forecast, by Application 2019 & 2032
- Table 84: GCC Portable X-ray Devices Market Volume (K Unit) Forecast, by Application 2019 & 2032
- Table 85: South Africa Portable X-ray Devices Market Revenue (Million) Forecast, by Application 2019 & 2032
- Table 86: South Africa Portable X-ray Devices Market Volume (K Unit) Forecast, by Application 2019 & 2032
- Table 87: Rest of Middle East and Africa Portable X-ray Devices Market Revenue (Million) Forecast, by Application 2019 & 2032
- Table 88: Rest of Middle East and Africa Portable X-ray Devices Market Volume (K Unit) Forecast, by Application 2019 & 2032
- Table 89: Global Portable X-ray Devices Market Revenue Million Forecast, by Technology 2019 & 2032
- Table 90: Global Portable X-ray Devices Market Volume K Unit Forecast, by Technology 2019 & 2032
- Table 91: Global Portable X-ray Devices Market Revenue Million Forecast, by Application 2019 & 2032
- Table 92: Global Portable X-ray Devices Market Volume K Unit Forecast, by Application 2019 & 2032
- Table 93: Global Portable X-ray Devices Market Revenue Million Forecast, by Modality 2019 & 2032
- Table 94: Global Portable X-ray Devices Market Volume K Unit Forecast, by Modality 2019 & 2032
- Table 95: Global Portable X-ray Devices Market Revenue Million Forecast, by Country 2019 & 2032
- Table 96: Global Portable X-ray Devices Market Volume K Unit Forecast, by Country 2019 & 2032
- Table 97: Brazil Portable X-ray Devices Market Revenue (Million) Forecast, by Application 2019 & 2032
- Table 98: Brazil Portable X-ray Devices Market Volume (K Unit) Forecast, by Application 2019 & 2032
- Table 99: Argentina Portable X-ray Devices Market Revenue (Million) Forecast, by Application 2019 & 2032
- Table 100: Argentina Portable X-ray Devices Market Volume (K Unit) Forecast, by Application 2019 & 2032
- Table 101: Rest of South America Portable X-ray Devices Market Revenue (Million) Forecast, by Application 2019 & 2032
- Table 102: Rest of South America Portable X-ray Devices Market Volume (K Unit) Forecast, by Application 2019 & 2032
Frequently Asked Questions
1. What is the projected Compound Annual Growth Rate (CAGR) of the Portable X-ray Devices Market?
The projected CAGR is approximately 9.18%.
2. Which companies are prominent players in the Portable X-ray Devices Market?
Key companies in the market include GE Healthcare, Canon Medical System, Carestream Health Inc, Siemens Healthineers AG, FUJIFILM Holdings Corporation, Koninklijke Philips NV, Envista Holdings Corporation (KaVo Dental GmbH), Shimadzu Corporations, MinXray.
3. What are the main segments of the Portable X-ray Devices Market?
The market segments include Technology, Application, Modality.
4. Can you provide details about the market size?
The market size is estimated to be USD 8.40 Million as of 2022.
5. What are some drivers contributing to market growth?
Technological Advancements; Growing Geriatric Population and Increasing Prevalence of Vascular Diseases; Huge Funding for R&D of Portable Technologies by Private Players and Governments.
6. What are the notable trends driving market growth?
Digital X-ray Segment is Expected to Witness Significant Growth Over the Forecast Period.
7. Are there any restraints impacting market growth?
Stringent Regulatory Scenario; High Risk of Radiation Exposure.
8. Can you provide examples of recent developments in the market?
July 2022: Fujifilm Europe launched a new hybrid C-arm and portable x-ray device. The device, called FDR Cross, is designed to offer high-quality fluoroscopic and static x-ray images during surgery and other medical procedures.
9. What pricing options are available for accessing the report?
Pricing options include single-user, multi-user, and enterprise licenses priced at USD 4750, USD 5250, and USD 8750 respectively.
10. Is the market size provided in terms of value or volume?
The market size is provided in terms of value, measured in Million and volume, measured in K Unit.
11. Are there any specific market keywords associated with the report?
Yes, the market keyword associated with the report is "Portable X-ray Devices Market," which aids in identifying and referencing the specific market segment covered.
12. How do I determine which pricing option suits my needs best?
The pricing options vary based on user requirements and access needs. Individual users may opt for single-user licenses, while businesses requiring broader access may choose multi-user or enterprise licenses for cost-effective access to the report.
13. Are there any additional resources or data provided in the Portable X-ray Devices Market report?
While the report offers comprehensive insights, it's advisable to review the specific contents or supplementary materials provided to ascertain if additional resources or data are available.
14. How can I stay updated on further developments or reports in the Portable X-ray Devices Market?
To stay informed about further developments, trends, and reports in the Portable X-ray Devices Market, consider subscribing to industry newsletters, following relevant companies and organizations, or regularly checking reputable industry news sources and publications.
Methodology
Step 1 - Identification of Relevant Samples Size from Population Database


Step 2 - Approaches for Defining Global Market Size (Value, Volume* & Price*)

Note*: In applicable scenarios
Step 3 - Data Sources
Primary Research
- Web Analytics
- Survey Reports
- Research Institute
- Latest Research Reports
- Opinion Leaders
Secondary Research
- Annual Reports
- White Paper
- Latest Press Release
- Industry Association
- Paid Database
- Investor Presentations

Step 4 - Data Triangulation
Involves using different sources of information in order to increase the validity of a study
These sources are likely to be stakeholders in a program - participants, other researchers, program staff, other community members, and so on.
Then we put all data in single framework & apply various statistical tools to find out the dynamic on the market.
During the analysis stage, feedback from the stakeholder groups would be compared to determine areas of agreement as well as areas of divergence


