
Key Insights
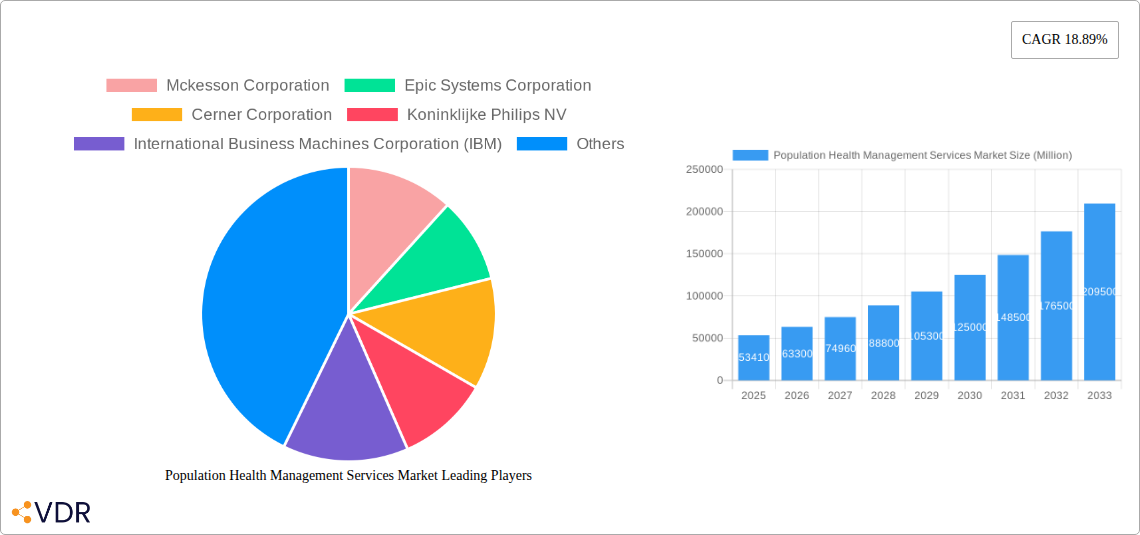
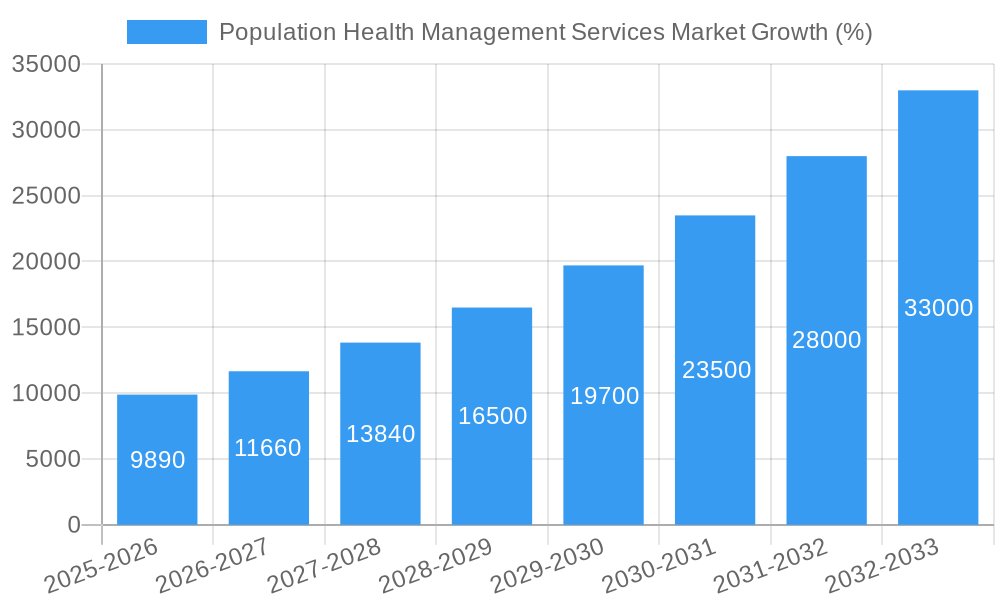
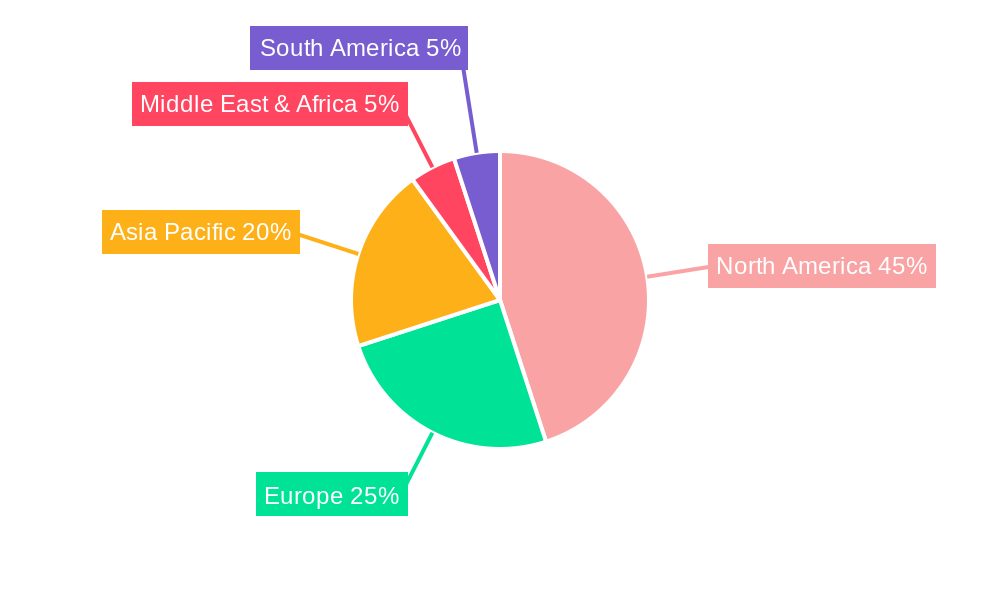
The Population Health Management (PHM) services market, valued at $53.41 billion in 2025, is experiencing robust growth, projected to expand at a Compound Annual Growth Rate (CAGR) of 18.89% from 2025 to 2033. This surge is driven by several key factors. The increasing prevalence of chronic diseases globally necessitates proactive and preventative healthcare strategies, fueling demand for PHM solutions. Furthermore, the shift towards value-based care models, emphasizing improved patient outcomes and reduced healthcare costs, is significantly impacting market growth. Technological advancements, particularly in data analytics, AI, and telehealth, are enabling more effective population health management, leading to better patient engagement, improved care coordination, and more efficient resource allocation. Government initiatives promoting preventative care and the adoption of electronic health records (EHRs) further contribute to market expansion. The market is segmented by component (software, hardware, services), delivery mode (on-premise, cloud-based/web-based), and end-user (payers, providers), offering diverse solutions to meet varied healthcare needs. North America currently holds a significant market share due to advanced healthcare infrastructure and high technological adoption rates. However, the Asia-Pacific region is poised for substantial growth, driven by increasing healthcare spending and rising awareness of PHM benefits.
The competitive landscape is marked by the presence of both established players and emerging companies. Major players like McKesson, Epic Systems, Cerner, Philips, IBM, Optum, Health Catalyst, Allscripts, and Conifer Health Solutions are constantly innovating and expanding their PHM offerings. The market is characterized by strategic partnerships, mergers and acquisitions, and continuous technological advancements. Despite the positive growth trajectory, challenges such as data privacy concerns, interoperability issues between different healthcare systems, and the need for skilled professionals to implement and manage PHM solutions remain. Overcoming these challenges will be crucial for sustained market growth in the coming years. The forecast period from 2025-2033 anticipates a significant expansion, fueled by continued technological innovation, increasing adoption of value-based care, and the ongoing need for efficient and cost-effective healthcare solutions.
Population Health Management Services Market: A Comprehensive Report (2019-2033)
This in-depth report provides a comprehensive analysis of the Population Health Management Services market, encompassing market dynamics, growth trends, regional analysis, competitive landscape, and future outlook. The study period covers 2019-2033, with 2025 as the base and estimated year. The forecast period extends from 2025 to 2033, building upon historical data from 2019-2024. This report is an invaluable resource for healthcare providers, payers, technology vendors, and investors seeking to understand and capitalize on the opportunities within this rapidly evolving market. The market size is projected to reach xx Million by 2033.
Population Health Management Services Market Market Dynamics & Structure
The Population Health Management (PHM) Services market is characterized by moderate concentration, with key players like McKesson Corporation, Epic Systems Corporation, and Cerner Corporation holding significant market share. Technological innovation, driven by advancements in AI, big data analytics, and cloud computing, is a major growth driver. Stringent regulatory frameworks, particularly HIPAA compliance in the US, shape market dynamics. The market faces competition from traditional healthcare management approaches, but the increasing focus on value-based care is fueling adoption. Furthermore, M&A activity is prevalent, with larger companies acquiring smaller firms to expand their capabilities and market reach. The overall market shows a consolidated nature.
- Market Concentration: Moderately consolidated, with top 5 players holding approximately xx% of market share in 2025.
- Technological Innovation: AI, machine learning, and cloud-based solutions are key drivers.
- Regulatory Landscape: HIPAA and other regulations significantly influence market development and adoption.
- Competitive Substitutes: Traditional healthcare management approaches pose competition.
- M&A Activity: Significant M&A activity observed in the historical period with xx deals recorded between 2019-2024, with an estimated xx deals projected from 2025-2033.
- End-User Demographics: Shift towards value-based care is increasing demand across both payer and provider segments.
Population Health Management Services Market Growth Trends & Insights
The PHM Services market exhibits robust growth, driven by factors such as the rising prevalence of chronic diseases, increasing healthcare costs, and a growing emphasis on preventative care and improved patient outcomes. The market has seen significant expansion since 2019, showcasing a Compound Annual Growth Rate (CAGR) of xx% during the historical period (2019-2024). This growth is expected to continue, with a projected CAGR of xx% during the forecast period (2025-2033). Technological advancements like AI-powered predictive analytics enhance the effectiveness of PHM programs. The adoption rate of cloud-based solutions is increasing significantly, fueling market expansion. Consumer behavior is shifting towards personalized and proactive healthcare management, further driving demand. Market penetration is projected to increase from xx% in 2025 to xx% by 2033.
Dominant Regions, Countries, or Segments in Population Health Management Services Market
The North American region currently dominates the PHM Services market, driven by high healthcare expenditure, advanced technological infrastructure, and early adoption of value-based care models. Within North America, the United States holds the largest market share. The cloud-based/web-based delivery mode is experiencing the fastest growth, owing to its scalability, cost-effectiveness, and accessibility. The Software component holds the largest market share due to the increasing demand for advanced analytics and data management solutions. Providers constitute the largest end-user segment, followed by payers, reflecting the crucial role of providers in implementing and benefiting from PHM initiatives.
- North America: Dominant region due to high healthcare spending, advanced technology, and early adoption of value-based care.
- Cloud-based/Web-based Delivery Mode: Fastest-growing segment due to scalability and cost-effectiveness.
- Software Component: Largest market share due to the need for advanced analytics and data management.
- Providers: Largest end-user segment, reflecting their role in implementing PHM initiatives.
Population Health Management Services Market Product Landscape
The PHM Services market offers a diverse range of products, including software platforms for population health management, hardware infrastructure for data storage and analysis, and various services such as data analytics, care coordination, and clinical decision support. Innovative solutions incorporate AI and machine learning for predictive analytics, risk stratification, and personalized interventions. Key performance indicators include improved patient outcomes, reduced healthcare costs, and enhanced care coordination. The unique selling propositions frequently center around improved data visualization, predictive capabilities, and seamless integration with existing healthcare IT infrastructure.
Key Drivers, Barriers & Challenges in Population Health Management Services Market
Key Drivers: The increasing prevalence of chronic diseases, rising healthcare costs, the shift towards value-based care, and the growing adoption of advanced technologies are key drivers. Government initiatives supporting PHM adoption further accelerate market growth.
Key Challenges: High implementation costs, data interoperability issues, a shortage of skilled professionals, and concerns about data privacy and security pose challenges. Regulatory hurdles and complex reimbursement models also hinder market expansion.
Emerging Opportunities in Population Health Management Services Market
Untapped markets in emerging economies present significant opportunities. The integration of wearable technology and telehealth platforms within PHM initiatives creates new avenues for growth. The demand for personalized and preventative care is also driving innovation and expanding market opportunities.
Growth Accelerators in the Population Health Management Services Market Industry
Technological advancements, particularly in AI and big data analytics, are accelerating market growth. Strategic partnerships between healthcare providers, payers, and technology companies are fostering innovation and market expansion. Government initiatives supporting PHM adoption and increased investments in healthcare infrastructure are also significant growth catalysts.
Key Players Shaping the Population Health Management Services Market Market
- Mckesson Corporation
- Epic Systems Corporation
- Cerner Corporation
- Koninklijke Philips NV
- International Business Machines Corporation (IBM)
- Optum Inc
- Health Catalyst
- Allscripts Healthcare Solutions Inc
- Conifer Health Solutions
Notable Milestones in Population Health Management Services Market Sector
- 2020: Increased adoption of telehealth solutions due to the COVID-19 pandemic.
- 2021: Several key players launched new AI-powered analytics platforms for PHM.
- 2022: Significant investments in cloud-based PHM solutions observed.
- 2023: Several mergers and acquisitions occurred to expand market reach and product portfolios.
In-Depth Population Health Management Services Market Market Outlook
The PHM Services market is poised for sustained growth, driven by ongoing technological advancements, increasing demand for value-based care, and expanding global healthcare infrastructure. Strategic partnerships and collaborations are expected to become more prevalent, further fueling innovation and market expansion. The focus will shift towards personalized medicine and proactive healthcare management, creating new opportunities for growth and market diversification.
Population Health Management Services Market Segmentation
-
1. Component
- 1.1. Software
- 1.2. Hardware
- 1.3. Services
-
2. Delivery Mode
- 2.1. On-premise
- 2.2. Cloud-based/Web-based
-
3. End-User
- 3.1. Payers
- 3.2. Providers
Population Health Management Services Market Segmentation By Geography
-
1. North America
- 1.1. United States
- 1.2. Canada
- 1.3. Mexico
-
2. Europe
- 2.1. Germany
- 2.2. United Kingdom
- 2.3. France
- 2.4. Italy
- 2.5. Spain
- 2.6. Rest of Europe
-
3. Asia Pacific
- 3.1. China
- 3.2. Japan
- 3.3. India
- 3.4. Australia
- 3.5. South Korea
- 3.6. Rest of Asia Pacific
- 4. Middle East
-
5. GCC
- 5.1. South Africa
- 5.2. Rest of Middle East
-
6. South America
- 6.1. Brazil
- 6.2. Argentina
- 6.3. Rest of South America
Population Health Management Services Market REPORT HIGHLIGHTS
| Aspects | Details |
|---|---|
| Study Period | 2019-2033 |
| Base Year | 2024 |
| Estimated Year | 2025 |
| Forecast Period | 2025-2033 |
| Historical Period | 2019-2024 |
| Growth Rate | CAGR of 18.89% from 2019-2033 |
| Segmentation |
|
Table of Contents
- 1. Introduction
- 1.1. Research Scope
- 1.2. Market Segmentation
- 1.3. Research Methodology
- 1.4. Definitions and Assumptions
- 2. Executive Summary
- 2.1. Introduction
- 3. Market Dynamics
- 3.1. Introduction
- 3.2. Market Drivers
- 3.2.1. ; Need to Build a Comprehensive Single Platform for Patient Record and Management; Rising Population Suffering from Chronic Diseases Requires Long Period of Surveillance; Increasing Support and Investments from Public and Private Organizations
- 3.3. Market Restrains
- 3.3.1. ; Need for Multi-disciplinary Teams for Effective Implementation; Reimbursement Issues
- 3.4. Market Trends
- 3.4.1. Cloud-based Segment is Found Dominating the Population Health Management Market
- 4. Market Factor Analysis
- 4.1. Porters Five Forces
- 4.2. Supply/Value Chain
- 4.3. PESTEL analysis
- 4.4. Market Entropy
- 4.5. Patent/Trademark Analysis
- 5. Global Population Health Management Services Market Analysis, Insights and Forecast, 2019-2031
- 5.1. Market Analysis, Insights and Forecast - by Component
- 5.1.1. Software
- 5.1.2. Hardware
- 5.1.3. Services
- 5.2. Market Analysis, Insights and Forecast - by Delivery Mode
- 5.2.1. On-premise
- 5.2.2. Cloud-based/Web-based
- 5.3. Market Analysis, Insights and Forecast - by End-User
- 5.3.1. Payers
- 5.3.2. Providers
- 5.4. Market Analysis, Insights and Forecast - by Region
- 5.4.1. North America
- 5.4.2. Europe
- 5.4.3. Asia Pacific
- 5.4.4. Middle East
- 5.4.5. GCC
- 5.4.6. South America
- 5.1. Market Analysis, Insights and Forecast - by Component
- 6. North America Population Health Management Services Market Analysis, Insights and Forecast, 2019-2031
- 6.1. Market Analysis, Insights and Forecast - by Component
- 6.1.1. Software
- 6.1.2. Hardware
- 6.1.3. Services
- 6.2. Market Analysis, Insights and Forecast - by Delivery Mode
- 6.2.1. On-premise
- 6.2.2. Cloud-based/Web-based
- 6.3. Market Analysis, Insights and Forecast - by End-User
- 6.3.1. Payers
- 6.3.2. Providers
- 6.1. Market Analysis, Insights and Forecast - by Component
- 7. Europe Population Health Management Services Market Analysis, Insights and Forecast, 2019-2031
- 7.1. Market Analysis, Insights and Forecast - by Component
- 7.1.1. Software
- 7.1.2. Hardware
- 7.1.3. Services
- 7.2. Market Analysis, Insights and Forecast - by Delivery Mode
- 7.2.1. On-premise
- 7.2.2. Cloud-based/Web-based
- 7.3. Market Analysis, Insights and Forecast - by End-User
- 7.3.1. Payers
- 7.3.2. Providers
- 7.1. Market Analysis, Insights and Forecast - by Component
- 8. Asia Pacific Population Health Management Services Market Analysis, Insights and Forecast, 2019-2031
- 8.1. Market Analysis, Insights and Forecast - by Component
- 8.1.1. Software
- 8.1.2. Hardware
- 8.1.3. Services
- 8.2. Market Analysis, Insights and Forecast - by Delivery Mode
- 8.2.1. On-premise
- 8.2.2. Cloud-based/Web-based
- 8.3. Market Analysis, Insights and Forecast - by End-User
- 8.3.1. Payers
- 8.3.2. Providers
- 8.1. Market Analysis, Insights and Forecast - by Component
- 9. Middle East Population Health Management Services Market Analysis, Insights and Forecast, 2019-2031
- 9.1. Market Analysis, Insights and Forecast - by Component
- 9.1.1. Software
- 9.1.2. Hardware
- 9.1.3. Services
- 9.2. Market Analysis, Insights and Forecast - by Delivery Mode
- 9.2.1. On-premise
- 9.2.2. Cloud-based/Web-based
- 9.3. Market Analysis, Insights and Forecast - by End-User
- 9.3.1. Payers
- 9.3.2. Providers
- 9.1. Market Analysis, Insights and Forecast - by Component
- 10. GCC Population Health Management Services Market Analysis, Insights and Forecast, 2019-2031
- 10.1. Market Analysis, Insights and Forecast - by Component
- 10.1.1. Software
- 10.1.2. Hardware
- 10.1.3. Services
- 10.2. Market Analysis, Insights and Forecast - by Delivery Mode
- 10.2.1. On-premise
- 10.2.2. Cloud-based/Web-based
- 10.3. Market Analysis, Insights and Forecast - by End-User
- 10.3.1. Payers
- 10.3.2. Providers
- 10.1. Market Analysis, Insights and Forecast - by Component
- 11. South America Population Health Management Services Market Analysis, Insights and Forecast, 2019-2031
- 11.1. Market Analysis, Insights and Forecast - by Component
- 11.1.1. Software
- 11.1.2. Hardware
- 11.1.3. Services
- 11.2. Market Analysis, Insights and Forecast - by Delivery Mode
- 11.2.1. On-premise
- 11.2.2. Cloud-based/Web-based
- 11.3. Market Analysis, Insights and Forecast - by End-User
- 11.3.1. Payers
- 11.3.2. Providers
- 11.1. Market Analysis, Insights and Forecast - by Component
- 12. North America Population Health Management Services Market Analysis, Insights and Forecast, 2019-2031
- 12.1. Market Analysis, Insights and Forecast - By Country/Sub-region
- 12.1.1 United States
- 12.1.2 Canada
- 12.1.3 Mexico
- 13. Europe Population Health Management Services Market Analysis, Insights and Forecast, 2019-2031
- 13.1. Market Analysis, Insights and Forecast - By Country/Sub-region
- 13.1.1 Germany
- 13.1.2 United Kingdom
- 13.1.3 France
- 13.1.4 Italy
- 13.1.5 Spain
- 13.1.6 Rest of Europe
- 14. Asia Pacific Population Health Management Services Market Analysis, Insights and Forecast, 2019-2031
- 14.1. Market Analysis, Insights and Forecast - By Country/Sub-region
- 14.1.1 China
- 14.1.2 Japan
- 14.1.3 India
- 14.1.4 Australia
- 14.1.5 South Korea
- 14.1.6 Rest of Asia Pacific
- 15. Middle East Population Health Management Services Market Analysis, Insights and Forecast, 2019-2031
- 15.1. Market Analysis, Insights and Forecast - By Country/Sub-region
- 15.1.1.
- 16. GCC Population Health Management Services Market Analysis, Insights and Forecast, 2019-2031
- 16.1. Market Analysis, Insights and Forecast - By Country/Sub-region
- 16.1.1 South Africa
- 16.1.2 Rest of Middle East
- 17. South America Population Health Management Services Market Analysis, Insights and Forecast, 2019-2031
- 17.1. Market Analysis, Insights and Forecast - By Country/Sub-region
- 17.1.1 Brazil
- 17.1.2 Argentina
- 17.1.3 Rest of South America
- 18. Competitive Analysis
- 18.1. Global Market Share Analysis 2024
- 18.2. Company Profiles
- 18.2.1 Mckesson Corporation
- 18.2.1.1. Overview
- 18.2.1.2. Products
- 18.2.1.3. SWOT Analysis
- 18.2.1.4. Recent Developments
- 18.2.1.5. Financials (Based on Availability)
- 18.2.2 Epic Systems Corporation
- 18.2.2.1. Overview
- 18.2.2.2. Products
- 18.2.2.3. SWOT Analysis
- 18.2.2.4. Recent Developments
- 18.2.2.5. Financials (Based on Availability)
- 18.2.3 Cerner Corporation
- 18.2.3.1. Overview
- 18.2.3.2. Products
- 18.2.3.3. SWOT Analysis
- 18.2.3.4. Recent Developments
- 18.2.3.5. Financials (Based on Availability)
- 18.2.4 Koninklijke Philips NV
- 18.2.4.1. Overview
- 18.2.4.2. Products
- 18.2.4.3. SWOT Analysis
- 18.2.4.4. Recent Developments
- 18.2.4.5. Financials (Based on Availability)
- 18.2.5 International Business Machines Corporation (IBM)
- 18.2.5.1. Overview
- 18.2.5.2. Products
- 18.2.5.3. SWOT Analysis
- 18.2.5.4. Recent Developments
- 18.2.5.5. Financials (Based on Availability)
- 18.2.6 Optum Inc
- 18.2.6.1. Overview
- 18.2.6.2. Products
- 18.2.6.3. SWOT Analysis
- 18.2.6.4. Recent Developments
- 18.2.6.5. Financials (Based on Availability)
- 18.2.7 Health Catalyst
- 18.2.7.1. Overview
- 18.2.7.2. Products
- 18.2.7.3. SWOT Analysis
- 18.2.7.4. Recent Developments
- 18.2.7.5. Financials (Based on Availability)
- 18.2.8 Allscripts Healthcare Solutions Inc
- 18.2.8.1. Overview
- 18.2.8.2. Products
- 18.2.8.3. SWOT Analysis
- 18.2.8.4. Recent Developments
- 18.2.8.5. Financials (Based on Availability)
- 18.2.9 Conifer Health Solutions
- 18.2.9.1. Overview
- 18.2.9.2. Products
- 18.2.9.3. SWOT Analysis
- 18.2.9.4. Recent Developments
- 18.2.9.5. Financials (Based on Availability)
- 18.2.1 Mckesson Corporation
List of Figures
- Figure 1: Global Population Health Management Services Market Revenue Breakdown (Million, %) by Region 2024 & 2032
- Figure 2: Global Population Health Management Services Market Volume Breakdown (K Unit, %) by Region 2024 & 2032
- Figure 3: North America Population Health Management Services Market Revenue (Million), by Country 2024 & 2032
- Figure 4: North America Population Health Management Services Market Volume (K Unit), by Country 2024 & 2032
- Figure 5: North America Population Health Management Services Market Revenue Share (%), by Country 2024 & 2032
- Figure 6: North America Population Health Management Services Market Volume Share (%), by Country 2024 & 2032
- Figure 7: Europe Population Health Management Services Market Revenue (Million), by Country 2024 & 2032
- Figure 8: Europe Population Health Management Services Market Volume (K Unit), by Country 2024 & 2032
- Figure 9: Europe Population Health Management Services Market Revenue Share (%), by Country 2024 & 2032
- Figure 10: Europe Population Health Management Services Market Volume Share (%), by Country 2024 & 2032
- Figure 11: Asia Pacific Population Health Management Services Market Revenue (Million), by Country 2024 & 2032
- Figure 12: Asia Pacific Population Health Management Services Market Volume (K Unit), by Country 2024 & 2032
- Figure 13: Asia Pacific Population Health Management Services Market Revenue Share (%), by Country 2024 & 2032
- Figure 14: Asia Pacific Population Health Management Services Market Volume Share (%), by Country 2024 & 2032
- Figure 15: Middle East Population Health Management Services Market Revenue (Million), by Country 2024 & 2032
- Figure 16: Middle East Population Health Management Services Market Volume (K Unit), by Country 2024 & 2032
- Figure 17: Middle East Population Health Management Services Market Revenue Share (%), by Country 2024 & 2032
- Figure 18: Middle East Population Health Management Services Market Volume Share (%), by Country 2024 & 2032
- Figure 19: GCC Population Health Management Services Market Revenue (Million), by Country 2024 & 2032
- Figure 20: GCC Population Health Management Services Market Volume (K Unit), by Country 2024 & 2032
- Figure 21: GCC Population Health Management Services Market Revenue Share (%), by Country 2024 & 2032
- Figure 22: GCC Population Health Management Services Market Volume Share (%), by Country 2024 & 2032
- Figure 23: South America Population Health Management Services Market Revenue (Million), by Country 2024 & 2032
- Figure 24: South America Population Health Management Services Market Volume (K Unit), by Country 2024 & 2032
- Figure 25: South America Population Health Management Services Market Revenue Share (%), by Country 2024 & 2032
- Figure 26: South America Population Health Management Services Market Volume Share (%), by Country 2024 & 2032
- Figure 27: North America Population Health Management Services Market Revenue (Million), by Component 2024 & 2032
- Figure 28: North America Population Health Management Services Market Volume (K Unit), by Component 2024 & 2032
- Figure 29: North America Population Health Management Services Market Revenue Share (%), by Component 2024 & 2032
- Figure 30: North America Population Health Management Services Market Volume Share (%), by Component 2024 & 2032
- Figure 31: North America Population Health Management Services Market Revenue (Million), by Delivery Mode 2024 & 2032
- Figure 32: North America Population Health Management Services Market Volume (K Unit), by Delivery Mode 2024 & 2032
- Figure 33: North America Population Health Management Services Market Revenue Share (%), by Delivery Mode 2024 & 2032
- Figure 34: North America Population Health Management Services Market Volume Share (%), by Delivery Mode 2024 & 2032
- Figure 35: North America Population Health Management Services Market Revenue (Million), by End-User 2024 & 2032
- Figure 36: North America Population Health Management Services Market Volume (K Unit), by End-User 2024 & 2032
- Figure 37: North America Population Health Management Services Market Revenue Share (%), by End-User 2024 & 2032
- Figure 38: North America Population Health Management Services Market Volume Share (%), by End-User 2024 & 2032
- Figure 39: North America Population Health Management Services Market Revenue (Million), by Country 2024 & 2032
- Figure 40: North America Population Health Management Services Market Volume (K Unit), by Country 2024 & 2032
- Figure 41: North America Population Health Management Services Market Revenue Share (%), by Country 2024 & 2032
- Figure 42: North America Population Health Management Services Market Volume Share (%), by Country 2024 & 2032
- Figure 43: Europe Population Health Management Services Market Revenue (Million), by Component 2024 & 2032
- Figure 44: Europe Population Health Management Services Market Volume (K Unit), by Component 2024 & 2032
- Figure 45: Europe Population Health Management Services Market Revenue Share (%), by Component 2024 & 2032
- Figure 46: Europe Population Health Management Services Market Volume Share (%), by Component 2024 & 2032
- Figure 47: Europe Population Health Management Services Market Revenue (Million), by Delivery Mode 2024 & 2032
- Figure 48: Europe Population Health Management Services Market Volume (K Unit), by Delivery Mode 2024 & 2032
- Figure 49: Europe Population Health Management Services Market Revenue Share (%), by Delivery Mode 2024 & 2032
- Figure 50: Europe Population Health Management Services Market Volume Share (%), by Delivery Mode 2024 & 2032
- Figure 51: Europe Population Health Management Services Market Revenue (Million), by End-User 2024 & 2032
- Figure 52: Europe Population Health Management Services Market Volume (K Unit), by End-User 2024 & 2032
- Figure 53: Europe Population Health Management Services Market Revenue Share (%), by End-User 2024 & 2032
- Figure 54: Europe Population Health Management Services Market Volume Share (%), by End-User 2024 & 2032
- Figure 55: Europe Population Health Management Services Market Revenue (Million), by Country 2024 & 2032
- Figure 56: Europe Population Health Management Services Market Volume (K Unit), by Country 2024 & 2032
- Figure 57: Europe Population Health Management Services Market Revenue Share (%), by Country 2024 & 2032
- Figure 58: Europe Population Health Management Services Market Volume Share (%), by Country 2024 & 2032
- Figure 59: Asia Pacific Population Health Management Services Market Revenue (Million), by Component 2024 & 2032
- Figure 60: Asia Pacific Population Health Management Services Market Volume (K Unit), by Component 2024 & 2032
- Figure 61: Asia Pacific Population Health Management Services Market Revenue Share (%), by Component 2024 & 2032
- Figure 62: Asia Pacific Population Health Management Services Market Volume Share (%), by Component 2024 & 2032
- Figure 63: Asia Pacific Population Health Management Services Market Revenue (Million), by Delivery Mode 2024 & 2032
- Figure 64: Asia Pacific Population Health Management Services Market Volume (K Unit), by Delivery Mode 2024 & 2032
- Figure 65: Asia Pacific Population Health Management Services Market Revenue Share (%), by Delivery Mode 2024 & 2032
- Figure 66: Asia Pacific Population Health Management Services Market Volume Share (%), by Delivery Mode 2024 & 2032
- Figure 67: Asia Pacific Population Health Management Services Market Revenue (Million), by End-User 2024 & 2032
- Figure 68: Asia Pacific Population Health Management Services Market Volume (K Unit), by End-User 2024 & 2032
- Figure 69: Asia Pacific Population Health Management Services Market Revenue Share (%), by End-User 2024 & 2032
- Figure 70: Asia Pacific Population Health Management Services Market Volume Share (%), by End-User 2024 & 2032
- Figure 71: Asia Pacific Population Health Management Services Market Revenue (Million), by Country 2024 & 2032
- Figure 72: Asia Pacific Population Health Management Services Market Volume (K Unit), by Country 2024 & 2032
- Figure 73: Asia Pacific Population Health Management Services Market Revenue Share (%), by Country 2024 & 2032
- Figure 74: Asia Pacific Population Health Management Services Market Volume Share (%), by Country 2024 & 2032
- Figure 75: Middle East Population Health Management Services Market Revenue (Million), by Component 2024 & 2032
- Figure 76: Middle East Population Health Management Services Market Volume (K Unit), by Component 2024 & 2032
- Figure 77: Middle East Population Health Management Services Market Revenue Share (%), by Component 2024 & 2032
- Figure 78: Middle East Population Health Management Services Market Volume Share (%), by Component 2024 & 2032
- Figure 79: Middle East Population Health Management Services Market Revenue (Million), by Delivery Mode 2024 & 2032
- Figure 80: Middle East Population Health Management Services Market Volume (K Unit), by Delivery Mode 2024 & 2032
- Figure 81: Middle East Population Health Management Services Market Revenue Share (%), by Delivery Mode 2024 & 2032
- Figure 82: Middle East Population Health Management Services Market Volume Share (%), by Delivery Mode 2024 & 2032
- Figure 83: Middle East Population Health Management Services Market Revenue (Million), by End-User 2024 & 2032
- Figure 84: Middle East Population Health Management Services Market Volume (K Unit), by End-User 2024 & 2032
- Figure 85: Middle East Population Health Management Services Market Revenue Share (%), by End-User 2024 & 2032
- Figure 86: Middle East Population Health Management Services Market Volume Share (%), by End-User 2024 & 2032
- Figure 87: Middle East Population Health Management Services Market Revenue (Million), by Country 2024 & 2032
- Figure 88: Middle East Population Health Management Services Market Volume (K Unit), by Country 2024 & 2032
- Figure 89: Middle East Population Health Management Services Market Revenue Share (%), by Country 2024 & 2032
- Figure 90: Middle East Population Health Management Services Market Volume Share (%), by Country 2024 & 2032
- Figure 91: GCC Population Health Management Services Market Revenue (Million), by Component 2024 & 2032
- Figure 92: GCC Population Health Management Services Market Volume (K Unit), by Component 2024 & 2032
- Figure 93: GCC Population Health Management Services Market Revenue Share (%), by Component 2024 & 2032
- Figure 94: GCC Population Health Management Services Market Volume Share (%), by Component 2024 & 2032
- Figure 95: GCC Population Health Management Services Market Revenue (Million), by Delivery Mode 2024 & 2032
- Figure 96: GCC Population Health Management Services Market Volume (K Unit), by Delivery Mode 2024 & 2032
- Figure 97: GCC Population Health Management Services Market Revenue Share (%), by Delivery Mode 2024 & 2032
- Figure 98: GCC Population Health Management Services Market Volume Share (%), by Delivery Mode 2024 & 2032
- Figure 99: GCC Population Health Management Services Market Revenue (Million), by End-User 2024 & 2032
- Figure 100: GCC Population Health Management Services Market Volume (K Unit), by End-User 2024 & 2032
- Figure 101: GCC Population Health Management Services Market Revenue Share (%), by End-User 2024 & 2032
- Figure 102: GCC Population Health Management Services Market Volume Share (%), by End-User 2024 & 2032
- Figure 103: GCC Population Health Management Services Market Revenue (Million), by Country 2024 & 2032
- Figure 104: GCC Population Health Management Services Market Volume (K Unit), by Country 2024 & 2032
- Figure 105: GCC Population Health Management Services Market Revenue Share (%), by Country 2024 & 2032
- Figure 106: GCC Population Health Management Services Market Volume Share (%), by Country 2024 & 2032
- Figure 107: South America Population Health Management Services Market Revenue (Million), by Component 2024 & 2032
- Figure 108: South America Population Health Management Services Market Volume (K Unit), by Component 2024 & 2032
- Figure 109: South America Population Health Management Services Market Revenue Share (%), by Component 2024 & 2032
- Figure 110: South America Population Health Management Services Market Volume Share (%), by Component 2024 & 2032
- Figure 111: South America Population Health Management Services Market Revenue (Million), by Delivery Mode 2024 & 2032
- Figure 112: South America Population Health Management Services Market Volume (K Unit), by Delivery Mode 2024 & 2032
- Figure 113: South America Population Health Management Services Market Revenue Share (%), by Delivery Mode 2024 & 2032
- Figure 114: South America Population Health Management Services Market Volume Share (%), by Delivery Mode 2024 & 2032
- Figure 115: South America Population Health Management Services Market Revenue (Million), by End-User 2024 & 2032
- Figure 116: South America Population Health Management Services Market Volume (K Unit), by End-User 2024 & 2032
- Figure 117: South America Population Health Management Services Market Revenue Share (%), by End-User 2024 & 2032
- Figure 118: South America Population Health Management Services Market Volume Share (%), by End-User 2024 & 2032
- Figure 119: South America Population Health Management Services Market Revenue (Million), by Country 2024 & 2032
- Figure 120: South America Population Health Management Services Market Volume (K Unit), by Country 2024 & 2032
- Figure 121: South America Population Health Management Services Market Revenue Share (%), by Country 2024 & 2032
- Figure 122: South America Population Health Management Services Market Volume Share (%), by Country 2024 & 2032
List of Tables
- Table 1: Global Population Health Management Services Market Revenue Million Forecast, by Region 2019 & 2032
- Table 2: Global Population Health Management Services Market Volume K Unit Forecast, by Region 2019 & 2032
- Table 3: Global Population Health Management Services Market Revenue Million Forecast, by Component 2019 & 2032
- Table 4: Global Population Health Management Services Market Volume K Unit Forecast, by Component 2019 & 2032
- Table 5: Global Population Health Management Services Market Revenue Million Forecast, by Delivery Mode 2019 & 2032
- Table 6: Global Population Health Management Services Market Volume K Unit Forecast, by Delivery Mode 2019 & 2032
- Table 7: Global Population Health Management Services Market Revenue Million Forecast, by End-User 2019 & 2032
- Table 8: Global Population Health Management Services Market Volume K Unit Forecast, by End-User 2019 & 2032
- Table 9: Global Population Health Management Services Market Revenue Million Forecast, by Region 2019 & 2032
- Table 10: Global Population Health Management Services Market Volume K Unit Forecast, by Region 2019 & 2032
- Table 11: Global Population Health Management Services Market Revenue Million Forecast, by Country 2019 & 2032
- Table 12: Global Population Health Management Services Market Volume K Unit Forecast, by Country 2019 & 2032
- Table 13: United States Population Health Management Services Market Revenue (Million) Forecast, by Application 2019 & 2032
- Table 14: United States Population Health Management Services Market Volume (K Unit) Forecast, by Application 2019 & 2032
- Table 15: Canada Population Health Management Services Market Revenue (Million) Forecast, by Application 2019 & 2032
- Table 16: Canada Population Health Management Services Market Volume (K Unit) Forecast, by Application 2019 & 2032
- Table 17: Mexico Population Health Management Services Market Revenue (Million) Forecast, by Application 2019 & 2032
- Table 18: Mexico Population Health Management Services Market Volume (K Unit) Forecast, by Application 2019 & 2032
- Table 19: Global Population Health Management Services Market Revenue Million Forecast, by Country 2019 & 2032
- Table 20: Global Population Health Management Services Market Volume K Unit Forecast, by Country 2019 & 2032
- Table 21: Germany Population Health Management Services Market Revenue (Million) Forecast, by Application 2019 & 2032
- Table 22: Germany Population Health Management Services Market Volume (K Unit) Forecast, by Application 2019 & 2032
- Table 23: United Kingdom Population Health Management Services Market Revenue (Million) Forecast, by Application 2019 & 2032
- Table 24: United Kingdom Population Health Management Services Market Volume (K Unit) Forecast, by Application 2019 & 2032
- Table 25: France Population Health Management Services Market Revenue (Million) Forecast, by Application 2019 & 2032
- Table 26: France Population Health Management Services Market Volume (K Unit) Forecast, by Application 2019 & 2032
- Table 27: Italy Population Health Management Services Market Revenue (Million) Forecast, by Application 2019 & 2032
- Table 28: Italy Population Health Management Services Market Volume (K Unit) Forecast, by Application 2019 & 2032
- Table 29: Spain Population Health Management Services Market Revenue (Million) Forecast, by Application 2019 & 2032
- Table 30: Spain Population Health Management Services Market Volume (K Unit) Forecast, by Application 2019 & 2032
- Table 31: Rest of Europe Population Health Management Services Market Revenue (Million) Forecast, by Application 2019 & 2032
- Table 32: Rest of Europe Population Health Management Services Market Volume (K Unit) Forecast, by Application 2019 & 2032
- Table 33: Global Population Health Management Services Market Revenue Million Forecast, by Country 2019 & 2032
- Table 34: Global Population Health Management Services Market Volume K Unit Forecast, by Country 2019 & 2032
- Table 35: China Population Health Management Services Market Revenue (Million) Forecast, by Application 2019 & 2032
- Table 36: China Population Health Management Services Market Volume (K Unit) Forecast, by Application 2019 & 2032
- Table 37: Japan Population Health Management Services Market Revenue (Million) Forecast, by Application 2019 & 2032
- Table 38: Japan Population Health Management Services Market Volume (K Unit) Forecast, by Application 2019 & 2032
- Table 39: India Population Health Management Services Market Revenue (Million) Forecast, by Application 2019 & 2032
- Table 40: India Population Health Management Services Market Volume (K Unit) Forecast, by Application 2019 & 2032
- Table 41: Australia Population Health Management Services Market Revenue (Million) Forecast, by Application 2019 & 2032
- Table 42: Australia Population Health Management Services Market Volume (K Unit) Forecast, by Application 2019 & 2032
- Table 43: South Korea Population Health Management Services Market Revenue (Million) Forecast, by Application 2019 & 2032
- Table 44: South Korea Population Health Management Services Market Volume (K Unit) Forecast, by Application 2019 & 2032
- Table 45: Rest of Asia Pacific Population Health Management Services Market Revenue (Million) Forecast, by Application 2019 & 2032
- Table 46: Rest of Asia Pacific Population Health Management Services Market Volume (K Unit) Forecast, by Application 2019 & 2032
- Table 47: Global Population Health Management Services Market Revenue Million Forecast, by Country 2019 & 2032
- Table 48: Global Population Health Management Services Market Volume K Unit Forecast, by Country 2019 & 2032
- Table 49: Population Health Management Services Market Revenue (Million) Forecast, by Application 2019 & 2032
- Table 50: Population Health Management Services Market Volume (K Unit) Forecast, by Application 2019 & 2032
- Table 51: Global Population Health Management Services Market Revenue Million Forecast, by Country 2019 & 2032
- Table 52: Global Population Health Management Services Market Volume K Unit Forecast, by Country 2019 & 2032
- Table 53: South Africa Population Health Management Services Market Revenue (Million) Forecast, by Application 2019 & 2032
- Table 54: South Africa Population Health Management Services Market Volume (K Unit) Forecast, by Application 2019 & 2032
- Table 55: Rest of Middle East Population Health Management Services Market Revenue (Million) Forecast, by Application 2019 & 2032
- Table 56: Rest of Middle East Population Health Management Services Market Volume (K Unit) Forecast, by Application 2019 & 2032
- Table 57: Global Population Health Management Services Market Revenue Million Forecast, by Country 2019 & 2032
- Table 58: Global Population Health Management Services Market Volume K Unit Forecast, by Country 2019 & 2032
- Table 59: Brazil Population Health Management Services Market Revenue (Million) Forecast, by Application 2019 & 2032
- Table 60: Brazil Population Health Management Services Market Volume (K Unit) Forecast, by Application 2019 & 2032
- Table 61: Argentina Population Health Management Services Market Revenue (Million) Forecast, by Application 2019 & 2032
- Table 62: Argentina Population Health Management Services Market Volume (K Unit) Forecast, by Application 2019 & 2032
- Table 63: Rest of South America Population Health Management Services Market Revenue (Million) Forecast, by Application 2019 & 2032
- Table 64: Rest of South America Population Health Management Services Market Volume (K Unit) Forecast, by Application 2019 & 2032
- Table 65: Global Population Health Management Services Market Revenue Million Forecast, by Component 2019 & 2032
- Table 66: Global Population Health Management Services Market Volume K Unit Forecast, by Component 2019 & 2032
- Table 67: Global Population Health Management Services Market Revenue Million Forecast, by Delivery Mode 2019 & 2032
- Table 68: Global Population Health Management Services Market Volume K Unit Forecast, by Delivery Mode 2019 & 2032
- Table 69: Global Population Health Management Services Market Revenue Million Forecast, by End-User 2019 & 2032
- Table 70: Global Population Health Management Services Market Volume K Unit Forecast, by End-User 2019 & 2032
- Table 71: Global Population Health Management Services Market Revenue Million Forecast, by Country 2019 & 2032
- Table 72: Global Population Health Management Services Market Volume K Unit Forecast, by Country 2019 & 2032
- Table 73: United States Population Health Management Services Market Revenue (Million) Forecast, by Application 2019 & 2032
- Table 74: United States Population Health Management Services Market Volume (K Unit) Forecast, by Application 2019 & 2032
- Table 75: Canada Population Health Management Services Market Revenue (Million) Forecast, by Application 2019 & 2032
- Table 76: Canada Population Health Management Services Market Volume (K Unit) Forecast, by Application 2019 & 2032
- Table 77: Mexico Population Health Management Services Market Revenue (Million) Forecast, by Application 2019 & 2032
- Table 78: Mexico Population Health Management Services Market Volume (K Unit) Forecast, by Application 2019 & 2032
- Table 79: Global Population Health Management Services Market Revenue Million Forecast, by Component 2019 & 2032
- Table 80: Global Population Health Management Services Market Volume K Unit Forecast, by Component 2019 & 2032
- Table 81: Global Population Health Management Services Market Revenue Million Forecast, by Delivery Mode 2019 & 2032
- Table 82: Global Population Health Management Services Market Volume K Unit Forecast, by Delivery Mode 2019 & 2032
- Table 83: Global Population Health Management Services Market Revenue Million Forecast, by End-User 2019 & 2032
- Table 84: Global Population Health Management Services Market Volume K Unit Forecast, by End-User 2019 & 2032
- Table 85: Global Population Health Management Services Market Revenue Million Forecast, by Country 2019 & 2032
- Table 86: Global Population Health Management Services Market Volume K Unit Forecast, by Country 2019 & 2032
- Table 87: Germany Population Health Management Services Market Revenue (Million) Forecast, by Application 2019 & 2032
- Table 88: Germany Population Health Management Services Market Volume (K Unit) Forecast, by Application 2019 & 2032
- Table 89: United Kingdom Population Health Management Services Market Revenue (Million) Forecast, by Application 2019 & 2032
- Table 90: United Kingdom Population Health Management Services Market Volume (K Unit) Forecast, by Application 2019 & 2032
- Table 91: France Population Health Management Services Market Revenue (Million) Forecast, by Application 2019 & 2032
- Table 92: France Population Health Management Services Market Volume (K Unit) Forecast, by Application 2019 & 2032
- Table 93: Italy Population Health Management Services Market Revenue (Million) Forecast, by Application 2019 & 2032
- Table 94: Italy Population Health Management Services Market Volume (K Unit) Forecast, by Application 2019 & 2032
- Table 95: Spain Population Health Management Services Market Revenue (Million) Forecast, by Application 2019 & 2032
- Table 96: Spain Population Health Management Services Market Volume (K Unit) Forecast, by Application 2019 & 2032
- Table 97: Rest of Europe Population Health Management Services Market Revenue (Million) Forecast, by Application 2019 & 2032
- Table 98: Rest of Europe Population Health Management Services Market Volume (K Unit) Forecast, by Application 2019 & 2032
- Table 99: Global Population Health Management Services Market Revenue Million Forecast, by Component 2019 & 2032
- Table 100: Global Population Health Management Services Market Volume K Unit Forecast, by Component 2019 & 2032
- Table 101: Global Population Health Management Services Market Revenue Million Forecast, by Delivery Mode 2019 & 2032
- Table 102: Global Population Health Management Services Market Volume K Unit Forecast, by Delivery Mode 2019 & 2032
- Table 103: Global Population Health Management Services Market Revenue Million Forecast, by End-User 2019 & 2032
- Table 104: Global Population Health Management Services Market Volume K Unit Forecast, by End-User 2019 & 2032
- Table 105: Global Population Health Management Services Market Revenue Million Forecast, by Country 2019 & 2032
- Table 106: Global Population Health Management Services Market Volume K Unit Forecast, by Country 2019 & 2032
- Table 107: China Population Health Management Services Market Revenue (Million) Forecast, by Application 2019 & 2032
- Table 108: China Population Health Management Services Market Volume (K Unit) Forecast, by Application 2019 & 2032
- Table 109: Japan Population Health Management Services Market Revenue (Million) Forecast, by Application 2019 & 2032
- Table 110: Japan Population Health Management Services Market Volume (K Unit) Forecast, by Application 2019 & 2032
- Table 111: India Population Health Management Services Market Revenue (Million) Forecast, by Application 2019 & 2032
- Table 112: India Population Health Management Services Market Volume (K Unit) Forecast, by Application 2019 & 2032
- Table 113: Australia Population Health Management Services Market Revenue (Million) Forecast, by Application 2019 & 2032
- Table 114: Australia Population Health Management Services Market Volume (K Unit) Forecast, by Application 2019 & 2032
- Table 115: South Korea Population Health Management Services Market Revenue (Million) Forecast, by Application 2019 & 2032
- Table 116: South Korea Population Health Management Services Market Volume (K Unit) Forecast, by Application 2019 & 2032
- Table 117: Rest of Asia Pacific Population Health Management Services Market Revenue (Million) Forecast, by Application 2019 & 2032
- Table 118: Rest of Asia Pacific Population Health Management Services Market Volume (K Unit) Forecast, by Application 2019 & 2032
- Table 119: Global Population Health Management Services Market Revenue Million Forecast, by Component 2019 & 2032
- Table 120: Global Population Health Management Services Market Volume K Unit Forecast, by Component 2019 & 2032
- Table 121: Global Population Health Management Services Market Revenue Million Forecast, by Delivery Mode 2019 & 2032
- Table 122: Global Population Health Management Services Market Volume K Unit Forecast, by Delivery Mode 2019 & 2032
- Table 123: Global Population Health Management Services Market Revenue Million Forecast, by End-User 2019 & 2032
- Table 124: Global Population Health Management Services Market Volume K Unit Forecast, by End-User 2019 & 2032
- Table 125: Global Population Health Management Services Market Revenue Million Forecast, by Country 2019 & 2032
- Table 126: Global Population Health Management Services Market Volume K Unit Forecast, by Country 2019 & 2032
- Table 127: Global Population Health Management Services Market Revenue Million Forecast, by Component 2019 & 2032
- Table 128: Global Population Health Management Services Market Volume K Unit Forecast, by Component 2019 & 2032
- Table 129: Global Population Health Management Services Market Revenue Million Forecast, by Delivery Mode 2019 & 2032
- Table 130: Global Population Health Management Services Market Volume K Unit Forecast, by Delivery Mode 2019 & 2032
- Table 131: Global Population Health Management Services Market Revenue Million Forecast, by End-User 2019 & 2032
- Table 132: Global Population Health Management Services Market Volume K Unit Forecast, by End-User 2019 & 2032
- Table 133: Global Population Health Management Services Market Revenue Million Forecast, by Country 2019 & 2032
- Table 134: Global Population Health Management Services Market Volume K Unit Forecast, by Country 2019 & 2032
- Table 135: South Africa Population Health Management Services Market Revenue (Million) Forecast, by Application 2019 & 2032
- Table 136: South Africa Population Health Management Services Market Volume (K Unit) Forecast, by Application 2019 & 2032
- Table 137: Rest of Middle East Population Health Management Services Market Revenue (Million) Forecast, by Application 2019 & 2032
- Table 138: Rest of Middle East Population Health Management Services Market Volume (K Unit) Forecast, by Application 2019 & 2032
- Table 139: Global Population Health Management Services Market Revenue Million Forecast, by Component 2019 & 2032
- Table 140: Global Population Health Management Services Market Volume K Unit Forecast, by Component 2019 & 2032
- Table 141: Global Population Health Management Services Market Revenue Million Forecast, by Delivery Mode 2019 & 2032
- Table 142: Global Population Health Management Services Market Volume K Unit Forecast, by Delivery Mode 2019 & 2032
- Table 143: Global Population Health Management Services Market Revenue Million Forecast, by End-User 2019 & 2032
- Table 144: Global Population Health Management Services Market Volume K Unit Forecast, by End-User 2019 & 2032
- Table 145: Global Population Health Management Services Market Revenue Million Forecast, by Country 2019 & 2032
- Table 146: Global Population Health Management Services Market Volume K Unit Forecast, by Country 2019 & 2032
- Table 147: Brazil Population Health Management Services Market Revenue (Million) Forecast, by Application 2019 & 2032
- Table 148: Brazil Population Health Management Services Market Volume (K Unit) Forecast, by Application 2019 & 2032
- Table 149: Argentina Population Health Management Services Market Revenue (Million) Forecast, by Application 2019 & 2032
- Table 150: Argentina Population Health Management Services Market Volume (K Unit) Forecast, by Application 2019 & 2032
- Table 151: Rest of South America Population Health Management Services Market Revenue (Million) Forecast, by Application 2019 & 2032
- Table 152: Rest of South America Population Health Management Services Market Volume (K Unit) Forecast, by Application 2019 & 2032
Frequently Asked Questions
1. What is the projected Compound Annual Growth Rate (CAGR) of the Population Health Management Services Market?
The projected CAGR is approximately 18.89%.
2. Which companies are prominent players in the Population Health Management Services Market?
Key companies in the market include Mckesson Corporation, Epic Systems Corporation, Cerner Corporation, Koninklijke Philips NV, International Business Machines Corporation (IBM), Optum Inc, Health Catalyst, Allscripts Healthcare Solutions Inc, Conifer Health Solutions.
3. What are the main segments of the Population Health Management Services Market?
The market segments include Component, Delivery Mode, End-User.
4. Can you provide details about the market size?
The market size is estimated to be USD 53.41 Million as of 2022.
5. What are some drivers contributing to market growth?
; Need to Build a Comprehensive Single Platform for Patient Record and Management; Rising Population Suffering from Chronic Diseases Requires Long Period of Surveillance; Increasing Support and Investments from Public and Private Organizations.
6. What are the notable trends driving market growth?
Cloud-based Segment is Found Dominating the Population Health Management Market.
7. Are there any restraints impacting market growth?
; Need for Multi-disciplinary Teams for Effective Implementation; Reimbursement Issues.
8. Can you provide examples of recent developments in the market?
N/A
9. What pricing options are available for accessing the report?
Pricing options include single-user, multi-user, and enterprise licenses priced at USD 4750, USD 5250, and USD 8750 respectively.
10. Is the market size provided in terms of value or volume?
The market size is provided in terms of value, measured in Million and volume, measured in K Unit.
11. Are there any specific market keywords associated with the report?
Yes, the market keyword associated with the report is "Population Health Management Services Market," which aids in identifying and referencing the specific market segment covered.
12. How do I determine which pricing option suits my needs best?
The pricing options vary based on user requirements and access needs. Individual users may opt for single-user licenses, while businesses requiring broader access may choose multi-user or enterprise licenses for cost-effective access to the report.
13. Are there any additional resources or data provided in the Population Health Management Services Market report?
While the report offers comprehensive insights, it's advisable to review the specific contents or supplementary materials provided to ascertain if additional resources or data are available.
14. How can I stay updated on further developments or reports in the Population Health Management Services Market?
To stay informed about further developments, trends, and reports in the Population Health Management Services Market, consider subscribing to industry newsletters, following relevant companies and organizations, or regularly checking reputable industry news sources and publications.
Methodology
Step 1 - Identification of Relevant Samples Size from Population Database


Step 2 - Approaches for Defining Global Market Size (Value, Volume* & Price*)

Note*: In applicable scenarios
Step 3 - Data Sources
Primary Research
- Web Analytics
- Survey Reports
- Research Institute
- Latest Research Reports
- Opinion Leaders
Secondary Research
- Annual Reports
- White Paper
- Latest Press Release
- Industry Association
- Paid Database
- Investor Presentations

Step 4 - Data Triangulation
Involves using different sources of information in order to increase the validity of a study
These sources are likely to be stakeholders in a program - participants, other researchers, program staff, other community members, and so on.
Then we put all data in single framework & apply various statistical tools to find out the dynamic on the market.
During the analysis stage, feedback from the stakeholder groups would be compared to determine areas of agreement as well as areas of divergence


