

Key Insights
The global Polyurea market is experiencing robust growth, projected to reach $1.02 billion by 2025, with a compelling Compound Annual Growth Rate (CAGR) exceeding 5.60% during the forecast period of 2025-2033. This expansion is primarily fueled by the inherent advantages of polyurea coatings and linings, including their exceptional durability, rapid curing times, and resistance to a wide array of chemicals and abrasions. Key market drivers include the increasing demand for high-performance protective coatings in the construction sector, driven by infrastructure development and the need for long-lasting waterproofing and corrosion protection. The automotive industry is also a significant contributor, leveraging polyurea for its impact resistance and aesthetic versatility in vehicle undercoatings and protective finishes. Furthermore, the paints and coatings industry is increasingly adopting polyurea for specialized applications demanding superior performance.
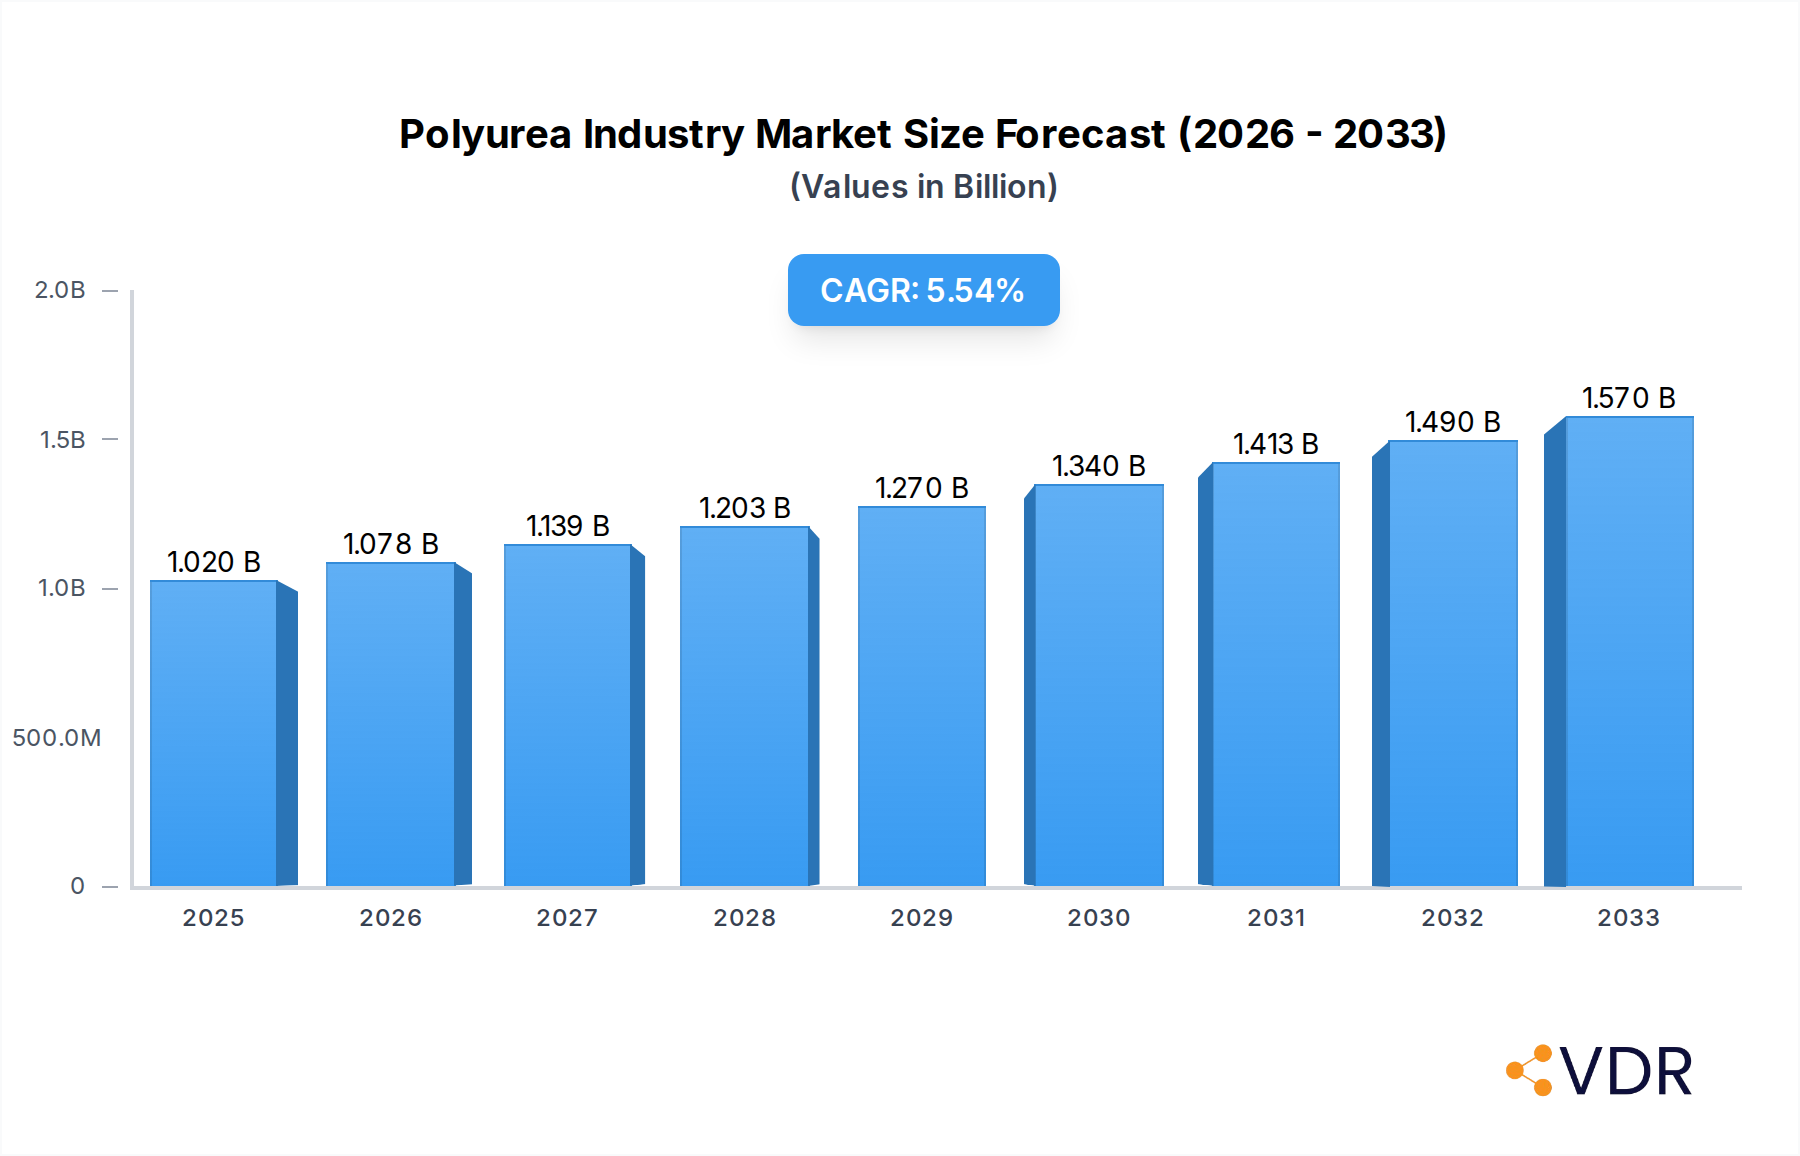
Polyurea Industry Market Size (In Billion)
The market segmentation reveals a dynamic landscape with diverse applications. Aromatic polyureas, known for their high tensile strength and abrasion resistance, are widely used in demanding industrial environments. Aliphatic polyureas, offering UV stability and color retention, are favored for exterior applications. In terms of product type, linings and coatings represent the largest segments, critical for protecting surfaces in construction, industrial equipment, and marine applications. Sealants also hold a significant share, essential for creating robust, waterproof barriers. Emerging trends include the development of advanced polyurea formulations with enhanced properties like self-healing capabilities and improved environmental profiles. While the market enjoys strong growth, potential restraints could include the relatively higher initial cost compared to some conventional coatings and the need for specialized application equipment and trained personnel. Nevertheless, the long-term cost savings derived from polyurea's superior longevity and reduced maintenance requirements are expected to outweigh these considerations.

Polyurea Industry Company Market Share
Polyurea Industry Market Insights: Global Analysis & Future Outlook (2019-2033)
This comprehensive report delivers an in-depth analysis of the global Polyurea industry, providing critical insights into market dynamics, growth trends, regional dominance, product landscape, and key players. With a focus on high-traffic keywords such as "polyurea coatings," "polyurea linings," "polyurea sealants," "polyurea construction," "polyurea automotive," and "polyurea industrial applications," this report is optimized for maximum search engine visibility and engagement among industry professionals. We present a detailed forecast from 2025-2033, built upon historical data from 2019-2024, and a base year of 2025.
Polyurea Industry Market Dynamics & Structure
The global Polyurea industry is characterized by a moderately concentrated market, driven by continuous technological innovation and evolving regulatory frameworks. Key drivers include the demand for durable, high-performance protective coatings and linings across various end-user industries. Competitive product substitutes like epoxies and polyurethanes present a challenge, but polyurea's superior properties, such as rapid curing times, excellent chemical resistance, and flexibility, maintain its competitive edge. End-user demographics are expanding, with increasing adoption in construction for waterproofing and protective coatings, in automotive for bed liners and underbody protection, and in industrial settings for corrosion resistance. Mergers and acquisitions (M&A) are a significant trend, with companies seeking to expand their product portfolios, geographical reach, and technological capabilities. For instance, the recent investments in production capacity by companies like Teknos Group highlight a strategic push for market share. Innovation barriers exist, primarily related to the specialized application equipment and training required, but ongoing research into new formulations and application techniques is mitigating these. We anticipate a steady increase in M&A activity as larger players consolidate their positions and smaller innovators are acquired.
- Market Concentration: Moderately concentrated, with a few key players holding significant market share.
- Technological Innovation: Driven by advancements in polyurea formulations, application technologies, and performance enhancement.
- Regulatory Frameworks: Increasingly focusing on environmental compliance and worker safety, influencing product development and application methods.
- Competitive Product Substitutes: Epoxies, polyurethanes, and other protective coating systems.
- End-User Demographics: Diversifying from industrial to widespread adoption in construction, automotive, and maritime sectors.
- M&A Trends: Ongoing consolidation and strategic alliances to enhance market presence and technological capabilities.
Polyurea Industry Growth Trends & Insights
The global Polyurea market is poised for robust expansion, driven by a confluence of factors including increasing infrastructure development, stringent environmental regulations favoring high-performance protective solutions, and growing demand for durable and fast-curing coatings. Market size evolution is projected to witness a significant upward trajectory, with the global polyurea market value anticipated to reach XX million USD by 2033. Adoption rates are accelerating across key end-user industries, particularly in construction for roofing, containment, and waterproofing applications, where polyurea’s seamless, impermeable barrier provides superior protection against moisture and chemical ingress. In the automotive sector, the demand for high-durability bed liners and protective coatings continues to fuel growth. Technological disruptions, such as the development of faster-curing formulations and user-friendly application systems, are lowering adoption barriers and increasing market penetration. Consumer behavior shifts are also playing a crucial role, with an increasing preference for sustainable and long-lasting protective solutions that reduce maintenance costs and environmental impact. The CAGR for the polyurea market is estimated to be XX% during the forecast period, reflecting a consistent and strong growth trend. The market penetration for polyurea in protective coating applications is estimated to be around XX% in developed regions and is rapidly growing in emerging economies. The increasing awareness of polyurea’s superior performance characteristics compared to traditional materials, such as its excellent UV resistance, abrasion resistance, and flexibility, is further driving its adoption. The shift towards off-site construction and modular building techniques also favors polyurea due to its rapid curing capabilities, enabling quicker project turnaround times. Furthermore, the growing focus on asset protection and extending the lifespan of infrastructure, from bridges and pipelines to water treatment plants and chemical storage facilities, underscores the indispensability of polyurea. The market is also benefiting from the development of specialized polyurea formulations tailored for specific applications, such as fire-retardant polyurea for increased safety in construction and transportation. The global polyurea market size is estimated to be XX million USD in 2025 and is projected to grow to XX million USD by 2033.
Dominant Regions, Countries, or Segments in Polyurea Industry
The Construction end-user industry is currently the dominant segment driving growth in the global Polyurea market, accounting for an estimated XX% of the total market share in 2025. This dominance is attributed to several key factors, including the escalating global demand for infrastructure development, rapid urbanization, and the increasing adoption of polyurea for critical applications like roofing, waterproofing, bridge deck coatings, and secondary containment systems. Stringent building codes and regulations mandating high-performance, durable, and long-lasting protective materials further bolster the demand for polyurea solutions in this sector. The United States emerges as the leading country within the Polyurea market, primarily due to its advanced construction industry, significant investments in infrastructure repair and upgrades, and a well-established awareness of polyurea’s benefits. Economic policies supporting infrastructure spending and a strong emphasis on durable building materials contribute to the US's leading position.
- Dominant End-User Industry: Construction
- Key Drivers:
- Global infrastructure development projects.
- Rapid urbanization and increasing demand for durable building materials.
- Stringent building codes and regulations for protective coatings.
- Growth in residential, commercial, and industrial construction.
- Demand for waterproofing and corrosion protection in buildings.
- Key Drivers:
- Leading Country: United States
- Dominance Factors:
- Robust construction sector and significant infrastructure spending.
- High adoption rate of advanced protective coating technologies.
- Presence of major polyurea manufacturers and distributors.
- Stringent environmental and safety regulations favoring high-performance materials.
- Growing demand for protective solutions in diverse applications like bridges, tunnels, and wastewater treatment plants.
- Dominance Factors:
- Dominant Chemical Structure: Aromatic polyurea is currently dominant due to its cost-effectiveness and widespread use in many industrial applications. However, Aliphatic polyurea is gaining traction for its superior UV stability and aesthetic appeal in exposed applications, indicating a shifting trend.
- Dominant Type: Hot Polyurea systems hold a larger market share owing to their rapid curing and high-performance characteristics, making them ideal for large-scale industrial and construction projects. Cold Polyurea is finding its niche in smaller applications and repair work where specialized equipment is not feasible.
- Dominant Product: Linings and Coatings collectively represent the largest product segment. Linings are crucial for asset protection in tanks, pipes, and secondary containment, while coatings are extensively used for surface protection and enhancement in various industries. Sealants are also a growing segment, particularly in construction and automotive.
- Growth Potential: Asia Pacific is identified as a high-growth region, driven by rapid industrialization, expanding infrastructure, and increasing awareness of polyurea's benefits in countries like China and India.
Polyurea Industry Product Landscape
The Polyurea product landscape is characterized by continuous innovation, focusing on enhanced performance and diverse applications. Key product innovations include the development of low-VOC (Volatile Organic Compound) formulations to meet stricter environmental regulations, as well as advancements in UV-stable aliphatic polyureas for aesthetic exterior applications. Unique selling propositions often revolve around rapid cure times enabling quick return to service, exceptional chemical and abrasion resistance for demanding environments, and flexibility that prevents cracking under thermal expansion or substrate movement. Technological advancements are also enabling easier application methods, expanding the reach of polyurea into new markets and applications. This includes sprayable polyurea systems with improved viscosity and faster gel times, as well as specialized formulations for specific substrates and environmental conditions.
Key Drivers, Barriers & Challenges in Polyurea Industry
Key Drivers:
- Superior Performance Properties: Unmatched durability, chemical resistance, abrasion resistance, and rapid curing capabilities drive demand for protective applications.
- Infrastructure Development: Growing global investments in infrastructure projects necessitate long-lasting, protective coatings and linings.
- Environmental Regulations: Increasing focus on corrosion prevention and asset longevity aligns with polyurea's protective benefits.
- Technological Advancements: Development of faster curing times, improved application techniques, and specialized formulations are expanding market accessibility.
Barriers & Challenges:
- High Initial Cost: Compared to traditional coatings, polyurea can have a higher upfront material and application equipment cost, impacting adoption in cost-sensitive markets.
- Specialized Application Equipment & Training: The need for specialized spray equipment and trained applicators can be a barrier to entry for smaller contractors.
- Market Awareness and Education: Continuous efforts are required to educate potential users about the distinct advantages of polyurea over conventional materials.
- Supply Chain Volatility: Fluctuations in raw material prices and availability can impact production costs and market stability. Supply chain disruptions, as observed in recent years, can pose a significant challenge to timely project completion. The competitive pressure from established coating technologies, while being addressed by polyurea's performance, remains a constant factor.
Emerging Opportunities in Polyurea Industry
Emerging opportunities in the Polyurea industry are centered around expanding into new geographical markets, particularly in developing economies with burgeoning infrastructure needs. The development of bio-based or recycled content polyurea formulations presents a significant opportunity to cater to the growing demand for sustainable construction materials. Innovative applications in renewable energy sectors, such as protective coatings for wind turbine blades and solar panel mounting structures, are also on the rise. Furthermore, the integration of smart technologies, like self-healing polyurea or those with embedded sensors for structural health monitoring, represents a futuristic frontier for market expansion. The growing trend of modular construction and prefabrication also creates a niche for polyurea's rapid curing and seamless application capabilities.
Growth Accelerators in the Polyurea Industry Industry
Long-term growth in the Polyurea industry will be significantly accelerated by ongoing technological breakthroughs, leading to more versatile and cost-effective polyurea systems. Strategic partnerships between raw material suppliers, formulators, and application specialists are crucial for market penetration and innovation dissemination. Expansion into underserved niche markets, such as specialized industrial flooring solutions and protective coatings for extreme environments, will further fuel growth. The increasing global emphasis on infrastructure longevity and asset protection, coupled with growing environmental consciousness, acts as a powerful catalyst for polyurea adoption. Furthermore, continued investment in research and development to create polyurea with enhanced properties, such as improved fire retardancy or greater flexibility at low temperatures, will unlock new application avenues and drive market expansion.
Key Players Shaping the Polyurea Industry Market
- SATYEN POLYMERS PVT LTD (TEVO)
- Dorf Ketal
- Rhino Linings Corporation
- CITADEL FLOORS
- Huntsman International LLC
- Elastothane
- Speciality Products Inc
- Teknos Group
- Lonza
- Covestro AG
- Armorthane
Notable Milestones in Polyurea Industry Sector
- January 2023: Teknos Deutschland GmbH plans to relocate its production from Fulda to the existing Brüggen site. The relocation aims to develop further the production and delivery capabilities of Teknos Deutschland GmbH in Germany. This enhancement of production capabilities is likely to boost the market for polyurea in Germany.
- September 2022: Teknos Group opened its new Commercial and Competence Centre with a technical application laboratory and warehouse facilities in Dong Nai Province to expand its business in Vietnam. This helps the company further develop its business, which in turn helps in the growth of the polyurea market.
In-Depth Polyurea Industry Market Outlook
The Polyurea industry market outlook is exceptionally positive, fueled by sustained demand from infrastructure development and industrial sectors. Growth accelerators such as the continuous innovation in polyurea formulations, leading to enhanced performance and cost-effectiveness, are paramount. Strategic partnerships among key industry players will foster market expansion and technological advancements. The increasing global awareness and adoption of polyurea for its superior protective capabilities, particularly in challenging environments, will continue to drive market penetration. Furthermore, the growing emphasis on extending the lifespan of assets and infrastructure, coupled with a global shift towards more sustainable and durable solutions, positions polyurea as a material of choice, promising significant future market potential and strategic opportunities for growth.
Polyurea Industry Segmentation
-
1. Chemical Structure
- 1.1. Aromatic
- 1.2. Aliphatic
-
2. Type
- 2.1. Hot Polyurea
- 2.2. Cold Polyurea
-
3. Product
- 3.1. Lining
- 3.2. Coating
- 3.3. Sealants
-
4. End-user Industry
- 4.1. Construction
- 4.2. Paints and Coatings
- 4.3. Automotive
- 4.4. Industrial
- 4.5. Maritime
- 4.6. Other End-user Industries (Transportation, Etc.)
Polyurea Industry Segmentation By Geography
-
1. Asia Pacific
- 1.1. China
- 1.2. India
- 1.3. Japan
- 1.4. South Korea
- 1.5. Rest of Asia Pacific
-
2. North America
- 2.1. United States
- 2.2. Canada
- 2.3. Mexico
-
3. Europe
- 3.1. Germany
- 3.2. United Kingdom
- 3.3. France
- 3.4. Italy
- 3.5. Rest of Europe
-
4. South America
- 4.1. Brazil
- 4.2. Argentina
- 4.3. Rest of South America
-
5. Middle East and Africa
- 5.1. Saudi Arabia
- 5.2. South Africa
- 5.3. Rest of Middle East and Africa
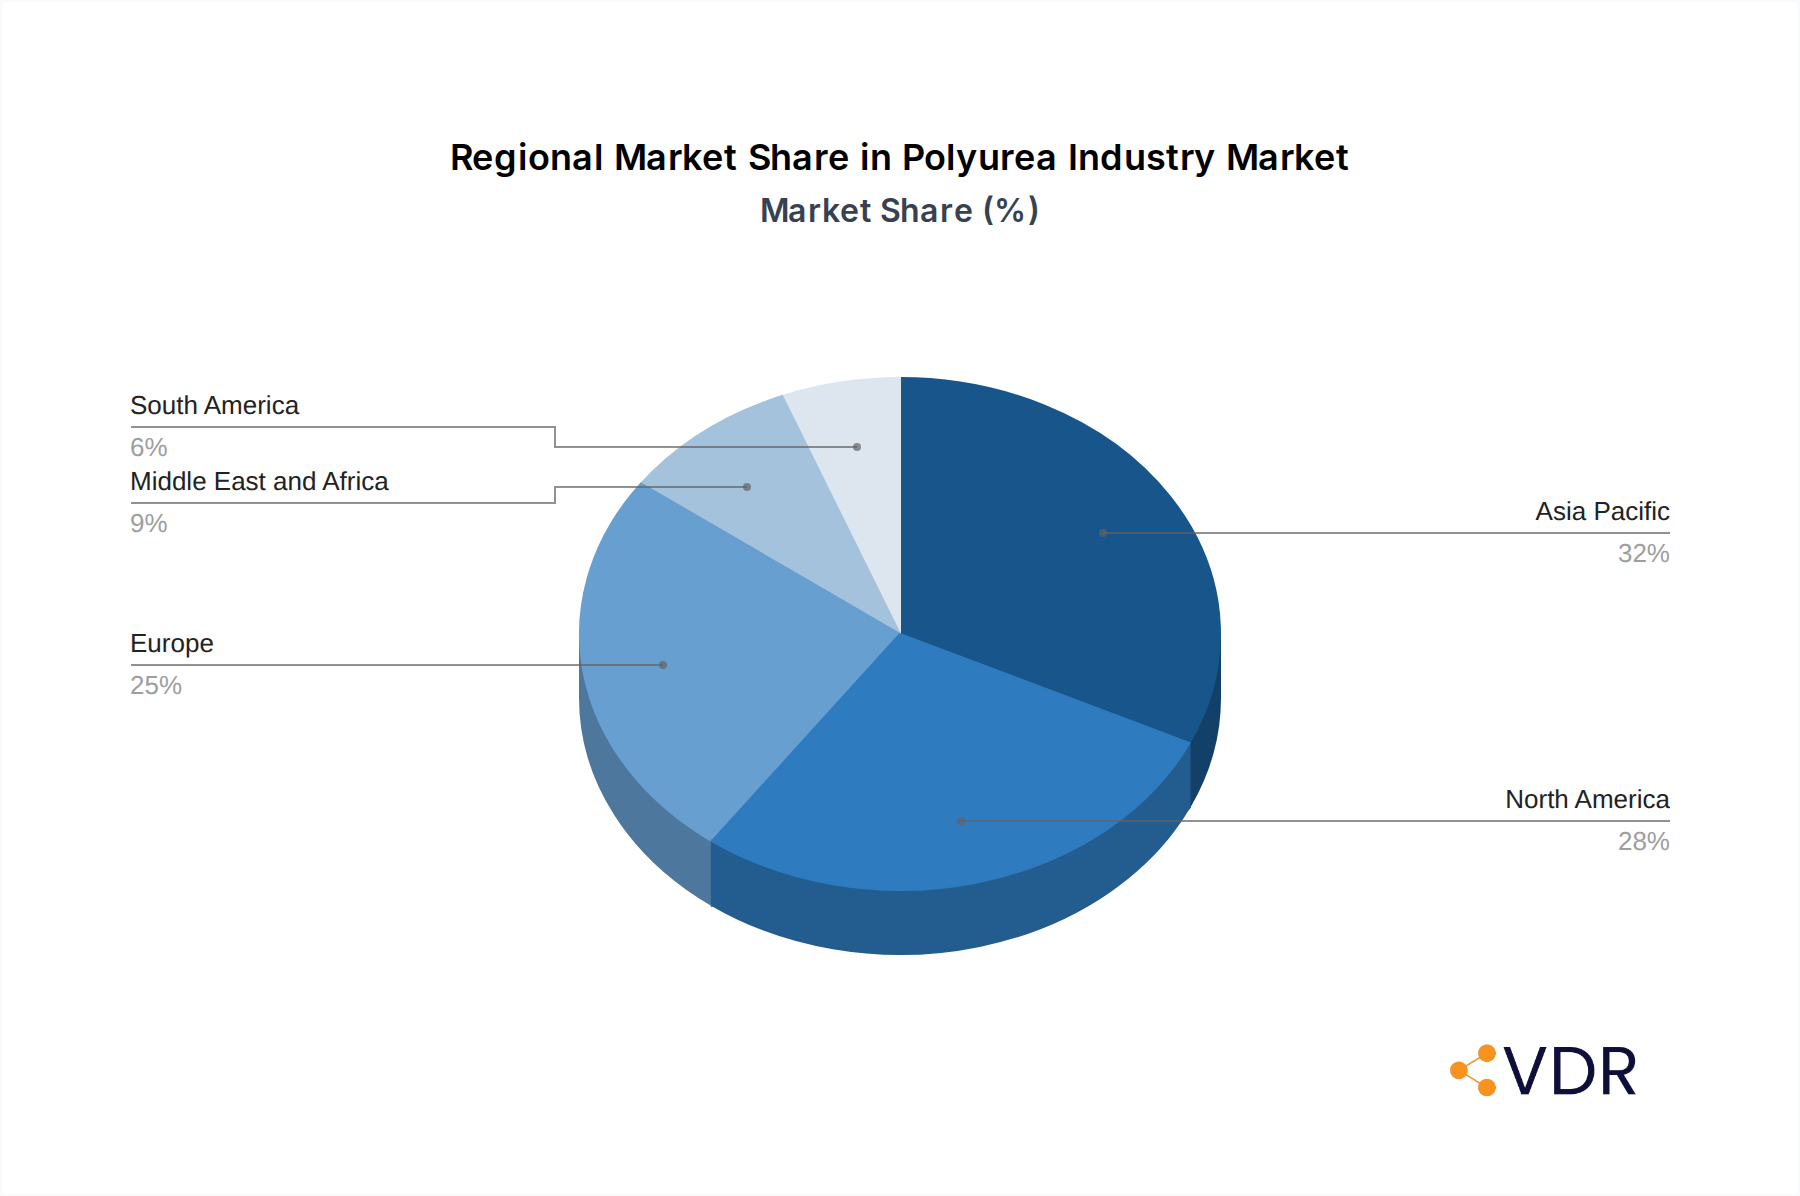
Polyurea Industry Regional Market Share
Geographic Coverage of Polyurea Industry
Polyurea Industry REPORT HIGHLIGHTS
| Aspects | Details |
|---|---|
| Study Period | 2020-2034 |
| Base Year | 2025 |
| Estimated Year | 2026 |
| Forecast Period | 2026-2034 |
| Historical Period | 2020-2025 |
| Growth Rate | CAGR of > 5.60% from 2020-2034 |
| Segmentation |
|
Table of Contents
- 1. Introduction
- 1.1. Research Scope
- 1.2. Market Segmentation
- 1.3. Research Objective
- 1.4. Definitions and Assumptions
- 2. Executive Summary
- 2.1. Market Snapshot
- 3. Market Dynamics
- 3.1. Market Drivers
- 3.2. Market Restrains
- 3.3. Market Trends
- 3.4. Market Opportunities
- 4. Market Factor Analysis
- 4.1. Porters Five Forces
- 4.1.1. Bargaining Power of Suppliers
- 4.1.2. Bargaining Power of Buyers
- 4.1.3. Threat of New Entrants
- 4.1.4. Threat of Substitutes
- 4.1.5. Competitive Rivalry
- 4.2. PESTEL analysis
- 4.3. BCG Analysis
- 4.3.1. Stars (High Growth, High Market Share)
- 4.3.2. Cash Cows (Low Growth, High Market Share)
- 4.3.3. Question Mark (High Growth, Low Market Share)
- 4.3.4. Dogs (Low Growth, Low Market Share)
- 4.4. Ansoff Matrix Analysis
- 4.5. Supply Chain Analysis
- 4.6. Regulatory Landscape
- 4.7. Current Market Potential and Opportunity Assessment (TAM–SAM–SOM Framework)
- 4.8. VDR Analyst Note
- 4.1. Porters Five Forces
- 5. Market Analysis, Insights and Forecast 2021-2033
- 5.1. Market Analysis, Insights and Forecast - by Chemical Structure
- 5.1.1. Aromatic
- 5.1.2. Aliphatic
- 5.2. Market Analysis, Insights and Forecast - by Type
- 5.2.1. Hot Polyurea
- 5.2.2. Cold Polyurea
- 5.3. Market Analysis, Insights and Forecast - by Product
- 5.3.1. Lining
- 5.3.2. Coating
- 5.3.3. Sealants
- 5.4. Market Analysis, Insights and Forecast - by End-user Industry
- 5.4.1. Construction
- 5.4.2. Paints and Coatings
- 5.4.3. Automotive
- 5.4.4. Industrial
- 5.4.5. Maritime
- 5.4.6. Other End-user Industries (Transportation, Etc.)
- 5.5. Market Analysis, Insights and Forecast - by Region
- 5.5.1. Asia Pacific
- 5.5.2. North America
- 5.5.3. Europe
- 5.5.4. South America
- 5.5.5. Middle East and Africa
- 5.1. Market Analysis, Insights and Forecast - by Chemical Structure
- 6. Global Polyurea Industry Analysis, Insights and Forecast, 2021-2033
- 6.1. Market Analysis, Insights and Forecast - by Chemical Structure
- 6.1.1. Aromatic
- 6.1.2. Aliphatic
- 6.2. Market Analysis, Insights and Forecast - by Type
- 6.2.1. Hot Polyurea
- 6.2.2. Cold Polyurea
- 6.3. Market Analysis, Insights and Forecast - by Product
- 6.3.1. Lining
- 6.3.2. Coating
- 6.3.3. Sealants
- 6.4. Market Analysis, Insights and Forecast - by End-user Industry
- 6.4.1. Construction
- 6.4.2. Paints and Coatings
- 6.4.3. Automotive
- 6.4.4. Industrial
- 6.4.5. Maritime
- 6.4.6. Other End-user Industries (Transportation, Etc.)
- 6.1. Market Analysis, Insights and Forecast - by Chemical Structure
- 7. Asia Pacific Polyurea Industry Analysis, Insights and Forecast, 2021-2033
- 7.1. Market Analysis, Insights and Forecast - by Chemical Structure
- 7.1.1. Aromatic
- 7.1.2. Aliphatic
- 7.2. Market Analysis, Insights and Forecast - by Type
- 7.2.1. Hot Polyurea
- 7.2.2. Cold Polyurea
- 7.3. Market Analysis, Insights and Forecast - by Product
- 7.3.1. Lining
- 7.3.2. Coating
- 7.3.3. Sealants
- 7.4. Market Analysis, Insights and Forecast - by End-user Industry
- 7.4.1. Construction
- 7.4.2. Paints and Coatings
- 7.4.3. Automotive
- 7.4.4. Industrial
- 7.4.5. Maritime
- 7.4.6. Other End-user Industries (Transportation, Etc.)
- 7.1. Market Analysis, Insights and Forecast - by Chemical Structure
- 8. North America Polyurea Industry Analysis, Insights and Forecast, 2021-2033
- 8.1. Market Analysis, Insights and Forecast - by Chemical Structure
- 8.1.1. Aromatic
- 8.1.2. Aliphatic
- 8.2. Market Analysis, Insights and Forecast - by Type
- 8.2.1. Hot Polyurea
- 8.2.2. Cold Polyurea
- 8.3. Market Analysis, Insights and Forecast - by Product
- 8.3.1. Lining
- 8.3.2. Coating
- 8.3.3. Sealants
- 8.4. Market Analysis, Insights and Forecast - by End-user Industry
- 8.4.1. Construction
- 8.4.2. Paints and Coatings
- 8.4.3. Automotive
- 8.4.4. Industrial
- 8.4.5. Maritime
- 8.4.6. Other End-user Industries (Transportation, Etc.)
- 8.1. Market Analysis, Insights and Forecast - by Chemical Structure
- 9. Europe Polyurea Industry Analysis, Insights and Forecast, 2021-2033
- 9.1. Market Analysis, Insights and Forecast - by Chemical Structure
- 9.1.1. Aromatic
- 9.1.2. Aliphatic
- 9.2. Market Analysis, Insights and Forecast - by Type
- 9.2.1. Hot Polyurea
- 9.2.2. Cold Polyurea
- 9.3. Market Analysis, Insights and Forecast - by Product
- 9.3.1. Lining
- 9.3.2. Coating
- 9.3.3. Sealants
- 9.4. Market Analysis, Insights and Forecast - by End-user Industry
- 9.4.1. Construction
- 9.4.2. Paints and Coatings
- 9.4.3. Automotive
- 9.4.4. Industrial
- 9.4.5. Maritime
- 9.4.6. Other End-user Industries (Transportation, Etc.)
- 9.1. Market Analysis, Insights and Forecast - by Chemical Structure
- 10. South America Polyurea Industry Analysis, Insights and Forecast, 2021-2033
- 10.1. Market Analysis, Insights and Forecast - by Chemical Structure
- 10.1.1. Aromatic
- 10.1.2. Aliphatic
- 10.2. Market Analysis, Insights and Forecast - by Type
- 10.2.1. Hot Polyurea
- 10.2.2. Cold Polyurea
- 10.3. Market Analysis, Insights and Forecast - by Product
- 10.3.1. Lining
- 10.3.2. Coating
- 10.3.3. Sealants
- 10.4. Market Analysis, Insights and Forecast - by End-user Industry
- 10.4.1. Construction
- 10.4.2. Paints and Coatings
- 10.4.3. Automotive
- 10.4.4. Industrial
- 10.4.5. Maritime
- 10.4.6. Other End-user Industries (Transportation, Etc.)
- 10.1. Market Analysis, Insights and Forecast - by Chemical Structure
- 11. Middle East and Africa Polyurea Industry Analysis, Insights and Forecast, 2021-2033
- 11.1. Market Analysis, Insights and Forecast - by Chemical Structure
- 11.1.1. Aromatic
- 11.1.2. Aliphatic
- 11.2. Market Analysis, Insights and Forecast - by Type
- 11.2.1. Hot Polyurea
- 11.2.2. Cold Polyurea
- 11.3. Market Analysis, Insights and Forecast - by Product
- 11.3.1. Lining
- 11.3.2. Coating
- 11.3.3. Sealants
- 11.4. Market Analysis, Insights and Forecast - by End-user Industry
- 11.4.1. Construction
- 11.4.2. Paints and Coatings
- 11.4.3. Automotive
- 11.4.4. Industrial
- 11.4.5. Maritime
- 11.4.6. Other End-user Industries (Transportation, Etc.)
- 11.1. Market Analysis, Insights and Forecast - by Chemical Structure
- 12. Competitive Analysis
- 12.1. Company Profiles
- 12.1.1 SATYEN POLYMERS PVT LTD (TEVO)
- 12.1.1.1. Company Overview
- 12.1.1.2. Products
- 12.1.1.3. Company Financials
- 12.1.1.4. SWOT Analysis
- 12.1.2 Dorf Ketal
- 12.1.2.1. Company Overview
- 12.1.2.2. Products
- 12.1.2.3. Company Financials
- 12.1.2.4. SWOT Analysis
- 12.1.3 Rhino Linings Corporation
- 12.1.3.1. Company Overview
- 12.1.3.2. Products
- 12.1.3.3. Company Financials
- 12.1.3.4. SWOT Analysis
- 12.1.4 CITADEL FLOORS
- 12.1.4.1. Company Overview
- 12.1.4.2. Products
- 12.1.4.3. Company Financials
- 12.1.4.4. SWOT Analysis
- 12.1.5 Huntsman International LLC
- 12.1.5.1. Company Overview
- 12.1.5.2. Products
- 12.1.5.3. Company Financials
- 12.1.5.4. SWOT Analysis
- 12.1.6 Elastothane
- 12.1.6.1. Company Overview
- 12.1.6.2. Products
- 12.1.6.3. Company Financials
- 12.1.6.4. SWOT Analysis
- 12.1.7 Speciality Products Inc
- 12.1.7.1. Company Overview
- 12.1.7.2. Products
- 12.1.7.3. Company Financials
- 12.1.7.4. SWOT Analysis
- 12.1.8 Teknos Group
- 12.1.8.1. Company Overview
- 12.1.8.2. Products
- 12.1.8.3. Company Financials
- 12.1.8.4. SWOT Analysis
- 12.1.9 Lonza
- 12.1.9.1. Company Overview
- 12.1.9.2. Products
- 12.1.9.3. Company Financials
- 12.1.9.4. SWOT Analysis
- 12.1.10 Covestro AG
- 12.1.10.1. Company Overview
- 12.1.10.2. Products
- 12.1.10.3. Company Financials
- 12.1.10.4. SWOT Analysis
- 12.1.11 Armorthane
- 12.1.11.1. Company Overview
- 12.1.11.2. Products
- 12.1.11.3. Company Financials
- 12.1.11.4. SWOT Analysis
- 12.1.1 SATYEN POLYMERS PVT LTD (TEVO)
- 12.2. Market Entropy
- 12.2.1 Company's Key Areas Served
- 12.2.2 Recent Developments
- 12.3. Company Market Share Analysis 2025
- 12.3.1 Top 5 Companies Market Share Analysis
- 12.3.2 Top 3 Companies Market Share Analysis
- 12.4. List of Potential Customers
- 13. Research Methodology
List of Figures
- Figure 1: Global Polyurea Industry Revenue Breakdown (Million, %) by Region 2025 & 2033
- Figure 2: Global Polyurea Industry Volume Breakdown (K Tons, %) by Region 2025 & 2033
- Figure 3: Asia Pacific Polyurea Industry Revenue (Million), by Chemical Structure 2025 & 2033
- Figure 4: Asia Pacific Polyurea Industry Volume (K Tons), by Chemical Structure 2025 & 2033
- Figure 5: Asia Pacific Polyurea Industry Revenue Share (%), by Chemical Structure 2025 & 2033
- Figure 6: Asia Pacific Polyurea Industry Volume Share (%), by Chemical Structure 2025 & 2033
- Figure 7: Asia Pacific Polyurea Industry Revenue (Million), by Type 2025 & 2033
- Figure 8: Asia Pacific Polyurea Industry Volume (K Tons), by Type 2025 & 2033
- Figure 9: Asia Pacific Polyurea Industry Revenue Share (%), by Type 2025 & 2033
- Figure 10: Asia Pacific Polyurea Industry Volume Share (%), by Type 2025 & 2033
- Figure 11: Asia Pacific Polyurea Industry Revenue (Million), by Product 2025 & 2033
- Figure 12: Asia Pacific Polyurea Industry Volume (K Tons), by Product 2025 & 2033
- Figure 13: Asia Pacific Polyurea Industry Revenue Share (%), by Product 2025 & 2033
- Figure 14: Asia Pacific Polyurea Industry Volume Share (%), by Product 2025 & 2033
- Figure 15: Asia Pacific Polyurea Industry Revenue (Million), by End-user Industry 2025 & 2033
- Figure 16: Asia Pacific Polyurea Industry Volume (K Tons), by End-user Industry 2025 & 2033
- Figure 17: Asia Pacific Polyurea Industry Revenue Share (%), by End-user Industry 2025 & 2033
- Figure 18: Asia Pacific Polyurea Industry Volume Share (%), by End-user Industry 2025 & 2033
- Figure 19: Asia Pacific Polyurea Industry Revenue (Million), by Country 2025 & 2033
- Figure 20: Asia Pacific Polyurea Industry Volume (K Tons), by Country 2025 & 2033
- Figure 21: Asia Pacific Polyurea Industry Revenue Share (%), by Country 2025 & 2033
- Figure 22: Asia Pacific Polyurea Industry Volume Share (%), by Country 2025 & 2033
- Figure 23: North America Polyurea Industry Revenue (Million), by Chemical Structure 2025 & 2033
- Figure 24: North America Polyurea Industry Volume (K Tons), by Chemical Structure 2025 & 2033
- Figure 25: North America Polyurea Industry Revenue Share (%), by Chemical Structure 2025 & 2033
- Figure 26: North America Polyurea Industry Volume Share (%), by Chemical Structure 2025 & 2033
- Figure 27: North America Polyurea Industry Revenue (Million), by Type 2025 & 2033
- Figure 28: North America Polyurea Industry Volume (K Tons), by Type 2025 & 2033
- Figure 29: North America Polyurea Industry Revenue Share (%), by Type 2025 & 2033
- Figure 30: North America Polyurea Industry Volume Share (%), by Type 2025 & 2033
- Figure 31: North America Polyurea Industry Revenue (Million), by Product 2025 & 2033
- Figure 32: North America Polyurea Industry Volume (K Tons), by Product 2025 & 2033
- Figure 33: North America Polyurea Industry Revenue Share (%), by Product 2025 & 2033
- Figure 34: North America Polyurea Industry Volume Share (%), by Product 2025 & 2033
- Figure 35: North America Polyurea Industry Revenue (Million), by End-user Industry 2025 & 2033
- Figure 36: North America Polyurea Industry Volume (K Tons), by End-user Industry 2025 & 2033
- Figure 37: North America Polyurea Industry Revenue Share (%), by End-user Industry 2025 & 2033
- Figure 38: North America Polyurea Industry Volume Share (%), by End-user Industry 2025 & 2033
- Figure 39: North America Polyurea Industry Revenue (Million), by Country 2025 & 2033
- Figure 40: North America Polyurea Industry Volume (K Tons), by Country 2025 & 2033
- Figure 41: North America Polyurea Industry Revenue Share (%), by Country 2025 & 2033
- Figure 42: North America Polyurea Industry Volume Share (%), by Country 2025 & 2033
- Figure 43: Europe Polyurea Industry Revenue (Million), by Chemical Structure 2025 & 2033
- Figure 44: Europe Polyurea Industry Volume (K Tons), by Chemical Structure 2025 & 2033
- Figure 45: Europe Polyurea Industry Revenue Share (%), by Chemical Structure 2025 & 2033
- Figure 46: Europe Polyurea Industry Volume Share (%), by Chemical Structure 2025 & 2033
- Figure 47: Europe Polyurea Industry Revenue (Million), by Type 2025 & 2033
- Figure 48: Europe Polyurea Industry Volume (K Tons), by Type 2025 & 2033
- Figure 49: Europe Polyurea Industry Revenue Share (%), by Type 2025 & 2033
- Figure 50: Europe Polyurea Industry Volume Share (%), by Type 2025 & 2033
- Figure 51: Europe Polyurea Industry Revenue (Million), by Product 2025 & 2033
- Figure 52: Europe Polyurea Industry Volume (K Tons), by Product 2025 & 2033
- Figure 53: Europe Polyurea Industry Revenue Share (%), by Product 2025 & 2033
- Figure 54: Europe Polyurea Industry Volume Share (%), by Product 2025 & 2033
- Figure 55: Europe Polyurea Industry Revenue (Million), by End-user Industry 2025 & 2033
- Figure 56: Europe Polyurea Industry Volume (K Tons), by End-user Industry 2025 & 2033
- Figure 57: Europe Polyurea Industry Revenue Share (%), by End-user Industry 2025 & 2033
- Figure 58: Europe Polyurea Industry Volume Share (%), by End-user Industry 2025 & 2033
- Figure 59: Europe Polyurea Industry Revenue (Million), by Country 2025 & 2033
- Figure 60: Europe Polyurea Industry Volume (K Tons), by Country 2025 & 2033
- Figure 61: Europe Polyurea Industry Revenue Share (%), by Country 2025 & 2033
- Figure 62: Europe Polyurea Industry Volume Share (%), by Country 2025 & 2033
- Figure 63: South America Polyurea Industry Revenue (Million), by Chemical Structure 2025 & 2033
- Figure 64: South America Polyurea Industry Volume (K Tons), by Chemical Structure 2025 & 2033
- Figure 65: South America Polyurea Industry Revenue Share (%), by Chemical Structure 2025 & 2033
- Figure 66: South America Polyurea Industry Volume Share (%), by Chemical Structure 2025 & 2033
- Figure 67: South America Polyurea Industry Revenue (Million), by Type 2025 & 2033
- Figure 68: South America Polyurea Industry Volume (K Tons), by Type 2025 & 2033
- Figure 69: South America Polyurea Industry Revenue Share (%), by Type 2025 & 2033
- Figure 70: South America Polyurea Industry Volume Share (%), by Type 2025 & 2033
- Figure 71: South America Polyurea Industry Revenue (Million), by Product 2025 & 2033
- Figure 72: South America Polyurea Industry Volume (K Tons), by Product 2025 & 2033
- Figure 73: South America Polyurea Industry Revenue Share (%), by Product 2025 & 2033
- Figure 74: South America Polyurea Industry Volume Share (%), by Product 2025 & 2033
- Figure 75: South America Polyurea Industry Revenue (Million), by End-user Industry 2025 & 2033
- Figure 76: South America Polyurea Industry Volume (K Tons), by End-user Industry 2025 & 2033
- Figure 77: South America Polyurea Industry Revenue Share (%), by End-user Industry 2025 & 2033
- Figure 78: South America Polyurea Industry Volume Share (%), by End-user Industry 2025 & 2033
- Figure 79: South America Polyurea Industry Revenue (Million), by Country 2025 & 2033
- Figure 80: South America Polyurea Industry Volume (K Tons), by Country 2025 & 2033
- Figure 81: South America Polyurea Industry Revenue Share (%), by Country 2025 & 2033
- Figure 82: South America Polyurea Industry Volume Share (%), by Country 2025 & 2033
- Figure 83: Middle East and Africa Polyurea Industry Revenue (Million), by Chemical Structure 2025 & 2033
- Figure 84: Middle East and Africa Polyurea Industry Volume (K Tons), by Chemical Structure 2025 & 2033
- Figure 85: Middle East and Africa Polyurea Industry Revenue Share (%), by Chemical Structure 2025 & 2033
- Figure 86: Middle East and Africa Polyurea Industry Volume Share (%), by Chemical Structure 2025 & 2033
- Figure 87: Middle East and Africa Polyurea Industry Revenue (Million), by Type 2025 & 2033
- Figure 88: Middle East and Africa Polyurea Industry Volume (K Tons), by Type 2025 & 2033
- Figure 89: Middle East and Africa Polyurea Industry Revenue Share (%), by Type 2025 & 2033
- Figure 90: Middle East and Africa Polyurea Industry Volume Share (%), by Type 2025 & 2033
- Figure 91: Middle East and Africa Polyurea Industry Revenue (Million), by Product 2025 & 2033
- Figure 92: Middle East and Africa Polyurea Industry Volume (K Tons), by Product 2025 & 2033
- Figure 93: Middle East and Africa Polyurea Industry Revenue Share (%), by Product 2025 & 2033
- Figure 94: Middle East and Africa Polyurea Industry Volume Share (%), by Product 2025 & 2033
- Figure 95: Middle East and Africa Polyurea Industry Revenue (Million), by End-user Industry 2025 & 2033
- Figure 96: Middle East and Africa Polyurea Industry Volume (K Tons), by End-user Industry 2025 & 2033
- Figure 97: Middle East and Africa Polyurea Industry Revenue Share (%), by End-user Industry 2025 & 2033
- Figure 98: Middle East and Africa Polyurea Industry Volume Share (%), by End-user Industry 2025 & 2033
- Figure 99: Middle East and Africa Polyurea Industry Revenue (Million), by Country 2025 & 2033
- Figure 100: Middle East and Africa Polyurea Industry Volume (K Tons), by Country 2025 & 2033
- Figure 101: Middle East and Africa Polyurea Industry Revenue Share (%), by Country 2025 & 2033
- Figure 102: Middle East and Africa Polyurea Industry Volume Share (%), by Country 2025 & 2033
List of Tables
- Table 1: Global Polyurea Industry Revenue Million Forecast, by Chemical Structure 2020 & 2033
- Table 2: Global Polyurea Industry Volume K Tons Forecast, by Chemical Structure 2020 & 2033
- Table 3: Global Polyurea Industry Revenue Million Forecast, by Type 2020 & 2033
- Table 4: Global Polyurea Industry Volume K Tons Forecast, by Type 2020 & 2033
- Table 5: Global Polyurea Industry Revenue Million Forecast, by Product 2020 & 2033
- Table 6: Global Polyurea Industry Volume K Tons Forecast, by Product 2020 & 2033
- Table 7: Global Polyurea Industry Revenue Million Forecast, by End-user Industry 2020 & 2033
- Table 8: Global Polyurea Industry Volume K Tons Forecast, by End-user Industry 2020 & 2033
- Table 9: Global Polyurea Industry Revenue Million Forecast, by Region 2020 & 2033
- Table 10: Global Polyurea Industry Volume K Tons Forecast, by Region 2020 & 2033
- Table 11: Global Polyurea Industry Revenue Million Forecast, by Chemical Structure 2020 & 2033
- Table 12: Global Polyurea Industry Volume K Tons Forecast, by Chemical Structure 2020 & 2033
- Table 13: Global Polyurea Industry Revenue Million Forecast, by Type 2020 & 2033
- Table 14: Global Polyurea Industry Volume K Tons Forecast, by Type 2020 & 2033
- Table 15: Global Polyurea Industry Revenue Million Forecast, by Product 2020 & 2033
- Table 16: Global Polyurea Industry Volume K Tons Forecast, by Product 2020 & 2033
- Table 17: Global Polyurea Industry Revenue Million Forecast, by End-user Industry 2020 & 2033
- Table 18: Global Polyurea Industry Volume K Tons Forecast, by End-user Industry 2020 & 2033
- Table 19: Global Polyurea Industry Revenue Million Forecast, by Country 2020 & 2033
- Table 20: Global Polyurea Industry Volume K Tons Forecast, by Country 2020 & 2033
- Table 21: China Polyurea Industry Revenue (Million) Forecast, by Application 2020 & 2033
- Table 22: China Polyurea Industry Volume (K Tons) Forecast, by Application 2020 & 2033
- Table 23: India Polyurea Industry Revenue (Million) Forecast, by Application 2020 & 2033
- Table 24: India Polyurea Industry Volume (K Tons) Forecast, by Application 2020 & 2033
- Table 25: Japan Polyurea Industry Revenue (Million) Forecast, by Application 2020 & 2033
- Table 26: Japan Polyurea Industry Volume (K Tons) Forecast, by Application 2020 & 2033
- Table 27: South Korea Polyurea Industry Revenue (Million) Forecast, by Application 2020 & 2033
- Table 28: South Korea Polyurea Industry Volume (K Tons) Forecast, by Application 2020 & 2033
- Table 29: Rest of Asia Pacific Polyurea Industry Revenue (Million) Forecast, by Application 2020 & 2033
- Table 30: Rest of Asia Pacific Polyurea Industry Volume (K Tons) Forecast, by Application 2020 & 2033
- Table 31: Global Polyurea Industry Revenue Million Forecast, by Chemical Structure 2020 & 2033
- Table 32: Global Polyurea Industry Volume K Tons Forecast, by Chemical Structure 2020 & 2033
- Table 33: Global Polyurea Industry Revenue Million Forecast, by Type 2020 & 2033
- Table 34: Global Polyurea Industry Volume K Tons Forecast, by Type 2020 & 2033
- Table 35: Global Polyurea Industry Revenue Million Forecast, by Product 2020 & 2033
- Table 36: Global Polyurea Industry Volume K Tons Forecast, by Product 2020 & 2033
- Table 37: Global Polyurea Industry Revenue Million Forecast, by End-user Industry 2020 & 2033
- Table 38: Global Polyurea Industry Volume K Tons Forecast, by End-user Industry 2020 & 2033
- Table 39: Global Polyurea Industry Revenue Million Forecast, by Country 2020 & 2033
- Table 40: Global Polyurea Industry Volume K Tons Forecast, by Country 2020 & 2033
- Table 41: United States Polyurea Industry Revenue (Million) Forecast, by Application 2020 & 2033
- Table 42: United States Polyurea Industry Volume (K Tons) Forecast, by Application 2020 & 2033
- Table 43: Canada Polyurea Industry Revenue (Million) Forecast, by Application 2020 & 2033
- Table 44: Canada Polyurea Industry Volume (K Tons) Forecast, by Application 2020 & 2033
- Table 45: Mexico Polyurea Industry Revenue (Million) Forecast, by Application 2020 & 2033
- Table 46: Mexico Polyurea Industry Volume (K Tons) Forecast, by Application 2020 & 2033
- Table 47: Global Polyurea Industry Revenue Million Forecast, by Chemical Structure 2020 & 2033
- Table 48: Global Polyurea Industry Volume K Tons Forecast, by Chemical Structure 2020 & 2033
- Table 49: Global Polyurea Industry Revenue Million Forecast, by Type 2020 & 2033
- Table 50: Global Polyurea Industry Volume K Tons Forecast, by Type 2020 & 2033
- Table 51: Global Polyurea Industry Revenue Million Forecast, by Product 2020 & 2033
- Table 52: Global Polyurea Industry Volume K Tons Forecast, by Product 2020 & 2033
- Table 53: Global Polyurea Industry Revenue Million Forecast, by End-user Industry 2020 & 2033
- Table 54: Global Polyurea Industry Volume K Tons Forecast, by End-user Industry 2020 & 2033
- Table 55: Global Polyurea Industry Revenue Million Forecast, by Country 2020 & 2033
- Table 56: Global Polyurea Industry Volume K Tons Forecast, by Country 2020 & 2033
- Table 57: Germany Polyurea Industry Revenue (Million) Forecast, by Application 2020 & 2033
- Table 58: Germany Polyurea Industry Volume (K Tons) Forecast, by Application 2020 & 2033
- Table 59: United Kingdom Polyurea Industry Revenue (Million) Forecast, by Application 2020 & 2033
- Table 60: United Kingdom Polyurea Industry Volume (K Tons) Forecast, by Application 2020 & 2033
- Table 61: France Polyurea Industry Revenue (Million) Forecast, by Application 2020 & 2033
- Table 62: France Polyurea Industry Volume (K Tons) Forecast, by Application 2020 & 2033
- Table 63: Italy Polyurea Industry Revenue (Million) Forecast, by Application 2020 & 2033
- Table 64: Italy Polyurea Industry Volume (K Tons) Forecast, by Application 2020 & 2033
- Table 65: Rest of Europe Polyurea Industry Revenue (Million) Forecast, by Application 2020 & 2033
- Table 66: Rest of Europe Polyurea Industry Volume (K Tons) Forecast, by Application 2020 & 2033
- Table 67: Global Polyurea Industry Revenue Million Forecast, by Chemical Structure 2020 & 2033
- Table 68: Global Polyurea Industry Volume K Tons Forecast, by Chemical Structure 2020 & 2033
- Table 69: Global Polyurea Industry Revenue Million Forecast, by Type 2020 & 2033
- Table 70: Global Polyurea Industry Volume K Tons Forecast, by Type 2020 & 2033
- Table 71: Global Polyurea Industry Revenue Million Forecast, by Product 2020 & 2033
- Table 72: Global Polyurea Industry Volume K Tons Forecast, by Product 2020 & 2033
- Table 73: Global Polyurea Industry Revenue Million Forecast, by End-user Industry 2020 & 2033
- Table 74: Global Polyurea Industry Volume K Tons Forecast, by End-user Industry 2020 & 2033
- Table 75: Global Polyurea Industry Revenue Million Forecast, by Country 2020 & 2033
- Table 76: Global Polyurea Industry Volume K Tons Forecast, by Country 2020 & 2033
- Table 77: Brazil Polyurea Industry Revenue (Million) Forecast, by Application 2020 & 2033
- Table 78: Brazil Polyurea Industry Volume (K Tons) Forecast, by Application 2020 & 2033
- Table 79: Argentina Polyurea Industry Revenue (Million) Forecast, by Application 2020 & 2033
- Table 80: Argentina Polyurea Industry Volume (K Tons) Forecast, by Application 2020 & 2033
- Table 81: Rest of South America Polyurea Industry Revenue (Million) Forecast, by Application 2020 & 2033
- Table 82: Rest of South America Polyurea Industry Volume (K Tons) Forecast, by Application 2020 & 2033
- Table 83: Global Polyurea Industry Revenue Million Forecast, by Chemical Structure 2020 & 2033
- Table 84: Global Polyurea Industry Volume K Tons Forecast, by Chemical Structure 2020 & 2033
- Table 85: Global Polyurea Industry Revenue Million Forecast, by Type 2020 & 2033
- Table 86: Global Polyurea Industry Volume K Tons Forecast, by Type 2020 & 2033
- Table 87: Global Polyurea Industry Revenue Million Forecast, by Product 2020 & 2033
- Table 88: Global Polyurea Industry Volume K Tons Forecast, by Product 2020 & 2033
- Table 89: Global Polyurea Industry Revenue Million Forecast, by End-user Industry 2020 & 2033
- Table 90: Global Polyurea Industry Volume K Tons Forecast, by End-user Industry 2020 & 2033
- Table 91: Global Polyurea Industry Revenue Million Forecast, by Country 2020 & 2033
- Table 92: Global Polyurea Industry Volume K Tons Forecast, by Country 2020 & 2033
- Table 93: Saudi Arabia Polyurea Industry Revenue (Million) Forecast, by Application 2020 & 2033
- Table 94: Saudi Arabia Polyurea Industry Volume (K Tons) Forecast, by Application 2020 & 2033
- Table 95: South Africa Polyurea Industry Revenue (Million) Forecast, by Application 2020 & 2033
- Table 96: South Africa Polyurea Industry Volume (K Tons) Forecast, by Application 2020 & 2033
- Table 97: Rest of Middle East and Africa Polyurea Industry Revenue (Million) Forecast, by Application 2020 & 2033
- Table 98: Rest of Middle East and Africa Polyurea Industry Volume (K Tons) Forecast, by Application 2020 & 2033
Frequently Asked Questions
1. What is the projected Compound Annual Growth Rate (CAGR) of the Polyurea Industry?
The projected CAGR is approximately > 5.60%.
2. Which companies are prominent players in the Polyurea Industry?
Key companies in the market include SATYEN POLYMERS PVT LTD (TEVO), Dorf Ketal, Rhino Linings Corporation, CITADEL FLOORS, Huntsman International LLC, Elastothane, Speciality Products Inc, Teknos Group, Lonza, Covestro AG, Armorthane.
3. What are the main segments of the Polyurea Industry?
The market segments include Chemical Structure, Type, Product, End-user Industry.
4. Can you provide details about the market size?
The market size is estimated to be USD 1.02 Million as of 2022.
5. What are some drivers contributing to market growth?
Growing Demand of Polyurea from Construction Industry; Growing Demand from Automotive Sector; Other Drivers.
6. What are the notable trends driving market growth?
Growing Demand for Polyurea from the Construction Industry.
7. Are there any restraints impacting market growth?
Volatility in Raw Material Price; Other Restraints.
8. Can you provide examples of recent developments in the market?
January 2023: Teknos Deutschland GmbH plans to relocate its production from Fulda to the existing Brüggen site. The relocation aims to develop further the production and delivery capabilities of Teknos Deutschland GmbH in Germany. This enhancement of production capabilities is likely to boost the market for polyurea in Germany.
9. What pricing options are available for accessing the report?
Pricing options include single-user, multi-user, and enterprise licenses priced at USD 4750, USD 5250, and USD 8750 respectively.
10. Is the market size provided in terms of value or volume?
The market size is provided in terms of value, measured in Million and volume, measured in K Tons.
11. Are there any specific market keywords associated with the report?
Yes, the market keyword associated with the report is "Polyurea Industry," which aids in identifying and referencing the specific market segment covered.
12. How do I determine which pricing option suits my needs best?
The pricing options vary based on user requirements and access needs. Individual users may opt for single-user licenses, while businesses requiring broader access may choose multi-user or enterprise licenses for cost-effective access to the report.
13. Are there any additional resources or data provided in the Polyurea Industry report?
While the report offers comprehensive insights, it's advisable to review the specific contents or supplementary materials provided to ascertain if additional resources or data are available.
14. How can I stay updated on further developments or reports in the Polyurea Industry?
To stay informed about further developments, trends, and reports in the Polyurea Industry, consider subscribing to industry newsletters, following relevant companies and organizations, or regularly checking reputable industry news sources and publications.
Methodology
Step 1 - Identification of Relevant Samples Size from Population Database


Step 2 - Approaches for Defining Global Market Size (Value, Volume* & Price*)

Note*: In applicable scenarios
Step 3 - Data Sources
Primary Research
- Web Analytics
- Survey Reports
- Research Institute
- Latest Research Reports
- Opinion Leaders
Secondary Research
- Annual Reports
- White Paper
- Latest Press Release
- Industry Association
- Paid Database
- Investor Presentations

Step 4 - Data Triangulation
Involves using different sources of information in order to increase the validity of a study
These sources are likely to be stakeholders in a program - participants, other researchers, program staff, other community members, and so on.
Then we put all data in single framework & apply various statistical tools to find out the dynamic on the market.
During the analysis stage, feedback from the stakeholder groups would be compared to determine areas of agreement as well as areas of divergence