
Key Insights
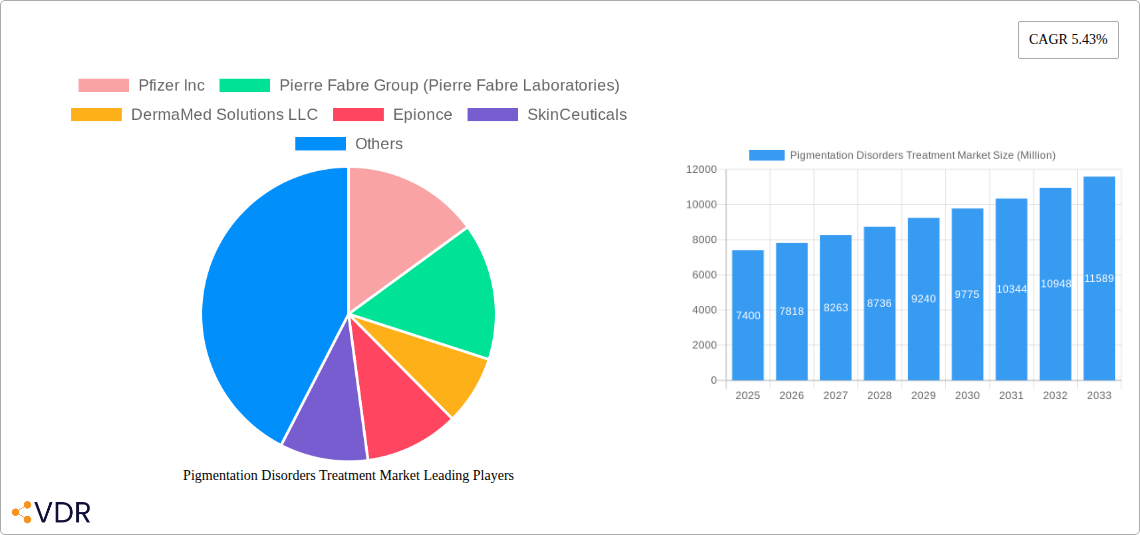
The global Pigmentation Disorders Treatment Market, valued at $7.40 billion in 2025, is projected to experience robust growth, driven by rising prevalence of skin conditions like vitiligo, melasma, and post-inflammatory hyperpigmentation (PIH), coupled with increasing awareness and adoption of advanced treatment options. The market's Compound Annual Growth Rate (CAGR) of 5.43% from 2025 to 2033 indicates a significant expansion, primarily fueled by technological advancements in laser therapies, chemical peels, and topical treatments offering improved efficacy and reduced side effects. The increasing demand for non-invasive and cosmetically appealing procedures further contributes to market growth. The market is segmented by disorder type (albinism, vitiligo, melasma, PIH, and others) and treatment type (topical, dermabrasion, chemical peels, laser, phototherapy, and others), reflecting the diverse approaches to managing pigmentation disorders. North America and Europe currently dominate the market due to higher healthcare expenditure and greater awareness, but the Asia-Pacific region is expected to witness significant growth driven by rising disposable incomes and increasing adoption of aesthetic treatments. Key players like Pfizer, Pierre Fabre, and Galderma are investing in research and development to enhance existing therapies and introduce innovative solutions, strengthening their market presence and driving competition.
The competitive landscape is characterized by established pharmaceutical companies and specialized dermatological firms, each focusing on specific treatment modalities and target segments. The market’s growth will be influenced by factors such as the rising prevalence of skin cancers linked to sun exposure, advancements in understanding the genetic basis of pigmentation disorders, and the increasing availability of affordable treatment options. However, potential restraints include high treatment costs, the potential for adverse reactions to certain procedures, and the lack of awareness in developing regions. Further research focusing on personalized treatment approaches and addressing the unmet needs of patients with rare pigmentation disorders will be crucial for future market expansion. The market's future trajectory suggests a continued upward trend, driven by a convergence of medical advancements and consumer demand for effective and safe solutions for pigmentation disorders.
Pigmentation Disorders Treatment Market: A Comprehensive Report (2019-2033)
This comprehensive report provides a detailed analysis of the Pigmentation Disorders Treatment Market, encompassing market dynamics, growth trends, regional performance, product landscape, key players, and future outlook. The study period covers 2019-2033, with a base year of 2025 and a forecast period of 2025-2033. The market is segmented by type of disorder (Albinism, Vitiligo, Melasma, Post-inflammatory Hyperpigmentation (PIH), Other Types of Disorders) and treatment type (Topical Treatment, Dermabrasion, Chemical Peels, Laser Treatment, Phototherapy, Other Treatment Types). The global market size in 2025 is estimated at xx Million.
Pigmentation Disorders Treatment Market Dynamics & Structure
The Pigmentation Disorders Treatment Market is characterized by a moderately consolidated structure with several key players holding significant market share. Technological innovation, particularly in laser treatments and topical formulations, is a major driver of growth. Stringent regulatory frameworks governing the approval of new treatments influence market entry and expansion. The market also faces competition from alternative therapies and home remedies. End-user demographics, largely driven by increasing awareness and aesthetic concerns, play a crucial role. M&A activity has been moderate, with several strategic partnerships forming to enhance product portfolios and geographical reach.
- Market Concentration: Moderately consolidated, with top 10 players holding approximately xx% market share in 2025.
- Technological Innovation: Significant advancements in laser technology, topical formulations, and combination therapies are driving market growth.
- Regulatory Frameworks: Stringent FDA and EMA approvals impact market entry and expansion.
- Competitive Substitutes: Home remedies and alternative therapies pose competitive challenges.
- End-User Demographics: Rising awareness of pigmentation disorders and aesthetic preferences are fueling demand.
- M&A Trends: Moderate M&A activity, primarily focused on strategic partnerships and acquisitions of smaller players.
Pigmentation Disorders Treatment Market Growth Trends & Insights
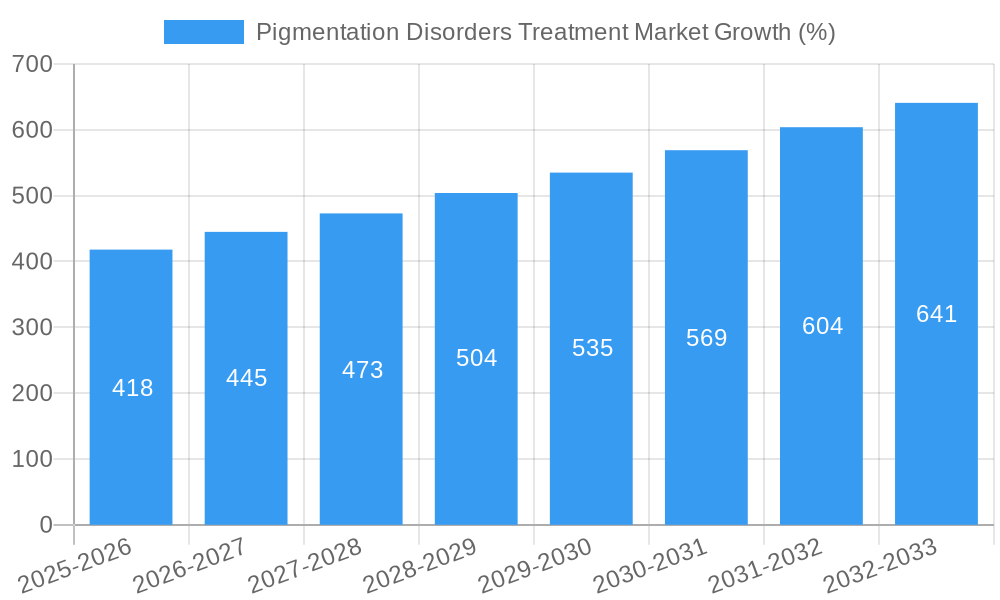
The Pigmentation Disorders Treatment Market is projected to experience substantial growth during the forecast period (2025-2033), driven by several factors. The market size is expected to reach xx Million by 2033, exhibiting a CAGR of xx% during the forecast period. This growth is fueled by rising prevalence of pigmentation disorders, increasing disposable incomes, and growing awareness of available treatments. Technological advancements, especially in laser therapy and personalized treatments, are further enhancing market adoption rates. Shifting consumer preferences towards minimally invasive and effective treatments also contribute significantly to market expansion. Specific metrics, such as market penetration rates for various treatment types, are included in the detailed report.
Dominant Regions, Countries, or Segments in Pigmentation Disorders Treatment Market
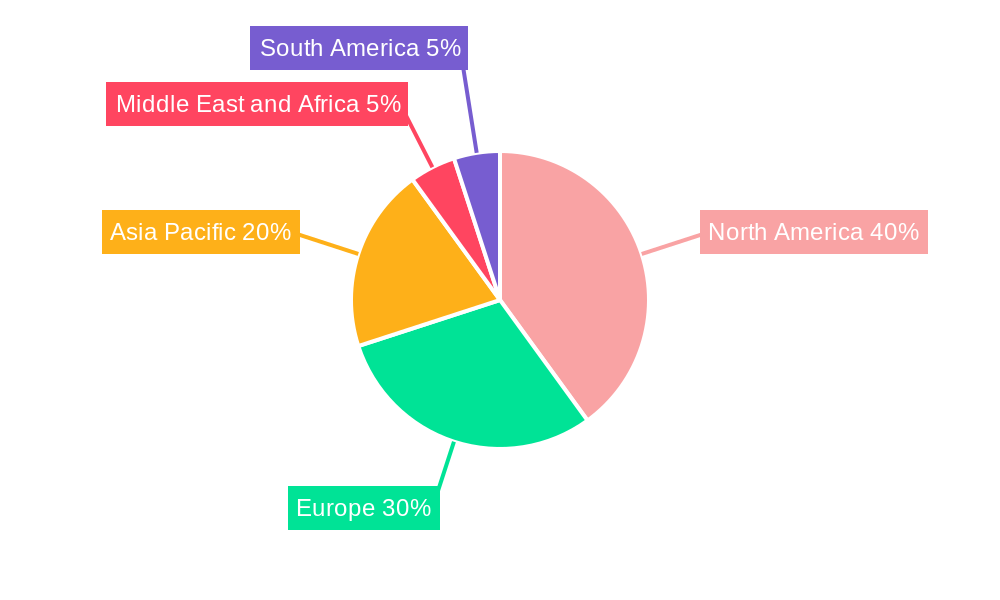
North America currently holds the largest market share due to high healthcare expenditure, advanced healthcare infrastructure, and increased awareness among consumers. However, Asia Pacific is expected to exhibit the highest growth rate during the forecast period, driven by rising disposable incomes, improving healthcare access, and a large patient population. Within the segments, Topical Treatments dominate the treatment type segment due to their convenience and affordability. Vitiligo and Melasma are the leading disorder types driving market growth, influenced by their higher prevalence and visible nature.
- North America: High healthcare expenditure, advanced infrastructure, and high awareness drive market leadership.
- Asia Pacific: Fastest-growing region due to rising disposable incomes, expanding healthcare access, and large population base.
- Topical Treatments: Dominates the treatment type segment due to ease of use and cost-effectiveness.
- Vitiligo and Melasma: Leading disorder types driving market growth due to higher prevalence and visible nature.
Pigmentation Disorders Treatment Market Product Landscape
The Pigmentation Disorders Treatment Market offers a diverse range of products, including topical creams, gels, lotions, and serums, as well as advanced treatment modalities like laser therapy, chemical peels, and dermabrasion. Product innovation focuses on improving efficacy, reducing side effects, and enhancing patient experience. Many products emphasize natural ingredients and personalized treatment approaches to cater to individual needs. Technological advancements in laser technology, such as fractional lasers and ultrafast lasers, have significantly improved treatment outcomes and reduced recovery time.
Key Drivers, Barriers & Challenges in Pigmentation Disorders Treatment Market
Key Drivers: Increasing prevalence of pigmentation disorders, rising disposable incomes, growing awareness, technological advancements in treatment modalities, and the increasing demand for aesthetic treatments fuel market growth.
Key Challenges: High treatment costs, potential side effects of certain treatments, stringent regulatory approvals, and the availability of effective yet affordable alternative therapies represent key market restraints. The impact of these factors is quantified within the detailed report.
Emerging Opportunities in Pigmentation Disorders Treatment Market
Untapped markets in developing economies offer significant growth potential. Further development of personalized treatments, incorporating genomics and skin typing, represents a major opportunity. The growing demand for minimally invasive procedures and combination therapies also presents new avenues for market expansion. Moreover, exploring natural and herbal ingredients for pigmentation treatment holds immense promise.
Growth Accelerators in the Pigmentation Disorders Treatment Market Industry
Technological breakthroughs in targeted therapies, strategic partnerships among pharmaceutical and cosmetic companies, and market expansion into new geographical regions will drive long-term growth. Increased investment in R&D and collaborations with academic institutions are expected to accelerate the development of novel and effective treatments.
Key Players Shaping the Pigmentation Disorders Treatment Market Market
- Pfizer Inc
- Pierre Fabre Group (Pierre Fabre Laboratories)
- DermaMed Solutions LLC
- Epionce
- SkinCeuticals
- Obagi Cosmeceuticals LLC
- Candela Corporation
- Merz GmbH & Co KGaA
- Galderma SA
- L'Oreal SA
- Vital Esthetique
- AbbVie Inc (Allergan Inc)
Notable Milestones in Pigmentation Disorders Treatment Market Sector
- July 2022: Incyte Corporation received FDA approval for Opzelura (ruxolitinib) cream for non-segmental vitiligo. This approval significantly expanded treatment options and boosted market growth.
- June 2022: Ahammune Biosciences and Veeda Clinical Research collaborated on human trials for AB1001, a novel topical vitiligo therapy, signifying the ongoing innovation within the market.
In-Depth Pigmentation Disorders Treatment Market Market Outlook
The Pigmentation Disorders Treatment Market is poised for substantial growth, fueled by technological innovation and increasing demand. Strategic partnerships and investments in R&D will further accelerate market expansion. Companies focusing on personalized treatments and minimally invasive procedures are expected to gain a competitive advantage. The market presents lucrative opportunities for players who can effectively address unmet needs and deliver safe and effective treatments.
Pigmentation Disorders Treatment Market Segmentation
-
1. Type of Disorder
- 1.1. Albinism
- 1.2. Vitiligo
- 1.3. Melasma
- 1.4. Post-inflammatory Hyperpigmentation (PIH)
- 1.5. Other Types of Disorders
-
2. Treatment Type
- 2.1. Topical Treatment
- 2.2. Dermabrasion
- 2.3. Chemical Peels
- 2.4. Laser Treatment
- 2.5. Phototherapy
- 2.6. Other Treatment Types
Pigmentation Disorders Treatment Market Segmentation By Geography
-
1. North America
- 1.1. United States
- 1.2. Canada
- 1.3. Mexico
-
2. Europe
- 2.1. Germany
- 2.2. United Kingdom
- 2.3. France
- 2.4. Italy
- 2.5. Spain
- 2.6. Rest of Europe
-
3. Asia Pacific
- 3.1. China
- 3.2. Japan
- 3.3. India
- 3.4. Australia
- 3.5. South Korea
- 3.6. Rest of Asia Pacific
-
4. Middle East and Africa
- 4.1. GCC
- 4.2. South Africa
- 4.3. Rest of Middle East and Africa
-
5. South America
- 5.1. Brazil
- 5.2. Argentina
- 5.3. Rest of South America
Pigmentation Disorders Treatment Market REPORT HIGHLIGHTS
| Aspects | Details |
|---|---|
| Study Period | 2019-2033 |
| Base Year | 2024 |
| Estimated Year | 2025 |
| Forecast Period | 2025-2033 |
| Historical Period | 2019-2024 |
| Growth Rate | CAGR of 5.43% from 2019-2033 |
| Segmentation |
|
Table of Contents
- 1. Introduction
- 1.1. Research Scope
- 1.2. Market Segmentation
- 1.3. Research Methodology
- 1.4. Definitions and Assumptions
- 2. Executive Summary
- 2.1. Introduction
- 3. Market Dynamics
- 3.1. Introduction
- 3.2. Market Drivers
- 3.2.1. Increasing Prevalence of Pigmentation Disorders; Growing Expenditure on Dermatalogical Treatments
- 3.3. Market Restrains
- 3.3.1. High Cost of Cosmetic Procedures; Inadequate Reimbursement Policies
- 3.4. Market Trends
- 3.4.1. Topical Treatment Segment Expected to Hold Significant Market Share
- 4. Market Factor Analysis
- 4.1. Porters Five Forces
- 4.2. Supply/Value Chain
- 4.3. PESTEL analysis
- 4.4. Market Entropy
- 4.5. Patent/Trademark Analysis
- 5. Global Pigmentation Disorders Treatment Market Analysis, Insights and Forecast, 2019-2031
- 5.1. Market Analysis, Insights and Forecast - by Type of Disorder
- 5.1.1. Albinism
- 5.1.2. Vitiligo
- 5.1.3. Melasma
- 5.1.4. Post-inflammatory Hyperpigmentation (PIH)
- 5.1.5. Other Types of Disorders
- 5.2. Market Analysis, Insights and Forecast - by Treatment Type
- 5.2.1. Topical Treatment
- 5.2.2. Dermabrasion
- 5.2.3. Chemical Peels
- 5.2.4. Laser Treatment
- 5.2.5. Phototherapy
- 5.2.6. Other Treatment Types
- 5.3. Market Analysis, Insights and Forecast - by Region
- 5.3.1. North America
- 5.3.2. Europe
- 5.3.3. Asia Pacific
- 5.3.4. Middle East and Africa
- 5.3.5. South America
- 5.1. Market Analysis, Insights and Forecast - by Type of Disorder
- 6. North America Pigmentation Disorders Treatment Market Analysis, Insights and Forecast, 2019-2031
- 6.1. Market Analysis, Insights and Forecast - by Type of Disorder
- 6.1.1. Albinism
- 6.1.2. Vitiligo
- 6.1.3. Melasma
- 6.1.4. Post-inflammatory Hyperpigmentation (PIH)
- 6.1.5. Other Types of Disorders
- 6.2. Market Analysis, Insights and Forecast - by Treatment Type
- 6.2.1. Topical Treatment
- 6.2.2. Dermabrasion
- 6.2.3. Chemical Peels
- 6.2.4. Laser Treatment
- 6.2.5. Phototherapy
- 6.2.6. Other Treatment Types
- 6.1. Market Analysis, Insights and Forecast - by Type of Disorder
- 7. Europe Pigmentation Disorders Treatment Market Analysis, Insights and Forecast, 2019-2031
- 7.1. Market Analysis, Insights and Forecast - by Type of Disorder
- 7.1.1. Albinism
- 7.1.2. Vitiligo
- 7.1.3. Melasma
- 7.1.4. Post-inflammatory Hyperpigmentation (PIH)
- 7.1.5. Other Types of Disorders
- 7.2. Market Analysis, Insights and Forecast - by Treatment Type
- 7.2.1. Topical Treatment
- 7.2.2. Dermabrasion
- 7.2.3. Chemical Peels
- 7.2.4. Laser Treatment
- 7.2.5. Phototherapy
- 7.2.6. Other Treatment Types
- 7.1. Market Analysis, Insights and Forecast - by Type of Disorder
- 8. Asia Pacific Pigmentation Disorders Treatment Market Analysis, Insights and Forecast, 2019-2031
- 8.1. Market Analysis, Insights and Forecast - by Type of Disorder
- 8.1.1. Albinism
- 8.1.2. Vitiligo
- 8.1.3. Melasma
- 8.1.4. Post-inflammatory Hyperpigmentation (PIH)
- 8.1.5. Other Types of Disorders
- 8.2. Market Analysis, Insights and Forecast - by Treatment Type
- 8.2.1. Topical Treatment
- 8.2.2. Dermabrasion
- 8.2.3. Chemical Peels
- 8.2.4. Laser Treatment
- 8.2.5. Phototherapy
- 8.2.6. Other Treatment Types
- 8.1. Market Analysis, Insights and Forecast - by Type of Disorder
- 9. Middle East and Africa Pigmentation Disorders Treatment Market Analysis, Insights and Forecast, 2019-2031
- 9.1. Market Analysis, Insights and Forecast - by Type of Disorder
- 9.1.1. Albinism
- 9.1.2. Vitiligo
- 9.1.3. Melasma
- 9.1.4. Post-inflammatory Hyperpigmentation (PIH)
- 9.1.5. Other Types of Disorders
- 9.2. Market Analysis, Insights and Forecast - by Treatment Type
- 9.2.1. Topical Treatment
- 9.2.2. Dermabrasion
- 9.2.3. Chemical Peels
- 9.2.4. Laser Treatment
- 9.2.5. Phototherapy
- 9.2.6. Other Treatment Types
- 9.1. Market Analysis, Insights and Forecast - by Type of Disorder
- 10. South America Pigmentation Disorders Treatment Market Analysis, Insights and Forecast, 2019-2031
- 10.1. Market Analysis, Insights and Forecast - by Type of Disorder
- 10.1.1. Albinism
- 10.1.2. Vitiligo
- 10.1.3. Melasma
- 10.1.4. Post-inflammatory Hyperpigmentation (PIH)
- 10.1.5. Other Types of Disorders
- 10.2. Market Analysis, Insights and Forecast - by Treatment Type
- 10.2.1. Topical Treatment
- 10.2.2. Dermabrasion
- 10.2.3. Chemical Peels
- 10.2.4. Laser Treatment
- 10.2.5. Phototherapy
- 10.2.6. Other Treatment Types
- 10.1. Market Analysis, Insights and Forecast - by Type of Disorder
- 11. North America Pigmentation Disorders Treatment Market Analysis, Insights and Forecast, 2019-2031
- 11.1. Market Analysis, Insights and Forecast - By Country/Sub-region
- 11.1.1 United States
- 11.1.2 Canada
- 11.1.3 Mexico
- 12. Europe Pigmentation Disorders Treatment Market Analysis, Insights and Forecast, 2019-2031
- 12.1. Market Analysis, Insights and Forecast - By Country/Sub-region
- 12.1.1 Germany
- 12.1.2 United Kingdom
- 12.1.3 France
- 12.1.4 Italy
- 12.1.5 Spain
- 12.1.6 Rest of Europe
- 13. Asia Pacific Pigmentation Disorders Treatment Market Analysis, Insights and Forecast, 2019-2031
- 13.1. Market Analysis, Insights and Forecast - By Country/Sub-region
- 13.1.1 China
- 13.1.2 Japan
- 13.1.3 India
- 13.1.4 Australia
- 13.1.5 South Korea
- 13.1.6 Rest of Asia Pacific
- 14. Middle East and Africa Pigmentation Disorders Treatment Market Analysis, Insights and Forecast, 2019-2031
- 14.1. Market Analysis, Insights and Forecast - By Country/Sub-region
- 14.1.1 GCC
- 14.1.2 South Africa
- 14.1.3 Rest of Middle East and Africa
- 15. South America Pigmentation Disorders Treatment Market Analysis, Insights and Forecast, 2019-2031
- 15.1. Market Analysis, Insights and Forecast - By Country/Sub-region
- 15.1.1 Brazil
- 15.1.2 Argentina
- 15.1.3 Rest of South America
- 16. Competitive Analysis
- 16.1. Global Market Share Analysis 2024
- 16.2. Company Profiles
- 16.2.1 Pfizer Inc
- 16.2.1.1. Overview
- 16.2.1.2. Products
- 16.2.1.3. SWOT Analysis
- 16.2.1.4. Recent Developments
- 16.2.1.5. Financials (Based on Availability)
- 16.2.2 Pierre Fabre Group (Pierre Fabre Laboratories)
- 16.2.2.1. Overview
- 16.2.2.2. Products
- 16.2.2.3. SWOT Analysis
- 16.2.2.4. Recent Developments
- 16.2.2.5. Financials (Based on Availability)
- 16.2.3 DermaMed Solutions LLC
- 16.2.3.1. Overview
- 16.2.3.2. Products
- 16.2.3.3. SWOT Analysis
- 16.2.3.4. Recent Developments
- 16.2.3.5. Financials (Based on Availability)
- 16.2.4 Epionce
- 16.2.4.1. Overview
- 16.2.4.2. Products
- 16.2.4.3. SWOT Analysis
- 16.2.4.4. Recent Developments
- 16.2.4.5. Financials (Based on Availability)
- 16.2.5 SkinCeuticals
- 16.2.5.1. Overview
- 16.2.5.2. Products
- 16.2.5.3. SWOT Analysis
- 16.2.5.4. Recent Developments
- 16.2.5.5. Financials (Based on Availability)
- 16.2.6 Obagi Cosmeceuticals LLC
- 16.2.6.1. Overview
- 16.2.6.2. Products
- 16.2.6.3. SWOT Analysis
- 16.2.6.4. Recent Developments
- 16.2.6.5. Financials (Based on Availability)
- 16.2.7 Candela Corporation
- 16.2.7.1. Overview
- 16.2.7.2. Products
- 16.2.7.3. SWOT Analysis
- 16.2.7.4. Recent Developments
- 16.2.7.5. Financials (Based on Availability)
- 16.2.8 Merz GmbH & Co KGaA
- 16.2.8.1. Overview
- 16.2.8.2. Products
- 16.2.8.3. SWOT Analysis
- 16.2.8.4. Recent Developments
- 16.2.8.5. Financials (Based on Availability)
- 16.2.9 Galderma SA
- 16.2.9.1. Overview
- 16.2.9.2. Products
- 16.2.9.3. SWOT Analysis
- 16.2.9.4. Recent Developments
- 16.2.9.5. Financials (Based on Availability)
- 16.2.10 L'Oreal SA
- 16.2.10.1. Overview
- 16.2.10.2. Products
- 16.2.10.3. SWOT Analysis
- 16.2.10.4. Recent Developments
- 16.2.10.5. Financials (Based on Availability)
- 16.2.11 Vital Esthetique
- 16.2.11.1. Overview
- 16.2.11.2. Products
- 16.2.11.3. SWOT Analysis
- 16.2.11.4. Recent Developments
- 16.2.11.5. Financials (Based on Availability)
- 16.2.12 AbbVie Inc (Allergan Inc )
- 16.2.12.1. Overview
- 16.2.12.2. Products
- 16.2.12.3. SWOT Analysis
- 16.2.12.4. Recent Developments
- 16.2.12.5. Financials (Based on Availability)
- 16.2.1 Pfizer Inc
List of Figures
- Figure 1: Global Pigmentation Disorders Treatment Market Revenue Breakdown (Million, %) by Region 2024 & 2032
- Figure 2: Global Pigmentation Disorders Treatment Market Volume Breakdown (K Unit, %) by Region 2024 & 2032
- Figure 3: North America Pigmentation Disorders Treatment Market Revenue (Million), by Country 2024 & 2032
- Figure 4: North America Pigmentation Disorders Treatment Market Volume (K Unit), by Country 2024 & 2032
- Figure 5: North America Pigmentation Disorders Treatment Market Revenue Share (%), by Country 2024 & 2032
- Figure 6: North America Pigmentation Disorders Treatment Market Volume Share (%), by Country 2024 & 2032
- Figure 7: Europe Pigmentation Disorders Treatment Market Revenue (Million), by Country 2024 & 2032
- Figure 8: Europe Pigmentation Disorders Treatment Market Volume (K Unit), by Country 2024 & 2032
- Figure 9: Europe Pigmentation Disorders Treatment Market Revenue Share (%), by Country 2024 & 2032
- Figure 10: Europe Pigmentation Disorders Treatment Market Volume Share (%), by Country 2024 & 2032
- Figure 11: Asia Pacific Pigmentation Disorders Treatment Market Revenue (Million), by Country 2024 & 2032
- Figure 12: Asia Pacific Pigmentation Disorders Treatment Market Volume (K Unit), by Country 2024 & 2032
- Figure 13: Asia Pacific Pigmentation Disorders Treatment Market Revenue Share (%), by Country 2024 & 2032
- Figure 14: Asia Pacific Pigmentation Disorders Treatment Market Volume Share (%), by Country 2024 & 2032
- Figure 15: Middle East and Africa Pigmentation Disorders Treatment Market Revenue (Million), by Country 2024 & 2032
- Figure 16: Middle East and Africa Pigmentation Disorders Treatment Market Volume (K Unit), by Country 2024 & 2032
- Figure 17: Middle East and Africa Pigmentation Disorders Treatment Market Revenue Share (%), by Country 2024 & 2032
- Figure 18: Middle East and Africa Pigmentation Disorders Treatment Market Volume Share (%), by Country 2024 & 2032
- Figure 19: South America Pigmentation Disorders Treatment Market Revenue (Million), by Country 2024 & 2032
- Figure 20: South America Pigmentation Disorders Treatment Market Volume (K Unit), by Country 2024 & 2032
- Figure 21: South America Pigmentation Disorders Treatment Market Revenue Share (%), by Country 2024 & 2032
- Figure 22: South America Pigmentation Disorders Treatment Market Volume Share (%), by Country 2024 & 2032
- Figure 23: North America Pigmentation Disorders Treatment Market Revenue (Million), by Type of Disorder 2024 & 2032
- Figure 24: North America Pigmentation Disorders Treatment Market Volume (K Unit), by Type of Disorder 2024 & 2032
- Figure 25: North America Pigmentation Disorders Treatment Market Revenue Share (%), by Type of Disorder 2024 & 2032
- Figure 26: North America Pigmentation Disorders Treatment Market Volume Share (%), by Type of Disorder 2024 & 2032
- Figure 27: North America Pigmentation Disorders Treatment Market Revenue (Million), by Treatment Type 2024 & 2032
- Figure 28: North America Pigmentation Disorders Treatment Market Volume (K Unit), by Treatment Type 2024 & 2032
- Figure 29: North America Pigmentation Disorders Treatment Market Revenue Share (%), by Treatment Type 2024 & 2032
- Figure 30: North America Pigmentation Disorders Treatment Market Volume Share (%), by Treatment Type 2024 & 2032
- Figure 31: North America Pigmentation Disorders Treatment Market Revenue (Million), by Country 2024 & 2032
- Figure 32: North America Pigmentation Disorders Treatment Market Volume (K Unit), by Country 2024 & 2032
- Figure 33: North America Pigmentation Disorders Treatment Market Revenue Share (%), by Country 2024 & 2032
- Figure 34: North America Pigmentation Disorders Treatment Market Volume Share (%), by Country 2024 & 2032
- Figure 35: Europe Pigmentation Disorders Treatment Market Revenue (Million), by Type of Disorder 2024 & 2032
- Figure 36: Europe Pigmentation Disorders Treatment Market Volume (K Unit), by Type of Disorder 2024 & 2032
- Figure 37: Europe Pigmentation Disorders Treatment Market Revenue Share (%), by Type of Disorder 2024 & 2032
- Figure 38: Europe Pigmentation Disorders Treatment Market Volume Share (%), by Type of Disorder 2024 & 2032
- Figure 39: Europe Pigmentation Disorders Treatment Market Revenue (Million), by Treatment Type 2024 & 2032
- Figure 40: Europe Pigmentation Disorders Treatment Market Volume (K Unit), by Treatment Type 2024 & 2032
- Figure 41: Europe Pigmentation Disorders Treatment Market Revenue Share (%), by Treatment Type 2024 & 2032
- Figure 42: Europe Pigmentation Disorders Treatment Market Volume Share (%), by Treatment Type 2024 & 2032
- Figure 43: Europe Pigmentation Disorders Treatment Market Revenue (Million), by Country 2024 & 2032
- Figure 44: Europe Pigmentation Disorders Treatment Market Volume (K Unit), by Country 2024 & 2032
- Figure 45: Europe Pigmentation Disorders Treatment Market Revenue Share (%), by Country 2024 & 2032
- Figure 46: Europe Pigmentation Disorders Treatment Market Volume Share (%), by Country 2024 & 2032
- Figure 47: Asia Pacific Pigmentation Disorders Treatment Market Revenue (Million), by Type of Disorder 2024 & 2032
- Figure 48: Asia Pacific Pigmentation Disorders Treatment Market Volume (K Unit), by Type of Disorder 2024 & 2032
- Figure 49: Asia Pacific Pigmentation Disorders Treatment Market Revenue Share (%), by Type of Disorder 2024 & 2032
- Figure 50: Asia Pacific Pigmentation Disorders Treatment Market Volume Share (%), by Type of Disorder 2024 & 2032
- Figure 51: Asia Pacific Pigmentation Disorders Treatment Market Revenue (Million), by Treatment Type 2024 & 2032
- Figure 52: Asia Pacific Pigmentation Disorders Treatment Market Volume (K Unit), by Treatment Type 2024 & 2032
- Figure 53: Asia Pacific Pigmentation Disorders Treatment Market Revenue Share (%), by Treatment Type 2024 & 2032
- Figure 54: Asia Pacific Pigmentation Disorders Treatment Market Volume Share (%), by Treatment Type 2024 & 2032
- Figure 55: Asia Pacific Pigmentation Disorders Treatment Market Revenue (Million), by Country 2024 & 2032
- Figure 56: Asia Pacific Pigmentation Disorders Treatment Market Volume (K Unit), by Country 2024 & 2032
- Figure 57: Asia Pacific Pigmentation Disorders Treatment Market Revenue Share (%), by Country 2024 & 2032
- Figure 58: Asia Pacific Pigmentation Disorders Treatment Market Volume Share (%), by Country 2024 & 2032
- Figure 59: Middle East and Africa Pigmentation Disorders Treatment Market Revenue (Million), by Type of Disorder 2024 & 2032
- Figure 60: Middle East and Africa Pigmentation Disorders Treatment Market Volume (K Unit), by Type of Disorder 2024 & 2032
- Figure 61: Middle East and Africa Pigmentation Disorders Treatment Market Revenue Share (%), by Type of Disorder 2024 & 2032
- Figure 62: Middle East and Africa Pigmentation Disorders Treatment Market Volume Share (%), by Type of Disorder 2024 & 2032
- Figure 63: Middle East and Africa Pigmentation Disorders Treatment Market Revenue (Million), by Treatment Type 2024 & 2032
- Figure 64: Middle East and Africa Pigmentation Disorders Treatment Market Volume (K Unit), by Treatment Type 2024 & 2032
- Figure 65: Middle East and Africa Pigmentation Disorders Treatment Market Revenue Share (%), by Treatment Type 2024 & 2032
- Figure 66: Middle East and Africa Pigmentation Disorders Treatment Market Volume Share (%), by Treatment Type 2024 & 2032
- Figure 67: Middle East and Africa Pigmentation Disorders Treatment Market Revenue (Million), by Country 2024 & 2032
- Figure 68: Middle East and Africa Pigmentation Disorders Treatment Market Volume (K Unit), by Country 2024 & 2032
- Figure 69: Middle East and Africa Pigmentation Disorders Treatment Market Revenue Share (%), by Country 2024 & 2032
- Figure 70: Middle East and Africa Pigmentation Disorders Treatment Market Volume Share (%), by Country 2024 & 2032
- Figure 71: South America Pigmentation Disorders Treatment Market Revenue (Million), by Type of Disorder 2024 & 2032
- Figure 72: South America Pigmentation Disorders Treatment Market Volume (K Unit), by Type of Disorder 2024 & 2032
- Figure 73: South America Pigmentation Disorders Treatment Market Revenue Share (%), by Type of Disorder 2024 & 2032
- Figure 74: South America Pigmentation Disorders Treatment Market Volume Share (%), by Type of Disorder 2024 & 2032
- Figure 75: South America Pigmentation Disorders Treatment Market Revenue (Million), by Treatment Type 2024 & 2032
- Figure 76: South America Pigmentation Disorders Treatment Market Volume (K Unit), by Treatment Type 2024 & 2032
- Figure 77: South America Pigmentation Disorders Treatment Market Revenue Share (%), by Treatment Type 2024 & 2032
- Figure 78: South America Pigmentation Disorders Treatment Market Volume Share (%), by Treatment Type 2024 & 2032
- Figure 79: South America Pigmentation Disorders Treatment Market Revenue (Million), by Country 2024 & 2032
- Figure 80: South America Pigmentation Disorders Treatment Market Volume (K Unit), by Country 2024 & 2032
- Figure 81: South America Pigmentation Disorders Treatment Market Revenue Share (%), by Country 2024 & 2032
- Figure 82: South America Pigmentation Disorders Treatment Market Volume Share (%), by Country 2024 & 2032
List of Tables
- Table 1: Global Pigmentation Disorders Treatment Market Revenue Million Forecast, by Region 2019 & 2032
- Table 2: Global Pigmentation Disorders Treatment Market Volume K Unit Forecast, by Region 2019 & 2032
- Table 3: Global Pigmentation Disorders Treatment Market Revenue Million Forecast, by Type of Disorder 2019 & 2032
- Table 4: Global Pigmentation Disorders Treatment Market Volume K Unit Forecast, by Type of Disorder 2019 & 2032
- Table 5: Global Pigmentation Disorders Treatment Market Revenue Million Forecast, by Treatment Type 2019 & 2032
- Table 6: Global Pigmentation Disorders Treatment Market Volume K Unit Forecast, by Treatment Type 2019 & 2032
- Table 7: Global Pigmentation Disorders Treatment Market Revenue Million Forecast, by Region 2019 & 2032
- Table 8: Global Pigmentation Disorders Treatment Market Volume K Unit Forecast, by Region 2019 & 2032
- Table 9: Global Pigmentation Disorders Treatment Market Revenue Million Forecast, by Country 2019 & 2032
- Table 10: Global Pigmentation Disorders Treatment Market Volume K Unit Forecast, by Country 2019 & 2032
- Table 11: United States Pigmentation Disorders Treatment Market Revenue (Million) Forecast, by Application 2019 & 2032
- Table 12: United States Pigmentation Disorders Treatment Market Volume (K Unit) Forecast, by Application 2019 & 2032
- Table 13: Canada Pigmentation Disorders Treatment Market Revenue (Million) Forecast, by Application 2019 & 2032
- Table 14: Canada Pigmentation Disorders Treatment Market Volume (K Unit) Forecast, by Application 2019 & 2032
- Table 15: Mexico Pigmentation Disorders Treatment Market Revenue (Million) Forecast, by Application 2019 & 2032
- Table 16: Mexico Pigmentation Disorders Treatment Market Volume (K Unit) Forecast, by Application 2019 & 2032
- Table 17: Global Pigmentation Disorders Treatment Market Revenue Million Forecast, by Country 2019 & 2032
- Table 18: Global Pigmentation Disorders Treatment Market Volume K Unit Forecast, by Country 2019 & 2032
- Table 19: Germany Pigmentation Disorders Treatment Market Revenue (Million) Forecast, by Application 2019 & 2032
- Table 20: Germany Pigmentation Disorders Treatment Market Volume (K Unit) Forecast, by Application 2019 & 2032
- Table 21: United Kingdom Pigmentation Disorders Treatment Market Revenue (Million) Forecast, by Application 2019 & 2032
- Table 22: United Kingdom Pigmentation Disorders Treatment Market Volume (K Unit) Forecast, by Application 2019 & 2032
- Table 23: France Pigmentation Disorders Treatment Market Revenue (Million) Forecast, by Application 2019 & 2032
- Table 24: France Pigmentation Disorders Treatment Market Volume (K Unit) Forecast, by Application 2019 & 2032
- Table 25: Italy Pigmentation Disorders Treatment Market Revenue (Million) Forecast, by Application 2019 & 2032
- Table 26: Italy Pigmentation Disorders Treatment Market Volume (K Unit) Forecast, by Application 2019 & 2032
- Table 27: Spain Pigmentation Disorders Treatment Market Revenue (Million) Forecast, by Application 2019 & 2032
- Table 28: Spain Pigmentation Disorders Treatment Market Volume (K Unit) Forecast, by Application 2019 & 2032
- Table 29: Rest of Europe Pigmentation Disorders Treatment Market Revenue (Million) Forecast, by Application 2019 & 2032
- Table 30: Rest of Europe Pigmentation Disorders Treatment Market Volume (K Unit) Forecast, by Application 2019 & 2032
- Table 31: Global Pigmentation Disorders Treatment Market Revenue Million Forecast, by Country 2019 & 2032
- Table 32: Global Pigmentation Disorders Treatment Market Volume K Unit Forecast, by Country 2019 & 2032
- Table 33: China Pigmentation Disorders Treatment Market Revenue (Million) Forecast, by Application 2019 & 2032
- Table 34: China Pigmentation Disorders Treatment Market Volume (K Unit) Forecast, by Application 2019 & 2032
- Table 35: Japan Pigmentation Disorders Treatment Market Revenue (Million) Forecast, by Application 2019 & 2032
- Table 36: Japan Pigmentation Disorders Treatment Market Volume (K Unit) Forecast, by Application 2019 & 2032
- Table 37: India Pigmentation Disorders Treatment Market Revenue (Million) Forecast, by Application 2019 & 2032
- Table 38: India Pigmentation Disorders Treatment Market Volume (K Unit) Forecast, by Application 2019 & 2032
- Table 39: Australia Pigmentation Disorders Treatment Market Revenue (Million) Forecast, by Application 2019 & 2032
- Table 40: Australia Pigmentation Disorders Treatment Market Volume (K Unit) Forecast, by Application 2019 & 2032
- Table 41: South Korea Pigmentation Disorders Treatment Market Revenue (Million) Forecast, by Application 2019 & 2032
- Table 42: South Korea Pigmentation Disorders Treatment Market Volume (K Unit) Forecast, by Application 2019 & 2032
- Table 43: Rest of Asia Pacific Pigmentation Disorders Treatment Market Revenue (Million) Forecast, by Application 2019 & 2032
- Table 44: Rest of Asia Pacific Pigmentation Disorders Treatment Market Volume (K Unit) Forecast, by Application 2019 & 2032
- Table 45: Global Pigmentation Disorders Treatment Market Revenue Million Forecast, by Country 2019 & 2032
- Table 46: Global Pigmentation Disorders Treatment Market Volume K Unit Forecast, by Country 2019 & 2032
- Table 47: GCC Pigmentation Disorders Treatment Market Revenue (Million) Forecast, by Application 2019 & 2032
- Table 48: GCC Pigmentation Disorders Treatment Market Volume (K Unit) Forecast, by Application 2019 & 2032
- Table 49: South Africa Pigmentation Disorders Treatment Market Revenue (Million) Forecast, by Application 2019 & 2032
- Table 50: South Africa Pigmentation Disorders Treatment Market Volume (K Unit) Forecast, by Application 2019 & 2032
- Table 51: Rest of Middle East and Africa Pigmentation Disorders Treatment Market Revenue (Million) Forecast, by Application 2019 & 2032
- Table 52: Rest of Middle East and Africa Pigmentation Disorders Treatment Market Volume (K Unit) Forecast, by Application 2019 & 2032
- Table 53: Global Pigmentation Disorders Treatment Market Revenue Million Forecast, by Country 2019 & 2032
- Table 54: Global Pigmentation Disorders Treatment Market Volume K Unit Forecast, by Country 2019 & 2032
- Table 55: Brazil Pigmentation Disorders Treatment Market Revenue (Million) Forecast, by Application 2019 & 2032
- Table 56: Brazil Pigmentation Disorders Treatment Market Volume (K Unit) Forecast, by Application 2019 & 2032
- Table 57: Argentina Pigmentation Disorders Treatment Market Revenue (Million) Forecast, by Application 2019 & 2032
- Table 58: Argentina Pigmentation Disorders Treatment Market Volume (K Unit) Forecast, by Application 2019 & 2032
- Table 59: Rest of South America Pigmentation Disorders Treatment Market Revenue (Million) Forecast, by Application 2019 & 2032
- Table 60: Rest of South America Pigmentation Disorders Treatment Market Volume (K Unit) Forecast, by Application 2019 & 2032
- Table 61: Global Pigmentation Disorders Treatment Market Revenue Million Forecast, by Type of Disorder 2019 & 2032
- Table 62: Global Pigmentation Disorders Treatment Market Volume K Unit Forecast, by Type of Disorder 2019 & 2032
- Table 63: Global Pigmentation Disorders Treatment Market Revenue Million Forecast, by Treatment Type 2019 & 2032
- Table 64: Global Pigmentation Disorders Treatment Market Volume K Unit Forecast, by Treatment Type 2019 & 2032
- Table 65: Global Pigmentation Disorders Treatment Market Revenue Million Forecast, by Country 2019 & 2032
- Table 66: Global Pigmentation Disorders Treatment Market Volume K Unit Forecast, by Country 2019 & 2032
- Table 67: United States Pigmentation Disorders Treatment Market Revenue (Million) Forecast, by Application 2019 & 2032
- Table 68: United States Pigmentation Disorders Treatment Market Volume (K Unit) Forecast, by Application 2019 & 2032
- Table 69: Canada Pigmentation Disorders Treatment Market Revenue (Million) Forecast, by Application 2019 & 2032
- Table 70: Canada Pigmentation Disorders Treatment Market Volume (K Unit) Forecast, by Application 2019 & 2032
- Table 71: Mexico Pigmentation Disorders Treatment Market Revenue (Million) Forecast, by Application 2019 & 2032
- Table 72: Mexico Pigmentation Disorders Treatment Market Volume (K Unit) Forecast, by Application 2019 & 2032
- Table 73: Global Pigmentation Disorders Treatment Market Revenue Million Forecast, by Type of Disorder 2019 & 2032
- Table 74: Global Pigmentation Disorders Treatment Market Volume K Unit Forecast, by Type of Disorder 2019 & 2032
- Table 75: Global Pigmentation Disorders Treatment Market Revenue Million Forecast, by Treatment Type 2019 & 2032
- Table 76: Global Pigmentation Disorders Treatment Market Volume K Unit Forecast, by Treatment Type 2019 & 2032
- Table 77: Global Pigmentation Disorders Treatment Market Revenue Million Forecast, by Country 2019 & 2032
- Table 78: Global Pigmentation Disorders Treatment Market Volume K Unit Forecast, by Country 2019 & 2032
- Table 79: Germany Pigmentation Disorders Treatment Market Revenue (Million) Forecast, by Application 2019 & 2032
- Table 80: Germany Pigmentation Disorders Treatment Market Volume (K Unit) Forecast, by Application 2019 & 2032
- Table 81: United Kingdom Pigmentation Disorders Treatment Market Revenue (Million) Forecast, by Application 2019 & 2032
- Table 82: United Kingdom Pigmentation Disorders Treatment Market Volume (K Unit) Forecast, by Application 2019 & 2032
- Table 83: France Pigmentation Disorders Treatment Market Revenue (Million) Forecast, by Application 2019 & 2032
- Table 84: France Pigmentation Disorders Treatment Market Volume (K Unit) Forecast, by Application 2019 & 2032
- Table 85: Italy Pigmentation Disorders Treatment Market Revenue (Million) Forecast, by Application 2019 & 2032
- Table 86: Italy Pigmentation Disorders Treatment Market Volume (K Unit) Forecast, by Application 2019 & 2032
- Table 87: Spain Pigmentation Disorders Treatment Market Revenue (Million) Forecast, by Application 2019 & 2032
- Table 88: Spain Pigmentation Disorders Treatment Market Volume (K Unit) Forecast, by Application 2019 & 2032
- Table 89: Rest of Europe Pigmentation Disorders Treatment Market Revenue (Million) Forecast, by Application 2019 & 2032
- Table 90: Rest of Europe Pigmentation Disorders Treatment Market Volume (K Unit) Forecast, by Application 2019 & 2032
- Table 91: Global Pigmentation Disorders Treatment Market Revenue Million Forecast, by Type of Disorder 2019 & 2032
- Table 92: Global Pigmentation Disorders Treatment Market Volume K Unit Forecast, by Type of Disorder 2019 & 2032
- Table 93: Global Pigmentation Disorders Treatment Market Revenue Million Forecast, by Treatment Type 2019 & 2032
- Table 94: Global Pigmentation Disorders Treatment Market Volume K Unit Forecast, by Treatment Type 2019 & 2032
- Table 95: Global Pigmentation Disorders Treatment Market Revenue Million Forecast, by Country 2019 & 2032
- Table 96: Global Pigmentation Disorders Treatment Market Volume K Unit Forecast, by Country 2019 & 2032
- Table 97: China Pigmentation Disorders Treatment Market Revenue (Million) Forecast, by Application 2019 & 2032
- Table 98: China Pigmentation Disorders Treatment Market Volume (K Unit) Forecast, by Application 2019 & 2032
- Table 99: Japan Pigmentation Disorders Treatment Market Revenue (Million) Forecast, by Application 2019 & 2032
- Table 100: Japan Pigmentation Disorders Treatment Market Volume (K Unit) Forecast, by Application 2019 & 2032
- Table 101: India Pigmentation Disorders Treatment Market Revenue (Million) Forecast, by Application 2019 & 2032
- Table 102: India Pigmentation Disorders Treatment Market Volume (K Unit) Forecast, by Application 2019 & 2032
- Table 103: Australia Pigmentation Disorders Treatment Market Revenue (Million) Forecast, by Application 2019 & 2032
- Table 104: Australia Pigmentation Disorders Treatment Market Volume (K Unit) Forecast, by Application 2019 & 2032
- Table 105: South Korea Pigmentation Disorders Treatment Market Revenue (Million) Forecast, by Application 2019 & 2032
- Table 106: South Korea Pigmentation Disorders Treatment Market Volume (K Unit) Forecast, by Application 2019 & 2032
- Table 107: Rest of Asia Pacific Pigmentation Disorders Treatment Market Revenue (Million) Forecast, by Application 2019 & 2032
- Table 108: Rest of Asia Pacific Pigmentation Disorders Treatment Market Volume (K Unit) Forecast, by Application 2019 & 2032
- Table 109: Global Pigmentation Disorders Treatment Market Revenue Million Forecast, by Type of Disorder 2019 & 2032
- Table 110: Global Pigmentation Disorders Treatment Market Volume K Unit Forecast, by Type of Disorder 2019 & 2032
- Table 111: Global Pigmentation Disorders Treatment Market Revenue Million Forecast, by Treatment Type 2019 & 2032
- Table 112: Global Pigmentation Disorders Treatment Market Volume K Unit Forecast, by Treatment Type 2019 & 2032
- Table 113: Global Pigmentation Disorders Treatment Market Revenue Million Forecast, by Country 2019 & 2032
- Table 114: Global Pigmentation Disorders Treatment Market Volume K Unit Forecast, by Country 2019 & 2032
- Table 115: GCC Pigmentation Disorders Treatment Market Revenue (Million) Forecast, by Application 2019 & 2032
- Table 116: GCC Pigmentation Disorders Treatment Market Volume (K Unit) Forecast, by Application 2019 & 2032
- Table 117: South Africa Pigmentation Disorders Treatment Market Revenue (Million) Forecast, by Application 2019 & 2032
- Table 118: South Africa Pigmentation Disorders Treatment Market Volume (K Unit) Forecast, by Application 2019 & 2032
- Table 119: Rest of Middle East and Africa Pigmentation Disorders Treatment Market Revenue (Million) Forecast, by Application 2019 & 2032
- Table 120: Rest of Middle East and Africa Pigmentation Disorders Treatment Market Volume (K Unit) Forecast, by Application 2019 & 2032
- Table 121: Global Pigmentation Disorders Treatment Market Revenue Million Forecast, by Type of Disorder 2019 & 2032
- Table 122: Global Pigmentation Disorders Treatment Market Volume K Unit Forecast, by Type of Disorder 2019 & 2032
- Table 123: Global Pigmentation Disorders Treatment Market Revenue Million Forecast, by Treatment Type 2019 & 2032
- Table 124: Global Pigmentation Disorders Treatment Market Volume K Unit Forecast, by Treatment Type 2019 & 2032
- Table 125: Global Pigmentation Disorders Treatment Market Revenue Million Forecast, by Country 2019 & 2032
- Table 126: Global Pigmentation Disorders Treatment Market Volume K Unit Forecast, by Country 2019 & 2032
- Table 127: Brazil Pigmentation Disorders Treatment Market Revenue (Million) Forecast, by Application 2019 & 2032
- Table 128: Brazil Pigmentation Disorders Treatment Market Volume (K Unit) Forecast, by Application 2019 & 2032
- Table 129: Argentina Pigmentation Disorders Treatment Market Revenue (Million) Forecast, by Application 2019 & 2032
- Table 130: Argentina Pigmentation Disorders Treatment Market Volume (K Unit) Forecast, by Application 2019 & 2032
- Table 131: Rest of South America Pigmentation Disorders Treatment Market Revenue (Million) Forecast, by Application 2019 & 2032
- Table 132: Rest of South America Pigmentation Disorders Treatment Market Volume (K Unit) Forecast, by Application 2019 & 2032
Frequently Asked Questions
1. What is the projected Compound Annual Growth Rate (CAGR) of the Pigmentation Disorders Treatment Market?
The projected CAGR is approximately 5.43%.
2. Which companies are prominent players in the Pigmentation Disorders Treatment Market?
Key companies in the market include Pfizer Inc, Pierre Fabre Group (Pierre Fabre Laboratories), DermaMed Solutions LLC, Epionce, SkinCeuticals, Obagi Cosmeceuticals LLC, Candela Corporation, Merz GmbH & Co KGaA, Galderma SA, L'Oreal SA, Vital Esthetique, AbbVie Inc (Allergan Inc ).
3. What are the main segments of the Pigmentation Disorders Treatment Market?
The market segments include Type of Disorder, Treatment Type.
4. Can you provide details about the market size?
The market size is estimated to be USD 7.40 Million as of 2022.
5. What are some drivers contributing to market growth?
Increasing Prevalence of Pigmentation Disorders; Growing Expenditure on Dermatalogical Treatments.
6. What are the notable trends driving market growth?
Topical Treatment Segment Expected to Hold Significant Market Share.
7. Are there any restraints impacting market growth?
High Cost of Cosmetic Procedures; Inadequate Reimbursement Policies.
8. Can you provide examples of recent developments in the market?
July 2022: Incyte Corporation received approval from the United States Food and Drug Administration for Opzelura (ruxolitinib) cream for treating non-segmental vitiligo in adult and pediatric patients 12 years of age and older.
9. What pricing options are available for accessing the report?
Pricing options include single-user, multi-user, and enterprise licenses priced at USD 4750, USD 5250, and USD 8750 respectively.
10. Is the market size provided in terms of value or volume?
The market size is provided in terms of value, measured in Million and volume, measured in K Unit.
11. Are there any specific market keywords associated with the report?
Yes, the market keyword associated with the report is "Pigmentation Disorders Treatment Market," which aids in identifying and referencing the specific market segment covered.
12. How do I determine which pricing option suits my needs best?
The pricing options vary based on user requirements and access needs. Individual users may opt for single-user licenses, while businesses requiring broader access may choose multi-user or enterprise licenses for cost-effective access to the report.
13. Are there any additional resources or data provided in the Pigmentation Disorders Treatment Market report?
While the report offers comprehensive insights, it's advisable to review the specific contents or supplementary materials provided to ascertain if additional resources or data are available.
14. How can I stay updated on further developments or reports in the Pigmentation Disorders Treatment Market?
To stay informed about further developments, trends, and reports in the Pigmentation Disorders Treatment Market, consider subscribing to industry newsletters, following relevant companies and organizations, or regularly checking reputable industry news sources and publications.
Methodology
Step 1 - Identification of Relevant Samples Size from Population Database


Step 2 - Approaches for Defining Global Market Size (Value, Volume* & Price*)

Note*: In applicable scenarios
Step 3 - Data Sources
Primary Research
- Web Analytics
- Survey Reports
- Research Institute
- Latest Research Reports
- Opinion Leaders
Secondary Research
- Annual Reports
- White Paper
- Latest Press Release
- Industry Association
- Paid Database
- Investor Presentations

Step 4 - Data Triangulation
Involves using different sources of information in order to increase the validity of a study
These sources are likely to be stakeholders in a program - participants, other researchers, program staff, other community members, and so on.
Then we put all data in single framework & apply various statistical tools to find out the dynamic on the market.
During the analysis stage, feedback from the stakeholder groups would be compared to determine areas of agreement as well as areas of divergence


