
Key Insights
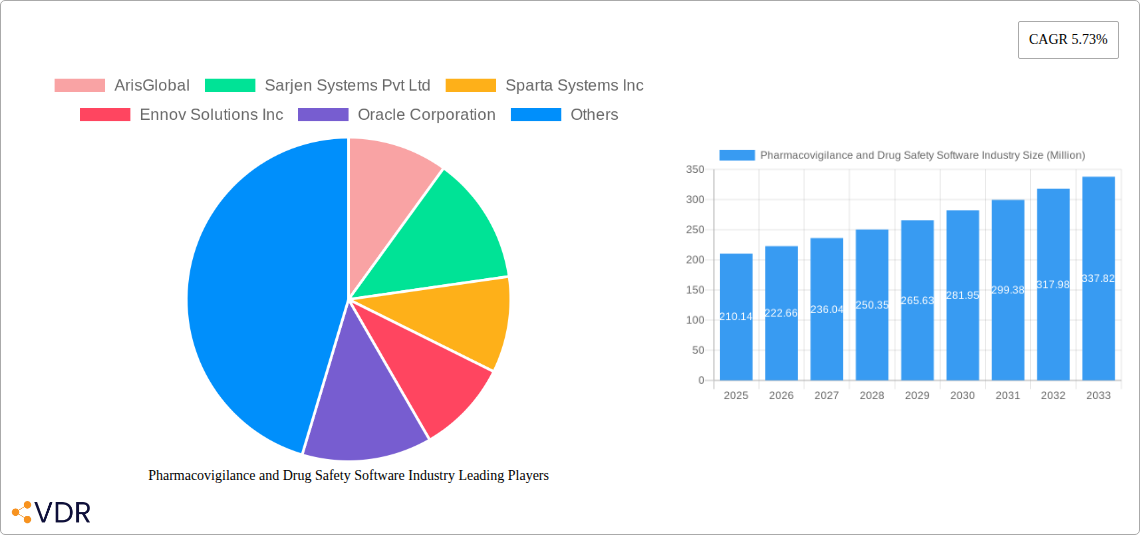
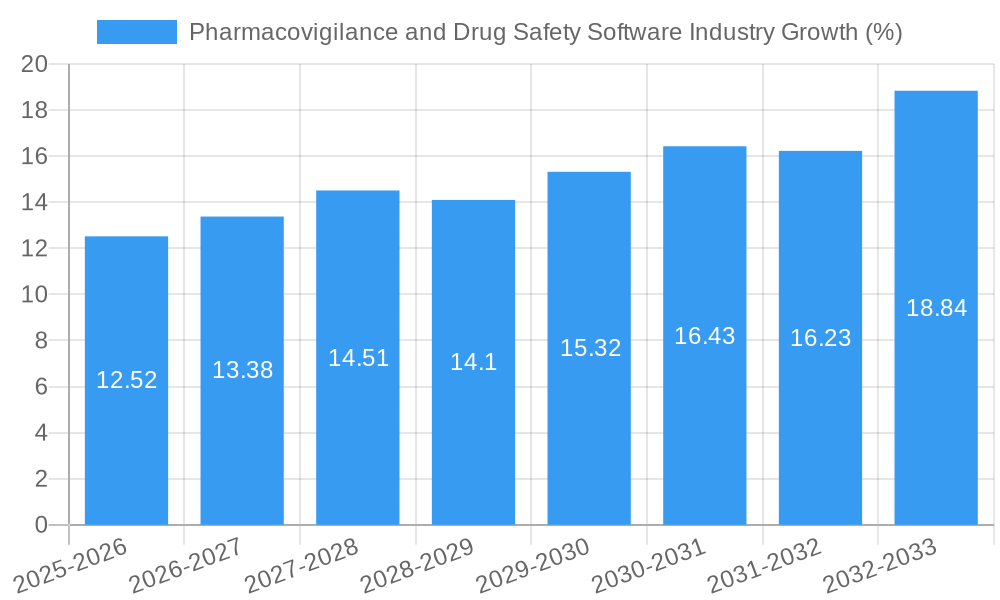
The global pharmacovigilance and drug safety software market is experiencing robust growth, projected to reach $210.14 million in 2025 and maintain a Compound Annual Growth Rate (CAGR) of 5.73% from 2025 to 2033. This expansion is fueled by several key drivers. Increasing regulatory scrutiny necessitates robust drug safety monitoring systems, driving adoption of sophisticated software solutions. Furthermore, the rising volume of clinical trial data and post-market surveillance information necessitates advanced analytical capabilities offered by these software platforms. The shift towards cloud-based (SaaS) delivery models enhances accessibility and scalability, furthering market growth. Pharmaceutical and biotechnology companies, along with contract research organizations (CROs), are major end-users, significantly contributing to market demand. The market is segmented by functionality (Adverse Event Reporting, Drug Safety Audits, Issue Tracking, and Fully Integrated Software) and delivery mode (on-premise and cloud-based). Geographic expansion, particularly in rapidly developing economies like those in Asia-Pacific, presents significant opportunities for market players. However, high implementation costs and the need for specialized expertise can pose challenges to wider adoption.
The competitive landscape includes established players like ArisGlobal, Veeva Systems, and Oracle Corporation, alongside emerging innovative companies. These companies are focusing on developing advanced functionalities, such as AI-powered analytics and predictive modeling to enhance drug safety monitoring. The integration of these software solutions with existing electronic health record (EHR) systems and other healthcare IT infrastructure is also a crucial aspect driving market development. Future growth hinges on continuous innovation in AI, machine learning, and data analytics to better identify and manage safety signals, improve regulatory compliance, and ultimately enhance patient safety. The market will likely see consolidation amongst players as strategic mergers and acquisitions become more prevalent.
Pharmacovigilance and Drug Safety Software Market Report: 2019-2033
This comprehensive report provides an in-depth analysis of the Pharmacovigilance and Drug Safety Software market, encompassing market dynamics, growth trends, regional dominance, product landscapes, and key players. The study period covers 2019-2033, with a base year of 2025 and a forecast period of 2025-2033. The report segments the market by functionality (Adverse Event Reporting Software, Drug Safety Audits Software, Issue Tracking Software, Fully Integrated Software), mode of delivery (On-premise, On-demand/Cloud-based (SaaS)), and end-users (Pharmaceutical & Biotechnology Companies, Contract Research Organizations (CROs), Business Process Outsourcing (BPO) firms, Other Pharmacovigilance Service Providers). Key players analyzed include ArisGlobal, Sarjen Systems Pvt Ltd, Sparta Systems Inc, Ennov Solutions Inc, Oracle Corporation, Anju Software Inc, Veeva Systems, Ab Cube, United BioSource Corporation, and Extedo GmbH. The total market size is predicted to reach xx Million by 2033.
Pharmacovigilance and Drug Safety Software Industry Market Dynamics & Structure
The Pharmacovigilance and Drug Safety Software market is characterized by a moderately concentrated landscape with a few dominant players and several niche players. Technological innovation, driven by AI and machine learning, is a key growth driver, while stringent regulatory frameworks (e.g., FDA regulations) influence product development and adoption. The market exhibits a shift towards cloud-based solutions due to scalability and cost-effectiveness. Mergers and acquisitions are frequent, with larger players acquiring smaller companies to expand their product portfolios and market share.
- Market Concentration: The top 5 players hold an estimated xx% market share in 2025.
- Technological Innovation: AI and machine learning are enabling faster and more accurate adverse event detection and risk assessment.
- Regulatory Framework: Compliance with global regulatory requirements (e.g., GDPR, 21 CFR Part 11) is crucial for market participation.
- Competitive Substitutes: Limited direct substitutes exist, but manual processes remain a competitive challenge.
- M&A Activity: An average of xx M&A deals were recorded annually during the historical period (2019-2024).
- Innovation Barriers: High development costs and stringent regulatory approvals are major barriers.
Pharmacovigilance and Drug Safety Software Industry Growth Trends & Insights
The Pharmacovigilance and Drug Safety Software market experienced significant growth during the historical period (2019-2024), fueled by increasing drug development activities, growing regulatory scrutiny, and the rising adoption of cloud-based solutions. The market size is projected to grow at a Compound Annual Growth Rate (CAGR) of xx% from 2025 to 2033. This growth is driven by factors such as rising demand for efficient and scalable pharmacovigilance solutions, increasing investments in R&D by pharmaceutical and biotechnology companies, and the growing adoption of cloud-based solutions. Technological disruptions such as AI-powered adverse event detection and predictive analytics are further accelerating market expansion. The market penetration rate is expected to reach xx% by 2033. Consumer behavior is shifting towards integrated solutions providing comprehensive pharmacovigilance capabilities.
Dominant Regions, Countries, or Segments in Pharmacovigilance and Drug Safety Software Industry
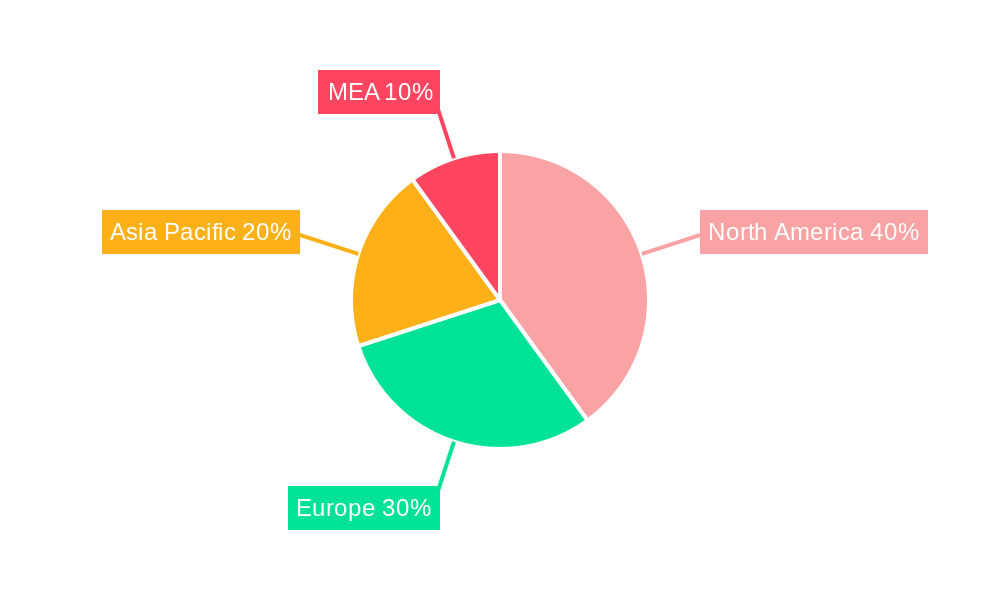
North America currently dominates the market, driven by stringent regulatory environments, high R&D spending, and a large number of pharmaceutical and biotechnology companies. Europe follows as a significant market, while Asia-Pacific is expected to show robust growth due to increasing drug development activities and government initiatives. Within segments, the Cloud-based (SaaS) delivery model shows the highest growth potential, followed by Adverse Event Reporting Software, and Pharmaceutical and Biotechnology companies represent the largest end-user segment.
- Key Drivers:
- Stringent regulatory requirements in North America and Europe.
- High R&D spending in the pharmaceutical and biotechnology industries.
- Increasing adoption of cloud-based solutions due to scalability and cost-effectiveness.
- Government initiatives to improve drug safety and efficacy in emerging markets.
- Dominance Factors: North America's strong regulatory framework and large pharmaceutical industry contribute to its market leadership. The cloud-based delivery model offers significant cost and scalability advantages.
Pharmacovigilance and Drug Safety Software Industry Product Landscape
The market offers a diverse range of products, from standalone adverse event reporting software to fully integrated platforms incorporating safety audits and issue tracking. Key innovations include AI-powered risk prediction, advanced data analytics, and enhanced reporting capabilities. Unique selling propositions include ease of use, seamless integration with existing systems, and robust regulatory compliance features. Technological advancements focus on improving data management, enhancing collaboration, and streamlining workflows to improve efficiency and reduce operational costs.
Key Drivers, Barriers & Challenges in Pharmacovigilance and Drug Safety Software Industry
Key Drivers: Increasing regulatory scrutiny, the growing complexity of drug development, and the need for efficient pharmacovigilance processes are driving market growth. Technological advancements like AI and machine learning are enabling more sophisticated solutions. The rising adoption of cloud-based software offers scalability and cost-effectiveness, further fueling the market's expansion.
Key Challenges and Restraints: High implementation costs, integration complexities, and the need for extensive training can hinder adoption. Data privacy and security concerns are critical challenges, particularly for cloud-based solutions. Intense competition among established players and emerging startups creates pressure on pricing and margins. The estimated impact of these challenges on market growth is a reduction in CAGR by approximately xx% in the next 5 years.
Emerging Opportunities in Pharmacovigilance and Drug Safety Software Industry
Untapped markets in emerging economies present significant growth opportunities. The integration of AI and machine learning into pharmacovigilance platforms creates scope for innovative applications in real-time risk assessment and predictive analytics. The growing demand for specialized solutions for specific therapeutic areas (e.g., oncology, rare diseases) presents further opportunities.
Growth Accelerators in the Pharmacovigilance and Drug Safety Software Industry Industry
Strategic partnerships between software providers and pharmaceutical companies will drive market growth. Technological breakthroughs in AI and machine learning will enable faster and more accurate risk assessment. Expansion into new geographical markets, particularly emerging economies, will provide new revenue streams.
Key Players Shaping the Pharmacovigilance and Drug Safety Software Market
- ArisGlobal
- Sarjen Systems Pvt Ltd
- Sparta Systems Inc
- Ennov Solutions Inc
- Oracle Corporation
- Anju Software Inc
- Veeva Systems
- Ab Cube
- United BioSource Corporation
- Extedo GmbH
Notable Milestones in Pharmacovigilance and Drug Safety Software Industry Sector
- October 2022: PegBio selects ArisGlobal's LifeSphere MultiVigilance, signifying a shift towards in-house pharmacovigilance solutions.
- July 2022: Dotmatics launches its Small Molecule Drug Discovery Solution, enhancing data management capabilities within the drug development process. This indirectly impacts pharmacovigilance by improving data quality upstream.
In-Depth Pharmacovigilance and Drug Safety Software Industry Market Outlook
The Pharmacovigilance and Drug Safety Software market is poised for continued growth, driven by technological advancements and increasing regulatory pressure. Strategic partnerships, expansion into emerging markets, and the development of innovative solutions leveraging AI and machine learning will shape the market's future. The market's potential is vast, particularly with the integration of data analytics, which promises to optimize safety processes and proactively address potential risks. This will lead to substantial cost savings and improved patient outcomes.
Pharmacovigilance and Drug Safety Software Industry Segmentation
-
1. Functionality
- 1.1. Adverse Event Reporting Software
- 1.2. Drug Safety Audits Software
- 1.3. Issue Tracking Software
- 1.4. Fully Integrated Software
-
2. Mode of Delivery
- 2.1. On-premise Delivery
- 2.2. On-demand/ Cloud-based (SaaS) Delivery
-
3. End Users
- 3.1. Pharmaceutical and Biotechnology Companies
- 3.2. Contract Research Organizations
- 3.3. Business Process Outsourcing Firms
- 3.4. Other Pharmacovigilance Service Providers
Pharmacovigilance and Drug Safety Software Industry Segmentation By Geography
-
1. North America
- 1.1. United States
- 1.2. Canada
- 1.3. Mexico
-
2. Europe
- 2.1. Germany
- 2.2. United Kingdom
- 2.3. France
- 2.4. Italy
- 2.5. Spain
- 2.6. Rest of Europe
-
3. Asia Pacific
- 3.1. China
- 3.2. Japan
- 3.3. India
- 3.4. Australia
- 3.5. South Korea
- 3.6. Rest of Asia Pacific
-
4. Middle East and Africa
- 4.1. GCC
- 4.2. South Africa
- 4.3. Rest of Middle East and Africa
-
5. South America
- 5.1. Brazil
- 5.2. Argentina
- 5.3. Rest of South America
Pharmacovigilance and Drug Safety Software Industry REPORT HIGHLIGHTS
| Aspects | Details |
|---|---|
| Study Period | 2019-2033 |
| Base Year | 2024 |
| Estimated Year | 2025 |
| Forecast Period | 2025-2033 |
| Historical Period | 2019-2024 |
| Growth Rate | CAGR of 5.73% from 2019-2033 |
| Segmentation |
|
Table of Contents
- 1. Introduction
- 1.1. Research Scope
- 1.2. Market Segmentation
- 1.3. Research Methodology
- 1.4. Definitions and Assumptions
- 2. Executive Summary
- 2.1. Introduction
- 3. Market Dynamics
- 3.1. Introduction
- 3.2. Market Drivers
- 3.2.1. Increasing Incidence of Adverse Drug Reactions (ADRs); Increasing Adoption of Pharmacovigilance Software by Outsourcing Companies
- 3.3. Market Restrains
- 3.3.1. Lack of Awareness about Pharmacovigilance
- 3.4. Market Trends
- 3.4.1. Fully Integrated Software Expected to Witness Significant Growth Over the Forecast Period
- 4. Market Factor Analysis
- 4.1. Porters Five Forces
- 4.2. Supply/Value Chain
- 4.3. PESTEL analysis
- 4.4. Market Entropy
- 4.5. Patent/Trademark Analysis
- 5. Global Pharmacovigilance and Drug Safety Software Industry Analysis, Insights and Forecast, 2019-2031
- 5.1. Market Analysis, Insights and Forecast - by Functionality
- 5.1.1. Adverse Event Reporting Software
- 5.1.2. Drug Safety Audits Software
- 5.1.3. Issue Tracking Software
- 5.1.4. Fully Integrated Software
- 5.2. Market Analysis, Insights and Forecast - by Mode of Delivery
- 5.2.1. On-premise Delivery
- 5.2.2. On-demand/ Cloud-based (SaaS) Delivery
- 5.3. Market Analysis, Insights and Forecast - by End Users
- 5.3.1. Pharmaceutical and Biotechnology Companies
- 5.3.2. Contract Research Organizations
- 5.3.3. Business Process Outsourcing Firms
- 5.3.4. Other Pharmacovigilance Service Providers
- 5.4. Market Analysis, Insights and Forecast - by Region
- 5.4.1. North America
- 5.4.2. Europe
- 5.4.3. Asia Pacific
- 5.4.4. Middle East and Africa
- 5.4.5. South America
- 5.1. Market Analysis, Insights and Forecast - by Functionality
- 6. North America Pharmacovigilance and Drug Safety Software Industry Analysis, Insights and Forecast, 2019-2031
- 6.1. Market Analysis, Insights and Forecast - by Functionality
- 6.1.1. Adverse Event Reporting Software
- 6.1.2. Drug Safety Audits Software
- 6.1.3. Issue Tracking Software
- 6.1.4. Fully Integrated Software
- 6.2. Market Analysis, Insights and Forecast - by Mode of Delivery
- 6.2.1. On-premise Delivery
- 6.2.2. On-demand/ Cloud-based (SaaS) Delivery
- 6.3. Market Analysis, Insights and Forecast - by End Users
- 6.3.1. Pharmaceutical and Biotechnology Companies
- 6.3.2. Contract Research Organizations
- 6.3.3. Business Process Outsourcing Firms
- 6.3.4. Other Pharmacovigilance Service Providers
- 6.1. Market Analysis, Insights and Forecast - by Functionality
- 7. Europe Pharmacovigilance and Drug Safety Software Industry Analysis, Insights and Forecast, 2019-2031
- 7.1. Market Analysis, Insights and Forecast - by Functionality
- 7.1.1. Adverse Event Reporting Software
- 7.1.2. Drug Safety Audits Software
- 7.1.3. Issue Tracking Software
- 7.1.4. Fully Integrated Software
- 7.2. Market Analysis, Insights and Forecast - by Mode of Delivery
- 7.2.1. On-premise Delivery
- 7.2.2. On-demand/ Cloud-based (SaaS) Delivery
- 7.3. Market Analysis, Insights and Forecast - by End Users
- 7.3.1. Pharmaceutical and Biotechnology Companies
- 7.3.2. Contract Research Organizations
- 7.3.3. Business Process Outsourcing Firms
- 7.3.4. Other Pharmacovigilance Service Providers
- 7.1. Market Analysis, Insights and Forecast - by Functionality
- 8. Asia Pacific Pharmacovigilance and Drug Safety Software Industry Analysis, Insights and Forecast, 2019-2031
- 8.1. Market Analysis, Insights and Forecast - by Functionality
- 8.1.1. Adverse Event Reporting Software
- 8.1.2. Drug Safety Audits Software
- 8.1.3. Issue Tracking Software
- 8.1.4. Fully Integrated Software
- 8.2. Market Analysis, Insights and Forecast - by Mode of Delivery
- 8.2.1. On-premise Delivery
- 8.2.2. On-demand/ Cloud-based (SaaS) Delivery
- 8.3. Market Analysis, Insights and Forecast - by End Users
- 8.3.1. Pharmaceutical and Biotechnology Companies
- 8.3.2. Contract Research Organizations
- 8.3.3. Business Process Outsourcing Firms
- 8.3.4. Other Pharmacovigilance Service Providers
- 8.1. Market Analysis, Insights and Forecast - by Functionality
- 9. Middle East and Africa Pharmacovigilance and Drug Safety Software Industry Analysis, Insights and Forecast, 2019-2031
- 9.1. Market Analysis, Insights and Forecast - by Functionality
- 9.1.1. Adverse Event Reporting Software
- 9.1.2. Drug Safety Audits Software
- 9.1.3. Issue Tracking Software
- 9.1.4. Fully Integrated Software
- 9.2. Market Analysis, Insights and Forecast - by Mode of Delivery
- 9.2.1. On-premise Delivery
- 9.2.2. On-demand/ Cloud-based (SaaS) Delivery
- 9.3. Market Analysis, Insights and Forecast - by End Users
- 9.3.1. Pharmaceutical and Biotechnology Companies
- 9.3.2. Contract Research Organizations
- 9.3.3. Business Process Outsourcing Firms
- 9.3.4. Other Pharmacovigilance Service Providers
- 9.1. Market Analysis, Insights and Forecast - by Functionality
- 10. South America Pharmacovigilance and Drug Safety Software Industry Analysis, Insights and Forecast, 2019-2031
- 10.1. Market Analysis, Insights and Forecast - by Functionality
- 10.1.1. Adverse Event Reporting Software
- 10.1.2. Drug Safety Audits Software
- 10.1.3. Issue Tracking Software
- 10.1.4. Fully Integrated Software
- 10.2. Market Analysis, Insights and Forecast - by Mode of Delivery
- 10.2.1. On-premise Delivery
- 10.2.2. On-demand/ Cloud-based (SaaS) Delivery
- 10.3. Market Analysis, Insights and Forecast - by End Users
- 10.3.1. Pharmaceutical and Biotechnology Companies
- 10.3.2. Contract Research Organizations
- 10.3.3. Business Process Outsourcing Firms
- 10.3.4. Other Pharmacovigilance Service Providers
- 10.1. Market Analysis, Insights and Forecast - by Functionality
- 11. North America Pharmacovigilance and Drug Safety Software Industry Analysis, Insights and Forecast, 2019-2031
- 11.1. Market Analysis, Insights and Forecast - By Country/Sub-region
- 11.1.1 United States
- 11.1.2 Canada
- 11.1.3 Mexico
- 12. South America Pharmacovigilance and Drug Safety Software Industry Analysis, Insights and Forecast, 2019-2031
- 12.1. Market Analysis, Insights and Forecast - By Country/Sub-region
- 12.1.1 Brazil
- 12.1.2 Mexico
- 12.1.3 Rest of South America
- 13. Europe Pharmacovigilance and Drug Safety Software Industry Analysis, Insights and Forecast, 2019-2031
- 13.1. Market Analysis, Insights and Forecast - By Country/Sub-region
- 13.1.1 Germany
- 13.1.2 United Kingdom
- 13.1.3 France
- 13.1.4 Italy
- 13.1.5 Spain
- 13.1.6 Rest of Europe
- 14. Asia Pacific Pharmacovigilance and Drug Safety Software Industry Analysis, Insights and Forecast, 2019-2031
- 14.1. Market Analysis, Insights and Forecast - By Country/Sub-region
- 14.1.1 China
- 14.1.2 Japan
- 14.1.3 India
- 14.1.4 South Korea
- 14.1.5 Taiwan
- 14.1.6 Australia
- 14.1.7 Rest of Asia-Pacific
- 15. MEA Pharmacovigilance and Drug Safety Software Industry Analysis, Insights and Forecast, 2019-2031
- 15.1. Market Analysis, Insights and Forecast - By Country/Sub-region
- 15.1.1 Middle East
- 15.1.2 Africa
- 16. Competitive Analysis
- 16.1. Global Market Share Analysis 2024
- 16.2. Company Profiles
- 16.2.1 ArisGlobal
- 16.2.1.1. Overview
- 16.2.1.2. Products
- 16.2.1.3. SWOT Analysis
- 16.2.1.4. Recent Developments
- 16.2.1.5. Financials (Based on Availability)
- 16.2.2 Sarjen Systems Pvt Ltd
- 16.2.2.1. Overview
- 16.2.2.2. Products
- 16.2.2.3. SWOT Analysis
- 16.2.2.4. Recent Developments
- 16.2.2.5. Financials (Based on Availability)
- 16.2.3 Sparta Systems Inc
- 16.2.3.1. Overview
- 16.2.3.2. Products
- 16.2.3.3. SWOT Analysis
- 16.2.3.4. Recent Developments
- 16.2.3.5. Financials (Based on Availability)
- 16.2.4 Ennov Solutions Inc
- 16.2.4.1. Overview
- 16.2.4.2. Products
- 16.2.4.3. SWOT Analysis
- 16.2.4.4. Recent Developments
- 16.2.4.5. Financials (Based on Availability)
- 16.2.5 Oracle Corporation
- 16.2.5.1. Overview
- 16.2.5.2. Products
- 16.2.5.3. SWOT Analysis
- 16.2.5.4. Recent Developments
- 16.2.5.5. Financials (Based on Availability)
- 16.2.6 Anju Software Inc
- 16.2.6.1. Overview
- 16.2.6.2. Products
- 16.2.6.3. SWOT Analysis
- 16.2.6.4. Recent Developments
- 16.2.6.5. Financials (Based on Availability)
- 16.2.7 Veeva Systems
- 16.2.7.1. Overview
- 16.2.7.2. Products
- 16.2.7.3. SWOT Analysis
- 16.2.7.4. Recent Developments
- 16.2.7.5. Financials (Based on Availability)
- 16.2.8 Ab Cube
- 16.2.8.1. Overview
- 16.2.8.2. Products
- 16.2.8.3. SWOT Analysis
- 16.2.8.4. Recent Developments
- 16.2.8.5. Financials (Based on Availability)
- 16.2.9 United BioSource Corporation
- 16.2.9.1. Overview
- 16.2.9.2. Products
- 16.2.9.3. SWOT Analysis
- 16.2.9.4. Recent Developments
- 16.2.9.5. Financials (Based on Availability)
- 16.2.10 Extedo GmbH
- 16.2.10.1. Overview
- 16.2.10.2. Products
- 16.2.10.3. SWOT Analysis
- 16.2.10.4. Recent Developments
- 16.2.10.5. Financials (Based on Availability)
- 16.2.1 ArisGlobal
List of Figures
- Figure 1: Global Pharmacovigilance and Drug Safety Software Industry Revenue Breakdown (Million, %) by Region 2024 & 2032
- Figure 2: North America Pharmacovigilance and Drug Safety Software Industry Revenue (Million), by Country 2024 & 2032
- Figure 3: North America Pharmacovigilance and Drug Safety Software Industry Revenue Share (%), by Country 2024 & 2032
- Figure 4: South America Pharmacovigilance and Drug Safety Software Industry Revenue (Million), by Country 2024 & 2032
- Figure 5: South America Pharmacovigilance and Drug Safety Software Industry Revenue Share (%), by Country 2024 & 2032
- Figure 6: Europe Pharmacovigilance and Drug Safety Software Industry Revenue (Million), by Country 2024 & 2032
- Figure 7: Europe Pharmacovigilance and Drug Safety Software Industry Revenue Share (%), by Country 2024 & 2032
- Figure 8: Asia Pacific Pharmacovigilance and Drug Safety Software Industry Revenue (Million), by Country 2024 & 2032
- Figure 9: Asia Pacific Pharmacovigilance and Drug Safety Software Industry Revenue Share (%), by Country 2024 & 2032
- Figure 10: MEA Pharmacovigilance and Drug Safety Software Industry Revenue (Million), by Country 2024 & 2032
- Figure 11: MEA Pharmacovigilance and Drug Safety Software Industry Revenue Share (%), by Country 2024 & 2032
- Figure 12: North America Pharmacovigilance and Drug Safety Software Industry Revenue (Million), by Functionality 2024 & 2032
- Figure 13: North America Pharmacovigilance and Drug Safety Software Industry Revenue Share (%), by Functionality 2024 & 2032
- Figure 14: North America Pharmacovigilance and Drug Safety Software Industry Revenue (Million), by Mode of Delivery 2024 & 2032
- Figure 15: North America Pharmacovigilance and Drug Safety Software Industry Revenue Share (%), by Mode of Delivery 2024 & 2032
- Figure 16: North America Pharmacovigilance and Drug Safety Software Industry Revenue (Million), by End Users 2024 & 2032
- Figure 17: North America Pharmacovigilance and Drug Safety Software Industry Revenue Share (%), by End Users 2024 & 2032
- Figure 18: North America Pharmacovigilance and Drug Safety Software Industry Revenue (Million), by Country 2024 & 2032
- Figure 19: North America Pharmacovigilance and Drug Safety Software Industry Revenue Share (%), by Country 2024 & 2032
- Figure 20: Europe Pharmacovigilance and Drug Safety Software Industry Revenue (Million), by Functionality 2024 & 2032
- Figure 21: Europe Pharmacovigilance and Drug Safety Software Industry Revenue Share (%), by Functionality 2024 & 2032
- Figure 22: Europe Pharmacovigilance and Drug Safety Software Industry Revenue (Million), by Mode of Delivery 2024 & 2032
- Figure 23: Europe Pharmacovigilance and Drug Safety Software Industry Revenue Share (%), by Mode of Delivery 2024 & 2032
- Figure 24: Europe Pharmacovigilance and Drug Safety Software Industry Revenue (Million), by End Users 2024 & 2032
- Figure 25: Europe Pharmacovigilance and Drug Safety Software Industry Revenue Share (%), by End Users 2024 & 2032
- Figure 26: Europe Pharmacovigilance and Drug Safety Software Industry Revenue (Million), by Country 2024 & 2032
- Figure 27: Europe Pharmacovigilance and Drug Safety Software Industry Revenue Share (%), by Country 2024 & 2032
- Figure 28: Asia Pacific Pharmacovigilance and Drug Safety Software Industry Revenue (Million), by Functionality 2024 & 2032
- Figure 29: Asia Pacific Pharmacovigilance and Drug Safety Software Industry Revenue Share (%), by Functionality 2024 & 2032
- Figure 30: Asia Pacific Pharmacovigilance and Drug Safety Software Industry Revenue (Million), by Mode of Delivery 2024 & 2032
- Figure 31: Asia Pacific Pharmacovigilance and Drug Safety Software Industry Revenue Share (%), by Mode of Delivery 2024 & 2032
- Figure 32: Asia Pacific Pharmacovigilance and Drug Safety Software Industry Revenue (Million), by End Users 2024 & 2032
- Figure 33: Asia Pacific Pharmacovigilance and Drug Safety Software Industry Revenue Share (%), by End Users 2024 & 2032
- Figure 34: Asia Pacific Pharmacovigilance and Drug Safety Software Industry Revenue (Million), by Country 2024 & 2032
- Figure 35: Asia Pacific Pharmacovigilance and Drug Safety Software Industry Revenue Share (%), by Country 2024 & 2032
- Figure 36: Middle East and Africa Pharmacovigilance and Drug Safety Software Industry Revenue (Million), by Functionality 2024 & 2032
- Figure 37: Middle East and Africa Pharmacovigilance and Drug Safety Software Industry Revenue Share (%), by Functionality 2024 & 2032
- Figure 38: Middle East and Africa Pharmacovigilance and Drug Safety Software Industry Revenue (Million), by Mode of Delivery 2024 & 2032
- Figure 39: Middle East and Africa Pharmacovigilance and Drug Safety Software Industry Revenue Share (%), by Mode of Delivery 2024 & 2032
- Figure 40: Middle East and Africa Pharmacovigilance and Drug Safety Software Industry Revenue (Million), by End Users 2024 & 2032
- Figure 41: Middle East and Africa Pharmacovigilance and Drug Safety Software Industry Revenue Share (%), by End Users 2024 & 2032
- Figure 42: Middle East and Africa Pharmacovigilance and Drug Safety Software Industry Revenue (Million), by Country 2024 & 2032
- Figure 43: Middle East and Africa Pharmacovigilance and Drug Safety Software Industry Revenue Share (%), by Country 2024 & 2032
- Figure 44: South America Pharmacovigilance and Drug Safety Software Industry Revenue (Million), by Functionality 2024 & 2032
- Figure 45: South America Pharmacovigilance and Drug Safety Software Industry Revenue Share (%), by Functionality 2024 & 2032
- Figure 46: South America Pharmacovigilance and Drug Safety Software Industry Revenue (Million), by Mode of Delivery 2024 & 2032
- Figure 47: South America Pharmacovigilance and Drug Safety Software Industry Revenue Share (%), by Mode of Delivery 2024 & 2032
- Figure 48: South America Pharmacovigilance and Drug Safety Software Industry Revenue (Million), by End Users 2024 & 2032
- Figure 49: South America Pharmacovigilance and Drug Safety Software Industry Revenue Share (%), by End Users 2024 & 2032
- Figure 50: South America Pharmacovigilance and Drug Safety Software Industry Revenue (Million), by Country 2024 & 2032
- Figure 51: South America Pharmacovigilance and Drug Safety Software Industry Revenue Share (%), by Country 2024 & 2032
List of Tables
- Table 1: Global Pharmacovigilance and Drug Safety Software Industry Revenue Million Forecast, by Region 2019 & 2032
- Table 2: Global Pharmacovigilance and Drug Safety Software Industry Revenue Million Forecast, by Functionality 2019 & 2032
- Table 3: Global Pharmacovigilance and Drug Safety Software Industry Revenue Million Forecast, by Mode of Delivery 2019 & 2032
- Table 4: Global Pharmacovigilance and Drug Safety Software Industry Revenue Million Forecast, by End Users 2019 & 2032
- Table 5: Global Pharmacovigilance and Drug Safety Software Industry Revenue Million Forecast, by Region 2019 & 2032
- Table 6: Global Pharmacovigilance and Drug Safety Software Industry Revenue Million Forecast, by Country 2019 & 2032
- Table 7: United States Pharmacovigilance and Drug Safety Software Industry Revenue (Million) Forecast, by Application 2019 & 2032
- Table 8: Canada Pharmacovigilance and Drug Safety Software Industry Revenue (Million) Forecast, by Application 2019 & 2032
- Table 9: Mexico Pharmacovigilance and Drug Safety Software Industry Revenue (Million) Forecast, by Application 2019 & 2032
- Table 10: Global Pharmacovigilance and Drug Safety Software Industry Revenue Million Forecast, by Country 2019 & 2032
- Table 11: Brazil Pharmacovigilance and Drug Safety Software Industry Revenue (Million) Forecast, by Application 2019 & 2032
- Table 12: Mexico Pharmacovigilance and Drug Safety Software Industry Revenue (Million) Forecast, by Application 2019 & 2032
- Table 13: Rest of South America Pharmacovigilance and Drug Safety Software Industry Revenue (Million) Forecast, by Application 2019 & 2032
- Table 14: Global Pharmacovigilance and Drug Safety Software Industry Revenue Million Forecast, by Country 2019 & 2032
- Table 15: Germany Pharmacovigilance and Drug Safety Software Industry Revenue (Million) Forecast, by Application 2019 & 2032
- Table 16: United Kingdom Pharmacovigilance and Drug Safety Software Industry Revenue (Million) Forecast, by Application 2019 & 2032
- Table 17: France Pharmacovigilance and Drug Safety Software Industry Revenue (Million) Forecast, by Application 2019 & 2032
- Table 18: Italy Pharmacovigilance and Drug Safety Software Industry Revenue (Million) Forecast, by Application 2019 & 2032
- Table 19: Spain Pharmacovigilance and Drug Safety Software Industry Revenue (Million) Forecast, by Application 2019 & 2032
- Table 20: Rest of Europe Pharmacovigilance and Drug Safety Software Industry Revenue (Million) Forecast, by Application 2019 & 2032
- Table 21: Global Pharmacovigilance and Drug Safety Software Industry Revenue Million Forecast, by Country 2019 & 2032
- Table 22: China Pharmacovigilance and Drug Safety Software Industry Revenue (Million) Forecast, by Application 2019 & 2032
- Table 23: Japan Pharmacovigilance and Drug Safety Software Industry Revenue (Million) Forecast, by Application 2019 & 2032
- Table 24: India Pharmacovigilance and Drug Safety Software Industry Revenue (Million) Forecast, by Application 2019 & 2032
- Table 25: South Korea Pharmacovigilance and Drug Safety Software Industry Revenue (Million) Forecast, by Application 2019 & 2032
- Table 26: Taiwan Pharmacovigilance and Drug Safety Software Industry Revenue (Million) Forecast, by Application 2019 & 2032
- Table 27: Australia Pharmacovigilance and Drug Safety Software Industry Revenue (Million) Forecast, by Application 2019 & 2032
- Table 28: Rest of Asia-Pacific Pharmacovigilance and Drug Safety Software Industry Revenue (Million) Forecast, by Application 2019 & 2032
- Table 29: Global Pharmacovigilance and Drug Safety Software Industry Revenue Million Forecast, by Country 2019 & 2032
- Table 30: Middle East Pharmacovigilance and Drug Safety Software Industry Revenue (Million) Forecast, by Application 2019 & 2032
- Table 31: Africa Pharmacovigilance and Drug Safety Software Industry Revenue (Million) Forecast, by Application 2019 & 2032
- Table 32: Global Pharmacovigilance and Drug Safety Software Industry Revenue Million Forecast, by Functionality 2019 & 2032
- Table 33: Global Pharmacovigilance and Drug Safety Software Industry Revenue Million Forecast, by Mode of Delivery 2019 & 2032
- Table 34: Global Pharmacovigilance and Drug Safety Software Industry Revenue Million Forecast, by End Users 2019 & 2032
- Table 35: Global Pharmacovigilance and Drug Safety Software Industry Revenue Million Forecast, by Country 2019 & 2032
- Table 36: United States Pharmacovigilance and Drug Safety Software Industry Revenue (Million) Forecast, by Application 2019 & 2032
- Table 37: Canada Pharmacovigilance and Drug Safety Software Industry Revenue (Million) Forecast, by Application 2019 & 2032
- Table 38: Mexico Pharmacovigilance and Drug Safety Software Industry Revenue (Million) Forecast, by Application 2019 & 2032
- Table 39: Global Pharmacovigilance and Drug Safety Software Industry Revenue Million Forecast, by Functionality 2019 & 2032
- Table 40: Global Pharmacovigilance and Drug Safety Software Industry Revenue Million Forecast, by Mode of Delivery 2019 & 2032
- Table 41: Global Pharmacovigilance and Drug Safety Software Industry Revenue Million Forecast, by End Users 2019 & 2032
- Table 42: Global Pharmacovigilance and Drug Safety Software Industry Revenue Million Forecast, by Country 2019 & 2032
- Table 43: Germany Pharmacovigilance and Drug Safety Software Industry Revenue (Million) Forecast, by Application 2019 & 2032
- Table 44: United Kingdom Pharmacovigilance and Drug Safety Software Industry Revenue (Million) Forecast, by Application 2019 & 2032
- Table 45: France Pharmacovigilance and Drug Safety Software Industry Revenue (Million) Forecast, by Application 2019 & 2032
- Table 46: Italy Pharmacovigilance and Drug Safety Software Industry Revenue (Million) Forecast, by Application 2019 & 2032
- Table 47: Spain Pharmacovigilance and Drug Safety Software Industry Revenue (Million) Forecast, by Application 2019 & 2032
- Table 48: Rest of Europe Pharmacovigilance and Drug Safety Software Industry Revenue (Million) Forecast, by Application 2019 & 2032
- Table 49: Global Pharmacovigilance and Drug Safety Software Industry Revenue Million Forecast, by Functionality 2019 & 2032
- Table 50: Global Pharmacovigilance and Drug Safety Software Industry Revenue Million Forecast, by Mode of Delivery 2019 & 2032
- Table 51: Global Pharmacovigilance and Drug Safety Software Industry Revenue Million Forecast, by End Users 2019 & 2032
- Table 52: Global Pharmacovigilance and Drug Safety Software Industry Revenue Million Forecast, by Country 2019 & 2032
- Table 53: China Pharmacovigilance and Drug Safety Software Industry Revenue (Million) Forecast, by Application 2019 & 2032
- Table 54: Japan Pharmacovigilance and Drug Safety Software Industry Revenue (Million) Forecast, by Application 2019 & 2032
- Table 55: India Pharmacovigilance and Drug Safety Software Industry Revenue (Million) Forecast, by Application 2019 & 2032
- Table 56: Australia Pharmacovigilance and Drug Safety Software Industry Revenue (Million) Forecast, by Application 2019 & 2032
- Table 57: South Korea Pharmacovigilance and Drug Safety Software Industry Revenue (Million) Forecast, by Application 2019 & 2032
- Table 58: Rest of Asia Pacific Pharmacovigilance and Drug Safety Software Industry Revenue (Million) Forecast, by Application 2019 & 2032
- Table 59: Global Pharmacovigilance and Drug Safety Software Industry Revenue Million Forecast, by Functionality 2019 & 2032
- Table 60: Global Pharmacovigilance and Drug Safety Software Industry Revenue Million Forecast, by Mode of Delivery 2019 & 2032
- Table 61: Global Pharmacovigilance and Drug Safety Software Industry Revenue Million Forecast, by End Users 2019 & 2032
- Table 62: Global Pharmacovigilance and Drug Safety Software Industry Revenue Million Forecast, by Country 2019 & 2032
- Table 63: GCC Pharmacovigilance and Drug Safety Software Industry Revenue (Million) Forecast, by Application 2019 & 2032
- Table 64: South Africa Pharmacovigilance and Drug Safety Software Industry Revenue (Million) Forecast, by Application 2019 & 2032
- Table 65: Rest of Middle East and Africa Pharmacovigilance and Drug Safety Software Industry Revenue (Million) Forecast, by Application 2019 & 2032
- Table 66: Global Pharmacovigilance and Drug Safety Software Industry Revenue Million Forecast, by Functionality 2019 & 2032
- Table 67: Global Pharmacovigilance and Drug Safety Software Industry Revenue Million Forecast, by Mode of Delivery 2019 & 2032
- Table 68: Global Pharmacovigilance and Drug Safety Software Industry Revenue Million Forecast, by End Users 2019 & 2032
- Table 69: Global Pharmacovigilance and Drug Safety Software Industry Revenue Million Forecast, by Country 2019 & 2032
- Table 70: Brazil Pharmacovigilance and Drug Safety Software Industry Revenue (Million) Forecast, by Application 2019 & 2032
- Table 71: Argentina Pharmacovigilance and Drug Safety Software Industry Revenue (Million) Forecast, by Application 2019 & 2032
- Table 72: Rest of South America Pharmacovigilance and Drug Safety Software Industry Revenue (Million) Forecast, by Application 2019 & 2032
Frequently Asked Questions
1. What is the projected Compound Annual Growth Rate (CAGR) of the Pharmacovigilance and Drug Safety Software Industry?
The projected CAGR is approximately 5.73%.
2. Which companies are prominent players in the Pharmacovigilance and Drug Safety Software Industry?
Key companies in the market include ArisGlobal, Sarjen Systems Pvt Ltd, Sparta Systems Inc, Ennov Solutions Inc, Oracle Corporation, Anju Software Inc, Veeva Systems, Ab Cube, United BioSource Corporation, Extedo GmbH.
3. What are the main segments of the Pharmacovigilance and Drug Safety Software Industry?
The market segments include Functionality, Mode of Delivery, End Users.
4. Can you provide details about the market size?
The market size is estimated to be USD 210.14 Million as of 2022.
5. What are some drivers contributing to market growth?
Increasing Incidence of Adverse Drug Reactions (ADRs); Increasing Adoption of Pharmacovigilance Software by Outsourcing Companies.
6. What are the notable trends driving market growth?
Fully Integrated Software Expected to Witness Significant Growth Over the Forecast Period.
7. Are there any restraints impacting market growth?
Lack of Awareness about Pharmacovigilance.
8. Can you provide examples of recent developments in the market?
October 2022: PegBio selected LifeSphere MultiVigilance, a flagship product by ArisGlobal, to transition their pharmacovigilance from Contract Research Organization (CRO) services to in-house practices with this leading pharmacovigilance software.
9. What pricing options are available for accessing the report?
Pricing options include single-user, multi-user, and enterprise licenses priced at USD 4750, USD 5250, and USD 8750 respectively.
10. Is the market size provided in terms of value or volume?
The market size is provided in terms of value, measured in Million.
11. Are there any specific market keywords associated with the report?
Yes, the market keyword associated with the report is "Pharmacovigilance and Drug Safety Software Industry," which aids in identifying and referencing the specific market segment covered.
12. How do I determine which pricing option suits my needs best?
The pricing options vary based on user requirements and access needs. Individual users may opt for single-user licenses, while businesses requiring broader access may choose multi-user or enterprise licenses for cost-effective access to the report.
13. Are there any additional resources or data provided in the Pharmacovigilance and Drug Safety Software Industry report?
While the report offers comprehensive insights, it's advisable to review the specific contents or supplementary materials provided to ascertain if additional resources or data are available.
14. How can I stay updated on further developments or reports in the Pharmacovigilance and Drug Safety Software Industry?
To stay informed about further developments, trends, and reports in the Pharmacovigilance and Drug Safety Software Industry, consider subscribing to industry newsletters, following relevant companies and organizations, or regularly checking reputable industry news sources and publications.
Methodology
Step 1 - Identification of Relevant Samples Size from Population Database


Step 2 - Approaches for Defining Global Market Size (Value, Volume* & Price*)

Note*: In applicable scenarios
Step 3 - Data Sources
Primary Research
- Web Analytics
- Survey Reports
- Research Institute
- Latest Research Reports
- Opinion Leaders
Secondary Research
- Annual Reports
- White Paper
- Latest Press Release
- Industry Association
- Paid Database
- Investor Presentations

Step 4 - Data Triangulation
Involves using different sources of information in order to increase the validity of a study
These sources are likely to be stakeholders in a program - participants, other researchers, program staff, other community members, and so on.
Then we put all data in single framework & apply various statistical tools to find out the dynamic on the market.
During the analysis stage, feedback from the stakeholder groups would be compared to determine areas of agreement as well as areas of divergence


