
Key Insights
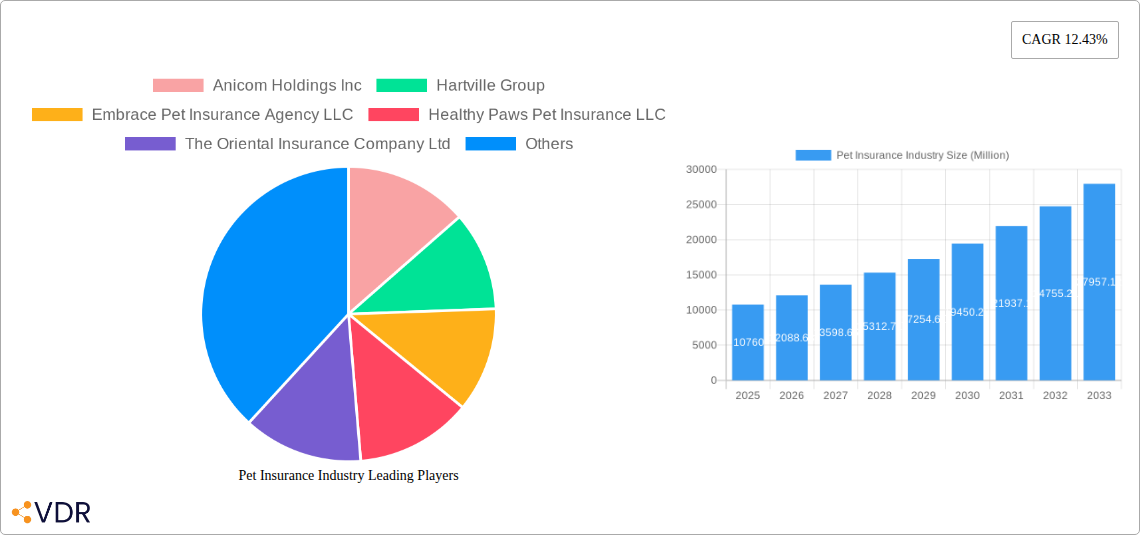
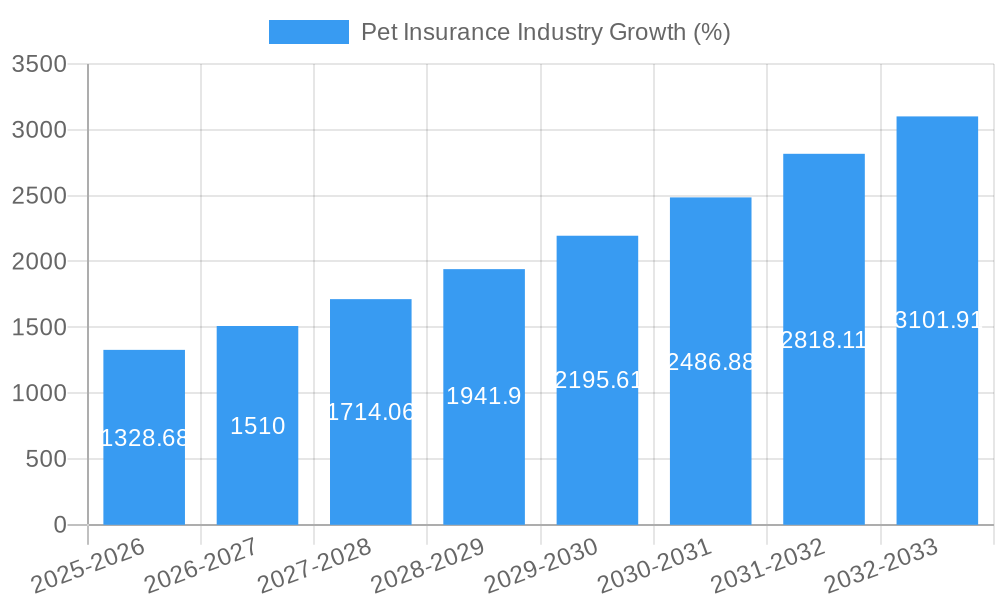
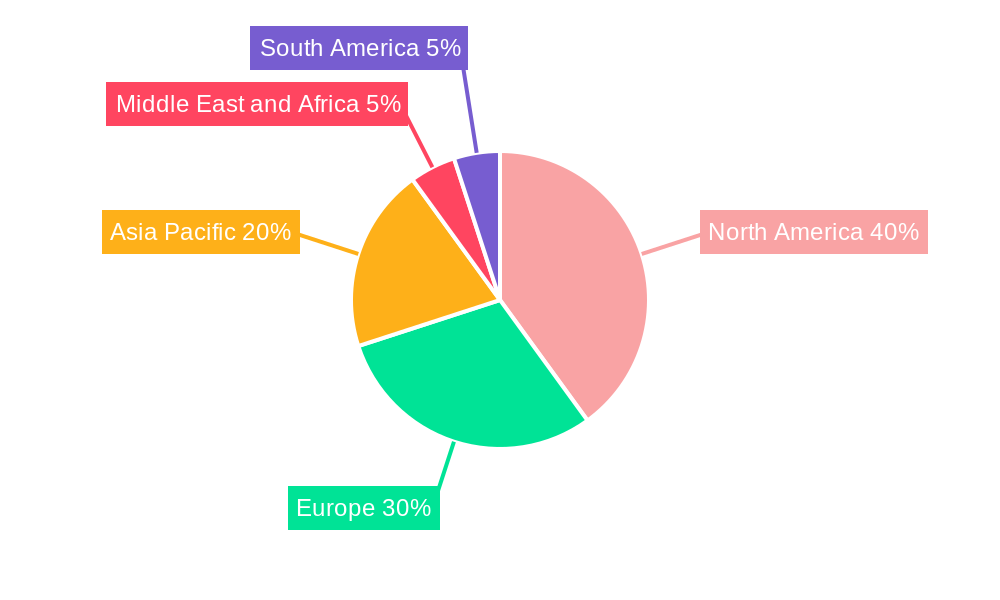
The global pet insurance market is experiencing robust growth, projected to reach \$10.76 billion in 2025 and exhibiting a Compound Annual Growth Rate (CAGR) of 12.43% from 2025 to 2033. This expansion is driven by several key factors. Increasing pet ownership globally, coupled with rising pet healthcare costs, is pushing pet owners towards insurance as a means of managing unexpected veterinary expenses. A growing awareness of pet insurance benefits and the availability of more comprehensive coverage options are also significant contributors. The market is segmented by policy type (illness and accident, chronic conditions, other), animal type (dog, cat, other), and provider type (public, private). Dogs and cats currently dominate the market, reflecting their widespread popularity as companion animals. Private providers hold a larger market share due to their wider range of plans and more competitive pricing strategies. Geographic distribution shows strong growth across North America and Europe, driven by higher pet ownership rates and established insurance markets. However, the Asia-Pacific region is projected to experience significant growth in the coming years, fueled by increasing pet ownership and rising disposable incomes.
Looking ahead, the pet insurance market is poised for continued expansion. Technological advancements, such as telehealth and remote monitoring, are expected to enhance efficiency and improve access to veterinary care, potentially driving further insurance adoption. Increased competition among insurance providers will likely lead to more innovative product offerings and potentially lower premiums, further stimulating market growth. However, challenges remain, including the need to address affordability concerns and increase awareness in less developed markets. Regulatory changes and variations in coverage across different regions will also play a role in shaping the market's future trajectory. Despite these challenges, the long-term outlook for the pet insurance market remains positive, with considerable potential for expansion in both established and emerging markets.
Pet Insurance Industry Market Report: 2019-2033
This comprehensive report provides an in-depth analysis of the global pet insurance market, encompassing historical data (2019-2024), current estimates (2025), and future forecasts (2025-2033). We delve into market dynamics, growth trends, regional performance, product landscapes, key players, and emerging opportunities, offering invaluable insights for industry professionals, investors, and stakeholders. The report covers key segments including policy types (Illnesses and Accidents, Chronic Conditions, Other Policies), animal types (Dog, Cat, Other Animals), and providers (Public, Private). The market size is presented in million units.
Pet Insurance Industry Market Dynamics & Structure
The global pet insurance market, valued at xx million in 2025, exhibits a moderately concentrated structure, with key players like Anicom Holdings Inc, and Trupanion Inc. holding significant market share. Technological innovation, particularly in telehealth and data analytics, is a crucial growth driver. Stringent regulatory frameworks and varying consumer awareness across regions influence market penetration. The market faces competition from alternative pet healthcare financing options. The increasing humanization of pets and rising pet ownership are key demographic factors. M&A activity, exemplified by JAB Holdings' acquisition of Agila in 2022, is shaping market consolidation.
- Market Concentration: Moderately concentrated, with top players holding xx% market share in 2025.
- Technological Drivers: Telehealth, data analytics, and AI-powered claim processing.
- Regulatory Framework: Varies significantly across regions, impacting market entry and product offerings.
- Competitive Substitutes: Savings accounts, crowdfunding platforms for veterinary expenses.
- End-User Demographics: Rising pet ownership, increasing disposable incomes in developed markets.
- M&A Trends: Increasing consolidation through acquisitions and partnerships. xx M&A deals recorded between 2019-2024.
Pet Insurance Industry Growth Trends & Insights
The global pet insurance market experienced robust growth during the historical period (2019-2024), exhibiting a CAGR of xx%. This growth is driven by several factors, including increasing pet ownership, rising pet healthcare costs, and heightened consumer awareness regarding pet insurance benefits. Technological advancements, such as online platforms and mobile apps, have simplified policy purchasing and claim processing. A shift in consumer behavior towards preventive pet care and a willingness to invest in pet wellness also contributes to the market's expansion. The market is expected to maintain a steady growth trajectory throughout the forecast period (2025-2033), with a projected CAGR of xx%, reaching xx million by 2033. Market penetration is expected to increase from xx% in 2025 to xx% in 2033.
Dominant Regions, Countries, or Segments in Pet Insurance Industry
North America currently dominates the pet insurance market, driven by high pet ownership rates, strong consumer spending power, and a well-established insurance infrastructure. Within this region, the United States holds the largest market share. The segment focused on "Illnesses and Accidents" policies represents the largest revenue stream, followed by "Chronic Conditions." Dogs constitute the majority of insured animals, reflecting their higher prevalence as pets. The private sector dominates the provider landscape, offering a broader range of products and services.
- Key Drivers (North America): High pet ownership, high disposable incomes, established insurance infrastructure, strong consumer awareness.
- Dominance Factors: High market share, strong regulatory support, high insurance penetration rate.
- Growth Potential: Further market penetration in underserved areas, expansion into new product categories, adoption of innovative technologies.
Pet Insurance Industry Product Landscape
Pet insurance products are increasingly diverse, encompassing coverage for illnesses, accidents, chronic conditions, and wellness programs. Innovations include customized plans catering to specific breeds, age groups, and health conditions. Telemedicine integration and digital claim processing are enhancing convenience and efficiency. Unique selling propositions include bundled services, preventative care options, and flexible payment plans. Technological advancements are enabling the use of wearable technology to monitor pet health, leading to personalized risk assessment and pricing.
Key Drivers, Barriers & Challenges in Pet Insurance Industry
Key Drivers:
- Rising pet ownership and expenditure on pet healthcare.
- Increasing consumer awareness of pet insurance benefits.
- Technological advancements enabling streamlined processes and personalized products.
Challenges & Restraints:
- High claim costs and potential for increased premiums.
- Varying regulatory landscapes across different regions.
- Competition from alternative financing options and healthcare providers. This leads to a xx% reduction in market growth annually.
Emerging Opportunities in Pet Insurance Industry
Untapped markets in developing countries with rising middle classes offer substantial growth potential. The integration of wearable technology and telemedicine creates opportunities for personalized risk assessment and preventive care. Evolving consumer preferences towards holistic pet wellness are driving demand for comprehensive coverage encompassing wellness plans and alternative therapies.
Growth Accelerators in the Pet Insurance Industry
Strategic partnerships between pet insurance providers and veterinary clinics, pet food companies, and e-commerce platforms are enhancing customer reach and service integration. Technological innovations, such as AI-powered claim processing and personalized risk assessment, are streamlining operations and improving customer experience. Expansion into new geographic markets, particularly in developing economies, presents significant growth opportunities.
Key Players Shaping the Pet Insurance Industry Market
- Anicom Holdings Inc
- Hartville Group
- Embrace Pet Insurance Agency LLC
- Healthy Paws Pet Insurance LLC
- The Oriental Insurance Company Ltd
- Petplan
- Oneplan
- Figo Pet Insurance LLC
- Medibank Private Limited
- Dotsure co za
- Metlife Services and Solutions LLC (Petfirst Healthcare LLC)
Notable Milestones in Pet Insurance Industry Sector
- December 2021: Chewy Inc. and Trupanion Inc. Japan partnered to offer pet health insurance plans to over 20 million customers. This significantly expanded market reach and broadened access to pet insurance.
- July 2022: JAB Holdings acquired Agila, a German pet insurance provider, demonstrating increasing consolidation and global expansion within the pet insurance sector.
In-Depth Pet Insurance Industry Market Outlook
The pet insurance market is poised for sustained growth, driven by several factors including rising pet ownership, increasing pet healthcare costs, and continued technological advancements. Strategic partnerships, expansion into new markets, and innovation in product offerings will be key to unlocking future market potential. The focus on preventative care, personalized insurance solutions, and the integration of technology will shape the landscape of the industry in the coming years, promising strong growth and increased market penetration.
Pet Insurance Industry Segmentation
-
1. Policy
- 1.1. Illnesses and Accidents
- 1.2. Chronic Conditions
- 1.3. Other Policies
-
2. Animal
- 2.1. Dog
- 2.2. Cat
- 2.3. Other Animals
-
3. Provider
- 3.1. Public
- 3.2. Private
Pet Insurance Industry Segmentation By Geography
-
1. North America
- 1.1. United States
- 1.2. Canada
- 1.3. Mexico
-
2. Europe
- 2.1. Germany
- 2.2. United Kingdom
- 2.3. France
- 2.4. Italy
- 2.5. Spain
- 2.6. Rest of Europe
-
3. Asia Pacific
- 3.1. China
- 3.2. Japan
- 3.3. India
- 3.4. Australia
- 3.5. South Korea
- 3.6. Rest of Asia Pacific
-
4. Middle East and Africa
- 4.1. GCC
- 4.2. South Africa
- 4.3. Rest of Middle East and Africa
-
5. South America
- 5.1. Brazil
- 5.2. Argentina
- 5.3. Rest of South America
Pet Insurance Industry REPORT HIGHLIGHTS
| Aspects | Details |
|---|---|
| Study Period | 2019-2033 |
| Base Year | 2024 |
| Estimated Year | 2025 |
| Forecast Period | 2025-2033 |
| Historical Period | 2019-2024 |
| Growth Rate | CAGR of 12.43% from 2019-2033 |
| Segmentation |
|
Table of Contents
- 1. Introduction
- 1.1. Research Scope
- 1.2. Market Segmentation
- 1.3. Research Methodology
- 1.4. Definitions and Assumptions
- 2. Executive Summary
- 2.1. Introduction
- 3. Market Dynamics
- 3.1. Introduction
- 3.2. Market Drivers
- 3.2.1. Increasing Number of Pet Adoption; Rising Awareness Regarding Pet Insurance
- 3.3. Market Restrains
- 3.3.1. Lack of Standardized Pet Health Codes for Reimbursement; Low Adoption in Emerging Countries
- 3.4. Market Trends
- 3.4.1. The Dogs Segment is Expected to Show Lucrative Growth Opportunities in the Pet Insurance Market
- 4. Market Factor Analysis
- 4.1. Porters Five Forces
- 4.2. Supply/Value Chain
- 4.3. PESTEL analysis
- 4.4. Market Entropy
- 4.5. Patent/Trademark Analysis
- 5. Global Pet Insurance Industry Analysis, Insights and Forecast, 2019-2031
- 5.1. Market Analysis, Insights and Forecast - by Policy
- 5.1.1. Illnesses and Accidents
- 5.1.2. Chronic Conditions
- 5.1.3. Other Policies
- 5.2. Market Analysis, Insights and Forecast - by Animal
- 5.2.1. Dog
- 5.2.2. Cat
- 5.2.3. Other Animals
- 5.3. Market Analysis, Insights and Forecast - by Provider
- 5.3.1. Public
- 5.3.2. Private
- 5.4. Market Analysis, Insights and Forecast - by Region
- 5.4.1. North America
- 5.4.2. Europe
- 5.4.3. Asia Pacific
- 5.4.4. Middle East and Africa
- 5.4.5. South America
- 5.1. Market Analysis, Insights and Forecast - by Policy
- 6. North America Pet Insurance Industry Analysis, Insights and Forecast, 2019-2031
- 6.1. Market Analysis, Insights and Forecast - by Policy
- 6.1.1. Illnesses and Accidents
- 6.1.2. Chronic Conditions
- 6.1.3. Other Policies
- 6.2. Market Analysis, Insights and Forecast - by Animal
- 6.2.1. Dog
- 6.2.2. Cat
- 6.2.3. Other Animals
- 6.3. Market Analysis, Insights and Forecast - by Provider
- 6.3.1. Public
- 6.3.2. Private
- 6.1. Market Analysis, Insights and Forecast - by Policy
- 7. Europe Pet Insurance Industry Analysis, Insights and Forecast, 2019-2031
- 7.1. Market Analysis, Insights and Forecast - by Policy
- 7.1.1. Illnesses and Accidents
- 7.1.2. Chronic Conditions
- 7.1.3. Other Policies
- 7.2. Market Analysis, Insights and Forecast - by Animal
- 7.2.1. Dog
- 7.2.2. Cat
- 7.2.3. Other Animals
- 7.3. Market Analysis, Insights and Forecast - by Provider
- 7.3.1. Public
- 7.3.2. Private
- 7.1. Market Analysis, Insights and Forecast - by Policy
- 8. Asia Pacific Pet Insurance Industry Analysis, Insights and Forecast, 2019-2031
- 8.1. Market Analysis, Insights and Forecast - by Policy
- 8.1.1. Illnesses and Accidents
- 8.1.2. Chronic Conditions
- 8.1.3. Other Policies
- 8.2. Market Analysis, Insights and Forecast - by Animal
- 8.2.1. Dog
- 8.2.2. Cat
- 8.2.3. Other Animals
- 8.3. Market Analysis, Insights and Forecast - by Provider
- 8.3.1. Public
- 8.3.2. Private
- 8.1. Market Analysis, Insights and Forecast - by Policy
- 9. Middle East and Africa Pet Insurance Industry Analysis, Insights and Forecast, 2019-2031
- 9.1. Market Analysis, Insights and Forecast - by Policy
- 9.1.1. Illnesses and Accidents
- 9.1.2. Chronic Conditions
- 9.1.3. Other Policies
- 9.2. Market Analysis, Insights and Forecast - by Animal
- 9.2.1. Dog
- 9.2.2. Cat
- 9.2.3. Other Animals
- 9.3. Market Analysis, Insights and Forecast - by Provider
- 9.3.1. Public
- 9.3.2. Private
- 9.1. Market Analysis, Insights and Forecast - by Policy
- 10. South America Pet Insurance Industry Analysis, Insights and Forecast, 2019-2031
- 10.1. Market Analysis, Insights and Forecast - by Policy
- 10.1.1. Illnesses and Accidents
- 10.1.2. Chronic Conditions
- 10.1.3. Other Policies
- 10.2. Market Analysis, Insights and Forecast - by Animal
- 10.2.1. Dog
- 10.2.2. Cat
- 10.2.3. Other Animals
- 10.3. Market Analysis, Insights and Forecast - by Provider
- 10.3.1. Public
- 10.3.2. Private
- 10.1. Market Analysis, Insights and Forecast - by Policy
- 11. North America Pet Insurance Industry Analysis, Insights and Forecast, 2019-2031
- 11.1. Market Analysis, Insights and Forecast - By Country/Sub-region
- 11.1.1. undefined
- 12. Europe Pet Insurance Industry Analysis, Insights and Forecast, 2019-2031
- 12.1. Market Analysis, Insights and Forecast - By Country/Sub-region
- 12.1.1. undefined
- 13. Asia Pacific Pet Insurance Industry Analysis, Insights and Forecast, 2019-2031
- 13.1. Market Analysis, Insights and Forecast - By Country/Sub-region
- 13.1.1. undefined
- 14. Middle East and Africa Pet Insurance Industry Analysis, Insights and Forecast, 2019-2031
- 14.1. Market Analysis, Insights and Forecast - By Country/Sub-region
- 14.1.1. undefined
- 15. South Americ Pet Insurance Industry Analysis, Insights and Forecast, 2019-2031
- 15.1. Market Analysis, Insights and Forecast - By Country/Sub-region
- 15.1.1. undefined
- 16. Competitive Analysis
- 16.1. Global Market Share Analysis 2024
- 16.2. Company Profiles
- 16.2.1 Anicom Holdings Inc
- 16.2.1.1. Overview
- 16.2.1.2. Products
- 16.2.1.3. SWOT Analysis
- 16.2.1.4. Recent Developments
- 16.2.1.5. Financials (Based on Availability)
- 16.2.2 Hartville Group
- 16.2.2.1. Overview
- 16.2.2.2. Products
- 16.2.2.3. SWOT Analysis
- 16.2.2.4. Recent Developments
- 16.2.2.5. Financials (Based on Availability)
- 16.2.3 Embrace Pet Insurance Agency LLC
- 16.2.3.1. Overview
- 16.2.3.2. Products
- 16.2.3.3. SWOT Analysis
- 16.2.3.4. Recent Developments
- 16.2.3.5. Financials (Based on Availability)
- 16.2.4 Healthy Paws Pet Insurance LLC
- 16.2.4.1. Overview
- 16.2.4.2. Products
- 16.2.4.3. SWOT Analysis
- 16.2.4.4. Recent Developments
- 16.2.4.5. Financials (Based on Availability)
- 16.2.5 The Oriental Insurance Company Ltd
- 16.2.5.1. Overview
- 16.2.5.2. Products
- 16.2.5.3. SWOT Analysis
- 16.2.5.4. Recent Developments
- 16.2.5.5. Financials (Based on Availability)
- 16.2.6 Petplan
- 16.2.6.1. Overview
- 16.2.6.2. Products
- 16.2.6.3. SWOT Analysis
- 16.2.6.4. Recent Developments
- 16.2.6.5. Financials (Based on Availability)
- 16.2.7 Oneplan
- 16.2.7.1. Overview
- 16.2.7.2. Products
- 16.2.7.3. SWOT Analysis
- 16.2.7.4. Recent Developments
- 16.2.7.5. Financials (Based on Availability)
- 16.2.8 Figo Pet Insurance LLC
- 16.2.8.1. Overview
- 16.2.8.2. Products
- 16.2.8.3. SWOT Analysis
- 16.2.8.4. Recent Developments
- 16.2.8.5. Financials (Based on Availability)
- 16.2.9 Medibank Private Limited
- 16.2.9.1. Overview
- 16.2.9.2. Products
- 16.2.9.3. SWOT Analysis
- 16.2.9.4. Recent Developments
- 16.2.9.5. Financials (Based on Availability)
- 16.2.10 Dotsure co za
- 16.2.10.1. Overview
- 16.2.10.2. Products
- 16.2.10.3. SWOT Analysis
- 16.2.10.4. Recent Developments
- 16.2.10.5. Financials (Based on Availability)
- 16.2.11 Metlife Services and Solutions LLC (Petfirst Healthcare LLC)
- 16.2.11.1. Overview
- 16.2.11.2. Products
- 16.2.11.3. SWOT Analysis
- 16.2.11.4. Recent Developments
- 16.2.11.5. Financials (Based on Availability)
- 16.2.1 Anicom Holdings Inc
List of Figures
- Figure 1: Global Pet Insurance Industry Revenue Breakdown (Million, %) by Region 2024 & 2032
- Figure 2: Global Pet Insurance Industry Volume Breakdown (K Unit, %) by Region 2024 & 2032
- Figure 3: North America Pet Insurance Industry Revenue (Million), by Country 2024 & 2032
- Figure 4: North America Pet Insurance Industry Volume (K Unit), by Country 2024 & 2032
- Figure 5: North America Pet Insurance Industry Revenue Share (%), by Country 2024 & 2032
- Figure 6: North America Pet Insurance Industry Volume Share (%), by Country 2024 & 2032
- Figure 7: Europe Pet Insurance Industry Revenue (Million), by Country 2024 & 2032
- Figure 8: Europe Pet Insurance Industry Volume (K Unit), by Country 2024 & 2032
- Figure 9: Europe Pet Insurance Industry Revenue Share (%), by Country 2024 & 2032
- Figure 10: Europe Pet Insurance Industry Volume Share (%), by Country 2024 & 2032
- Figure 11: Asia Pacific Pet Insurance Industry Revenue (Million), by Country 2024 & 2032
- Figure 12: Asia Pacific Pet Insurance Industry Volume (K Unit), by Country 2024 & 2032
- Figure 13: Asia Pacific Pet Insurance Industry Revenue Share (%), by Country 2024 & 2032
- Figure 14: Asia Pacific Pet Insurance Industry Volume Share (%), by Country 2024 & 2032
- Figure 15: Middle East and Africa Pet Insurance Industry Revenue (Million), by Country 2024 & 2032
- Figure 16: Middle East and Africa Pet Insurance Industry Volume (K Unit), by Country 2024 & 2032
- Figure 17: Middle East and Africa Pet Insurance Industry Revenue Share (%), by Country 2024 & 2032
- Figure 18: Middle East and Africa Pet Insurance Industry Volume Share (%), by Country 2024 & 2032
- Figure 19: South Americ Pet Insurance Industry Revenue (Million), by Country 2024 & 2032
- Figure 20: South Americ Pet Insurance Industry Volume (K Unit), by Country 2024 & 2032
- Figure 21: South Americ Pet Insurance Industry Revenue Share (%), by Country 2024 & 2032
- Figure 22: South Americ Pet Insurance Industry Volume Share (%), by Country 2024 & 2032
- Figure 23: North America Pet Insurance Industry Revenue (Million), by Policy 2024 & 2032
- Figure 24: North America Pet Insurance Industry Volume (K Unit), by Policy 2024 & 2032
- Figure 25: North America Pet Insurance Industry Revenue Share (%), by Policy 2024 & 2032
- Figure 26: North America Pet Insurance Industry Volume Share (%), by Policy 2024 & 2032
- Figure 27: North America Pet Insurance Industry Revenue (Million), by Animal 2024 & 2032
- Figure 28: North America Pet Insurance Industry Volume (K Unit), by Animal 2024 & 2032
- Figure 29: North America Pet Insurance Industry Revenue Share (%), by Animal 2024 & 2032
- Figure 30: North America Pet Insurance Industry Volume Share (%), by Animal 2024 & 2032
- Figure 31: North America Pet Insurance Industry Revenue (Million), by Provider 2024 & 2032
- Figure 32: North America Pet Insurance Industry Volume (K Unit), by Provider 2024 & 2032
- Figure 33: North America Pet Insurance Industry Revenue Share (%), by Provider 2024 & 2032
- Figure 34: North America Pet Insurance Industry Volume Share (%), by Provider 2024 & 2032
- Figure 35: North America Pet Insurance Industry Revenue (Million), by Country 2024 & 2032
- Figure 36: North America Pet Insurance Industry Volume (K Unit), by Country 2024 & 2032
- Figure 37: North America Pet Insurance Industry Revenue Share (%), by Country 2024 & 2032
- Figure 38: North America Pet Insurance Industry Volume Share (%), by Country 2024 & 2032
- Figure 39: Europe Pet Insurance Industry Revenue (Million), by Policy 2024 & 2032
- Figure 40: Europe Pet Insurance Industry Volume (K Unit), by Policy 2024 & 2032
- Figure 41: Europe Pet Insurance Industry Revenue Share (%), by Policy 2024 & 2032
- Figure 42: Europe Pet Insurance Industry Volume Share (%), by Policy 2024 & 2032
- Figure 43: Europe Pet Insurance Industry Revenue (Million), by Animal 2024 & 2032
- Figure 44: Europe Pet Insurance Industry Volume (K Unit), by Animal 2024 & 2032
- Figure 45: Europe Pet Insurance Industry Revenue Share (%), by Animal 2024 & 2032
- Figure 46: Europe Pet Insurance Industry Volume Share (%), by Animal 2024 & 2032
- Figure 47: Europe Pet Insurance Industry Revenue (Million), by Provider 2024 & 2032
- Figure 48: Europe Pet Insurance Industry Volume (K Unit), by Provider 2024 & 2032
- Figure 49: Europe Pet Insurance Industry Revenue Share (%), by Provider 2024 & 2032
- Figure 50: Europe Pet Insurance Industry Volume Share (%), by Provider 2024 & 2032
- Figure 51: Europe Pet Insurance Industry Revenue (Million), by Country 2024 & 2032
- Figure 52: Europe Pet Insurance Industry Volume (K Unit), by Country 2024 & 2032
- Figure 53: Europe Pet Insurance Industry Revenue Share (%), by Country 2024 & 2032
- Figure 54: Europe Pet Insurance Industry Volume Share (%), by Country 2024 & 2032
- Figure 55: Asia Pacific Pet Insurance Industry Revenue (Million), by Policy 2024 & 2032
- Figure 56: Asia Pacific Pet Insurance Industry Volume (K Unit), by Policy 2024 & 2032
- Figure 57: Asia Pacific Pet Insurance Industry Revenue Share (%), by Policy 2024 & 2032
- Figure 58: Asia Pacific Pet Insurance Industry Volume Share (%), by Policy 2024 & 2032
- Figure 59: Asia Pacific Pet Insurance Industry Revenue (Million), by Animal 2024 & 2032
- Figure 60: Asia Pacific Pet Insurance Industry Volume (K Unit), by Animal 2024 & 2032
- Figure 61: Asia Pacific Pet Insurance Industry Revenue Share (%), by Animal 2024 & 2032
- Figure 62: Asia Pacific Pet Insurance Industry Volume Share (%), by Animal 2024 & 2032
- Figure 63: Asia Pacific Pet Insurance Industry Revenue (Million), by Provider 2024 & 2032
- Figure 64: Asia Pacific Pet Insurance Industry Volume (K Unit), by Provider 2024 & 2032
- Figure 65: Asia Pacific Pet Insurance Industry Revenue Share (%), by Provider 2024 & 2032
- Figure 66: Asia Pacific Pet Insurance Industry Volume Share (%), by Provider 2024 & 2032
- Figure 67: Asia Pacific Pet Insurance Industry Revenue (Million), by Country 2024 & 2032
- Figure 68: Asia Pacific Pet Insurance Industry Volume (K Unit), by Country 2024 & 2032
- Figure 69: Asia Pacific Pet Insurance Industry Revenue Share (%), by Country 2024 & 2032
- Figure 70: Asia Pacific Pet Insurance Industry Volume Share (%), by Country 2024 & 2032
- Figure 71: Middle East and Africa Pet Insurance Industry Revenue (Million), by Policy 2024 & 2032
- Figure 72: Middle East and Africa Pet Insurance Industry Volume (K Unit), by Policy 2024 & 2032
- Figure 73: Middle East and Africa Pet Insurance Industry Revenue Share (%), by Policy 2024 & 2032
- Figure 74: Middle East and Africa Pet Insurance Industry Volume Share (%), by Policy 2024 & 2032
- Figure 75: Middle East and Africa Pet Insurance Industry Revenue (Million), by Animal 2024 & 2032
- Figure 76: Middle East and Africa Pet Insurance Industry Volume (K Unit), by Animal 2024 & 2032
- Figure 77: Middle East and Africa Pet Insurance Industry Revenue Share (%), by Animal 2024 & 2032
- Figure 78: Middle East and Africa Pet Insurance Industry Volume Share (%), by Animal 2024 & 2032
- Figure 79: Middle East and Africa Pet Insurance Industry Revenue (Million), by Provider 2024 & 2032
- Figure 80: Middle East and Africa Pet Insurance Industry Volume (K Unit), by Provider 2024 & 2032
- Figure 81: Middle East and Africa Pet Insurance Industry Revenue Share (%), by Provider 2024 & 2032
- Figure 82: Middle East and Africa Pet Insurance Industry Volume Share (%), by Provider 2024 & 2032
- Figure 83: Middle East and Africa Pet Insurance Industry Revenue (Million), by Country 2024 & 2032
- Figure 84: Middle East and Africa Pet Insurance Industry Volume (K Unit), by Country 2024 & 2032
- Figure 85: Middle East and Africa Pet Insurance Industry Revenue Share (%), by Country 2024 & 2032
- Figure 86: Middle East and Africa Pet Insurance Industry Volume Share (%), by Country 2024 & 2032
- Figure 87: South America Pet Insurance Industry Revenue (Million), by Policy 2024 & 2032
- Figure 88: South America Pet Insurance Industry Volume (K Unit), by Policy 2024 & 2032
- Figure 89: South America Pet Insurance Industry Revenue Share (%), by Policy 2024 & 2032
- Figure 90: South America Pet Insurance Industry Volume Share (%), by Policy 2024 & 2032
- Figure 91: South America Pet Insurance Industry Revenue (Million), by Animal 2024 & 2032
- Figure 92: South America Pet Insurance Industry Volume (K Unit), by Animal 2024 & 2032
- Figure 93: South America Pet Insurance Industry Revenue Share (%), by Animal 2024 & 2032
- Figure 94: South America Pet Insurance Industry Volume Share (%), by Animal 2024 & 2032
- Figure 95: South America Pet Insurance Industry Revenue (Million), by Provider 2024 & 2032
- Figure 96: South America Pet Insurance Industry Volume (K Unit), by Provider 2024 & 2032
- Figure 97: South America Pet Insurance Industry Revenue Share (%), by Provider 2024 & 2032
- Figure 98: South America Pet Insurance Industry Volume Share (%), by Provider 2024 & 2032
- Figure 99: South America Pet Insurance Industry Revenue (Million), by Country 2024 & 2032
- Figure 100: South America Pet Insurance Industry Volume (K Unit), by Country 2024 & 2032
- Figure 101: South America Pet Insurance Industry Revenue Share (%), by Country 2024 & 2032
- Figure 102: South America Pet Insurance Industry Volume Share (%), by Country 2024 & 2032
List of Tables
- Table 1: Global Pet Insurance Industry Revenue Million Forecast, by Region 2019 & 2032
- Table 2: Global Pet Insurance Industry Volume K Unit Forecast, by Region 2019 & 2032
- Table 3: Global Pet Insurance Industry Revenue Million Forecast, by Policy 2019 & 2032
- Table 4: Global Pet Insurance Industry Volume K Unit Forecast, by Policy 2019 & 2032
- Table 5: Global Pet Insurance Industry Revenue Million Forecast, by Animal 2019 & 2032
- Table 6: Global Pet Insurance Industry Volume K Unit Forecast, by Animal 2019 & 2032
- Table 7: Global Pet Insurance Industry Revenue Million Forecast, by Provider 2019 & 2032
- Table 8: Global Pet Insurance Industry Volume K Unit Forecast, by Provider 2019 & 2032
- Table 9: Global Pet Insurance Industry Revenue Million Forecast, by Region 2019 & 2032
- Table 10: Global Pet Insurance Industry Volume K Unit Forecast, by Region 2019 & 2032
- Table 11: Global Pet Insurance Industry Revenue Million Forecast, by Country 2019 & 2032
- Table 12: Global Pet Insurance Industry Volume K Unit Forecast, by Country 2019 & 2032
- Table 13: Global Pet Insurance Industry Revenue Million Forecast, by Country 2019 & 2032
- Table 14: Global Pet Insurance Industry Volume K Unit Forecast, by Country 2019 & 2032
- Table 15: Global Pet Insurance Industry Revenue Million Forecast, by Country 2019 & 2032
- Table 16: Global Pet Insurance Industry Volume K Unit Forecast, by Country 2019 & 2032
- Table 17: Global Pet Insurance Industry Revenue Million Forecast, by Country 2019 & 2032
- Table 18: Global Pet Insurance Industry Volume K Unit Forecast, by Country 2019 & 2032
- Table 19: Global Pet Insurance Industry Revenue Million Forecast, by Country 2019 & 2032
- Table 20: Global Pet Insurance Industry Volume K Unit Forecast, by Country 2019 & 2032
- Table 21: Global Pet Insurance Industry Revenue Million Forecast, by Policy 2019 & 2032
- Table 22: Global Pet Insurance Industry Volume K Unit Forecast, by Policy 2019 & 2032
- Table 23: Global Pet Insurance Industry Revenue Million Forecast, by Animal 2019 & 2032
- Table 24: Global Pet Insurance Industry Volume K Unit Forecast, by Animal 2019 & 2032
- Table 25: Global Pet Insurance Industry Revenue Million Forecast, by Provider 2019 & 2032
- Table 26: Global Pet Insurance Industry Volume K Unit Forecast, by Provider 2019 & 2032
- Table 27: Global Pet Insurance Industry Revenue Million Forecast, by Country 2019 & 2032
- Table 28: Global Pet Insurance Industry Volume K Unit Forecast, by Country 2019 & 2032
- Table 29: United States Pet Insurance Industry Revenue (Million) Forecast, by Application 2019 & 2032
- Table 30: United States Pet Insurance Industry Volume (K Unit) Forecast, by Application 2019 & 2032
- Table 31: Canada Pet Insurance Industry Revenue (Million) Forecast, by Application 2019 & 2032
- Table 32: Canada Pet Insurance Industry Volume (K Unit) Forecast, by Application 2019 & 2032
- Table 33: Mexico Pet Insurance Industry Revenue (Million) Forecast, by Application 2019 & 2032
- Table 34: Mexico Pet Insurance Industry Volume (K Unit) Forecast, by Application 2019 & 2032
- Table 35: Global Pet Insurance Industry Revenue Million Forecast, by Policy 2019 & 2032
- Table 36: Global Pet Insurance Industry Volume K Unit Forecast, by Policy 2019 & 2032
- Table 37: Global Pet Insurance Industry Revenue Million Forecast, by Animal 2019 & 2032
- Table 38: Global Pet Insurance Industry Volume K Unit Forecast, by Animal 2019 & 2032
- Table 39: Global Pet Insurance Industry Revenue Million Forecast, by Provider 2019 & 2032
- Table 40: Global Pet Insurance Industry Volume K Unit Forecast, by Provider 2019 & 2032
- Table 41: Global Pet Insurance Industry Revenue Million Forecast, by Country 2019 & 2032
- Table 42: Global Pet Insurance Industry Volume K Unit Forecast, by Country 2019 & 2032
- Table 43: Germany Pet Insurance Industry Revenue (Million) Forecast, by Application 2019 & 2032
- Table 44: Germany Pet Insurance Industry Volume (K Unit) Forecast, by Application 2019 & 2032
- Table 45: United Kingdom Pet Insurance Industry Revenue (Million) Forecast, by Application 2019 & 2032
- Table 46: United Kingdom Pet Insurance Industry Volume (K Unit) Forecast, by Application 2019 & 2032
- Table 47: France Pet Insurance Industry Revenue (Million) Forecast, by Application 2019 & 2032
- Table 48: France Pet Insurance Industry Volume (K Unit) Forecast, by Application 2019 & 2032
- Table 49: Italy Pet Insurance Industry Revenue (Million) Forecast, by Application 2019 & 2032
- Table 50: Italy Pet Insurance Industry Volume (K Unit) Forecast, by Application 2019 & 2032
- Table 51: Spain Pet Insurance Industry Revenue (Million) Forecast, by Application 2019 & 2032
- Table 52: Spain Pet Insurance Industry Volume (K Unit) Forecast, by Application 2019 & 2032
- Table 53: Rest of Europe Pet Insurance Industry Revenue (Million) Forecast, by Application 2019 & 2032
- Table 54: Rest of Europe Pet Insurance Industry Volume (K Unit) Forecast, by Application 2019 & 2032
- Table 55: Global Pet Insurance Industry Revenue Million Forecast, by Policy 2019 & 2032
- Table 56: Global Pet Insurance Industry Volume K Unit Forecast, by Policy 2019 & 2032
- Table 57: Global Pet Insurance Industry Revenue Million Forecast, by Animal 2019 & 2032
- Table 58: Global Pet Insurance Industry Volume K Unit Forecast, by Animal 2019 & 2032
- Table 59: Global Pet Insurance Industry Revenue Million Forecast, by Provider 2019 & 2032
- Table 60: Global Pet Insurance Industry Volume K Unit Forecast, by Provider 2019 & 2032
- Table 61: Global Pet Insurance Industry Revenue Million Forecast, by Country 2019 & 2032
- Table 62: Global Pet Insurance Industry Volume K Unit Forecast, by Country 2019 & 2032
- Table 63: China Pet Insurance Industry Revenue (Million) Forecast, by Application 2019 & 2032
- Table 64: China Pet Insurance Industry Volume (K Unit) Forecast, by Application 2019 & 2032
- Table 65: Japan Pet Insurance Industry Revenue (Million) Forecast, by Application 2019 & 2032
- Table 66: Japan Pet Insurance Industry Volume (K Unit) Forecast, by Application 2019 & 2032
- Table 67: India Pet Insurance Industry Revenue (Million) Forecast, by Application 2019 & 2032
- Table 68: India Pet Insurance Industry Volume (K Unit) Forecast, by Application 2019 & 2032
- Table 69: Australia Pet Insurance Industry Revenue (Million) Forecast, by Application 2019 & 2032
- Table 70: Australia Pet Insurance Industry Volume (K Unit) Forecast, by Application 2019 & 2032
- Table 71: South Korea Pet Insurance Industry Revenue (Million) Forecast, by Application 2019 & 2032
- Table 72: South Korea Pet Insurance Industry Volume (K Unit) Forecast, by Application 2019 & 2032
- Table 73: Rest of Asia Pacific Pet Insurance Industry Revenue (Million) Forecast, by Application 2019 & 2032
- Table 74: Rest of Asia Pacific Pet Insurance Industry Volume (K Unit) Forecast, by Application 2019 & 2032
- Table 75: Global Pet Insurance Industry Revenue Million Forecast, by Policy 2019 & 2032
- Table 76: Global Pet Insurance Industry Volume K Unit Forecast, by Policy 2019 & 2032
- Table 77: Global Pet Insurance Industry Revenue Million Forecast, by Animal 2019 & 2032
- Table 78: Global Pet Insurance Industry Volume K Unit Forecast, by Animal 2019 & 2032
- Table 79: Global Pet Insurance Industry Revenue Million Forecast, by Provider 2019 & 2032
- Table 80: Global Pet Insurance Industry Volume K Unit Forecast, by Provider 2019 & 2032
- Table 81: Global Pet Insurance Industry Revenue Million Forecast, by Country 2019 & 2032
- Table 82: Global Pet Insurance Industry Volume K Unit Forecast, by Country 2019 & 2032
- Table 83: GCC Pet Insurance Industry Revenue (Million) Forecast, by Application 2019 & 2032
- Table 84: GCC Pet Insurance Industry Volume (K Unit) Forecast, by Application 2019 & 2032
- Table 85: South Africa Pet Insurance Industry Revenue (Million) Forecast, by Application 2019 & 2032
- Table 86: South Africa Pet Insurance Industry Volume (K Unit) Forecast, by Application 2019 & 2032
- Table 87: Rest of Middle East and Africa Pet Insurance Industry Revenue (Million) Forecast, by Application 2019 & 2032
- Table 88: Rest of Middle East and Africa Pet Insurance Industry Volume (K Unit) Forecast, by Application 2019 & 2032
- Table 89: Global Pet Insurance Industry Revenue Million Forecast, by Policy 2019 & 2032
- Table 90: Global Pet Insurance Industry Volume K Unit Forecast, by Policy 2019 & 2032
- Table 91: Global Pet Insurance Industry Revenue Million Forecast, by Animal 2019 & 2032
- Table 92: Global Pet Insurance Industry Volume K Unit Forecast, by Animal 2019 & 2032
- Table 93: Global Pet Insurance Industry Revenue Million Forecast, by Provider 2019 & 2032
- Table 94: Global Pet Insurance Industry Volume K Unit Forecast, by Provider 2019 & 2032
- Table 95: Global Pet Insurance Industry Revenue Million Forecast, by Country 2019 & 2032
- Table 96: Global Pet Insurance Industry Volume K Unit Forecast, by Country 2019 & 2032
- Table 97: Brazil Pet Insurance Industry Revenue (Million) Forecast, by Application 2019 & 2032
- Table 98: Brazil Pet Insurance Industry Volume (K Unit) Forecast, by Application 2019 & 2032
- Table 99: Argentina Pet Insurance Industry Revenue (Million) Forecast, by Application 2019 & 2032
- Table 100: Argentina Pet Insurance Industry Volume (K Unit) Forecast, by Application 2019 & 2032
- Table 101: Rest of South America Pet Insurance Industry Revenue (Million) Forecast, by Application 2019 & 2032
- Table 102: Rest of South America Pet Insurance Industry Volume (K Unit) Forecast, by Application 2019 & 2032
Frequently Asked Questions
1. What is the projected Compound Annual Growth Rate (CAGR) of the Pet Insurance Industry?
The projected CAGR is approximately 12.43%.
2. Which companies are prominent players in the Pet Insurance Industry?
Key companies in the market include Anicom Holdings Inc, Hartville Group, Embrace Pet Insurance Agency LLC, Healthy Paws Pet Insurance LLC, The Oriental Insurance Company Ltd, Petplan, Oneplan, Figo Pet Insurance LLC, Medibank Private Limited, Dotsure co za, Metlife Services and Solutions LLC (Petfirst Healthcare LLC).
3. What are the main segments of the Pet Insurance Industry?
The market segments include Policy, Animal, Provider.
4. Can you provide details about the market size?
The market size is estimated to be USD 10.76 Million as of 2022.
5. What are some drivers contributing to market growth?
Increasing Number of Pet Adoption; Rising Awareness Regarding Pet Insurance.
6. What are the notable trends driving market growth?
The Dogs Segment is Expected to Show Lucrative Growth Opportunities in the Pet Insurance Market.
7. Are there any restraints impacting market growth?
Lack of Standardized Pet Health Codes for Reimbursement; Low Adoption in Emerging Countries.
8. Can you provide examples of recent developments in the market?
July 2022 : JAB Holdings agreed to acquire the German pet insurance provider Agila from Wertgarantie Group, continuing its breakneck expansion into the global pet insurance market.
9. What pricing options are available for accessing the report?
Pricing options include single-user, multi-user, and enterprise licenses priced at USD 4750, USD 5250, and USD 8750 respectively.
10. Is the market size provided in terms of value or volume?
The market size is provided in terms of value, measured in Million and volume, measured in K Unit.
11. Are there any specific market keywords associated with the report?
Yes, the market keyword associated with the report is "Pet Insurance Industry," which aids in identifying and referencing the specific market segment covered.
12. How do I determine which pricing option suits my needs best?
The pricing options vary based on user requirements and access needs. Individual users may opt for single-user licenses, while businesses requiring broader access may choose multi-user or enterprise licenses for cost-effective access to the report.
13. Are there any additional resources or data provided in the Pet Insurance Industry report?
While the report offers comprehensive insights, it's advisable to review the specific contents or supplementary materials provided to ascertain if additional resources or data are available.
14. How can I stay updated on further developments or reports in the Pet Insurance Industry?
To stay informed about further developments, trends, and reports in the Pet Insurance Industry, consider subscribing to industry newsletters, following relevant companies and organizations, or regularly checking reputable industry news sources and publications.
Methodology
Step 1 - Identification of Relevant Samples Size from Population Database


Step 2 - Approaches for Defining Global Market Size (Value, Volume* & Price*)

Note*: In applicable scenarios
Step 3 - Data Sources
Primary Research
- Web Analytics
- Survey Reports
- Research Institute
- Latest Research Reports
- Opinion Leaders
Secondary Research
- Annual Reports
- White Paper
- Latest Press Release
- Industry Association
- Paid Database
- Investor Presentations

Step 4 - Data Triangulation
Involves using different sources of information in order to increase the validity of a study
These sources are likely to be stakeholders in a program - participants, other researchers, program staff, other community members, and so on.
Then we put all data in single framework & apply various statistical tools to find out the dynamic on the market.
During the analysis stage, feedback from the stakeholder groups would be compared to determine areas of agreement as well as areas of divergence


