
Key Insights
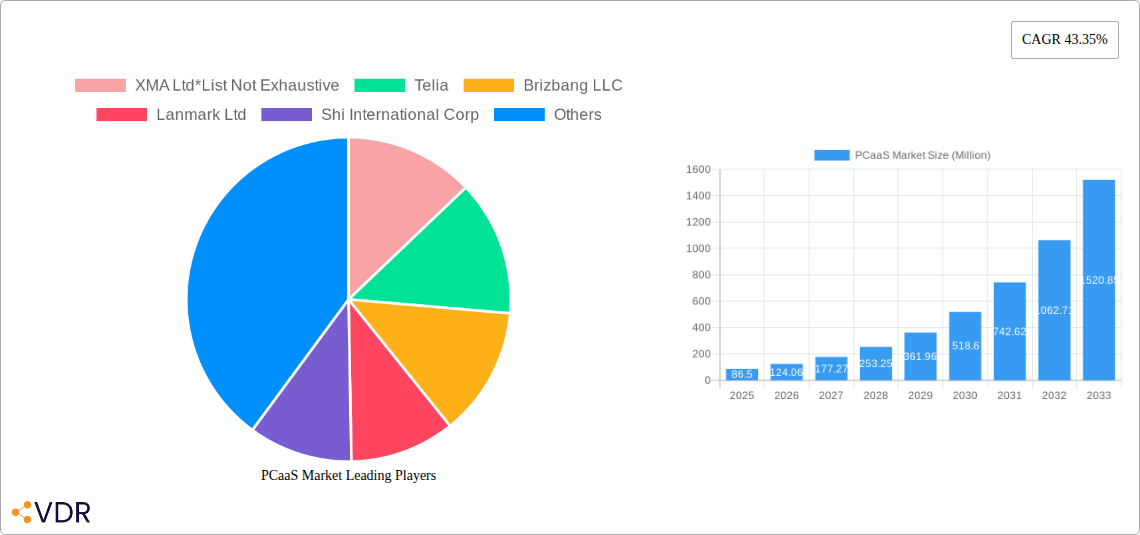
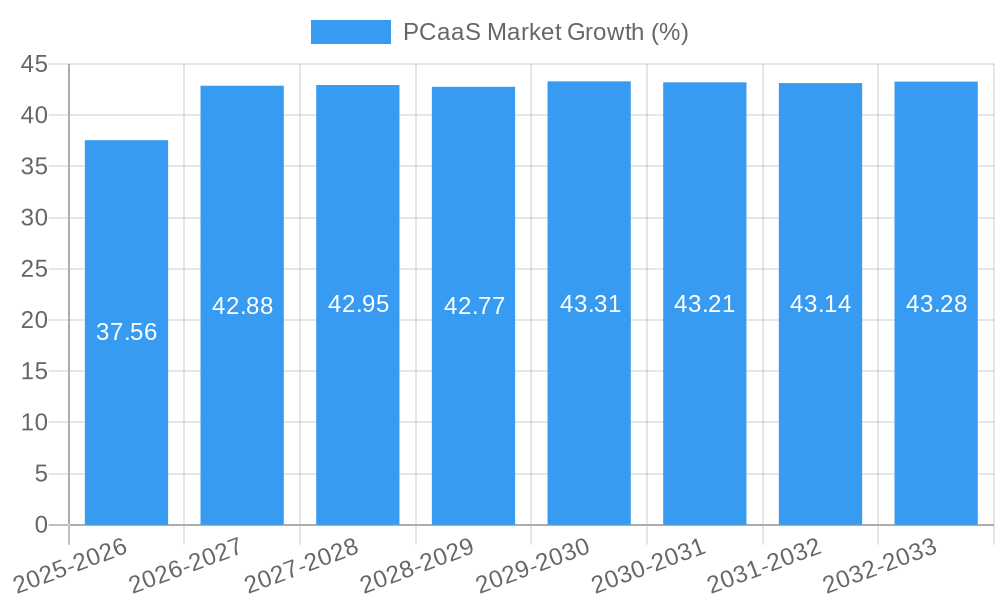
The PCaaS (Personal Computer as a Service) market is experiencing robust growth, projected to reach $86.50 million in 2025 and exhibiting a remarkable Compound Annual Growth Rate (CAGR) of 43.35%. This surge is driven by several key factors. Firstly, the increasing adoption of cloud-based solutions and the shift towards subscription-based models offer businesses significant cost savings and improved operational efficiency. Secondly, the enhanced security features and streamlined IT management provided by PCaaS platforms are highly attractive to organizations, particularly in sensitive sectors like BFSI (Banking, Financial Services, and Insurance) and Healthcare. Furthermore, the growing demand for flexible and scalable IT infrastructure, particularly among Small and Medium-scale Organizations (SMEs), fuels this market expansion. The Hardware segment currently dominates the market, but the Software and Services components are experiencing faster growth, reflecting the increasing importance of integrated software solutions and managed services within PCaaS offerings.
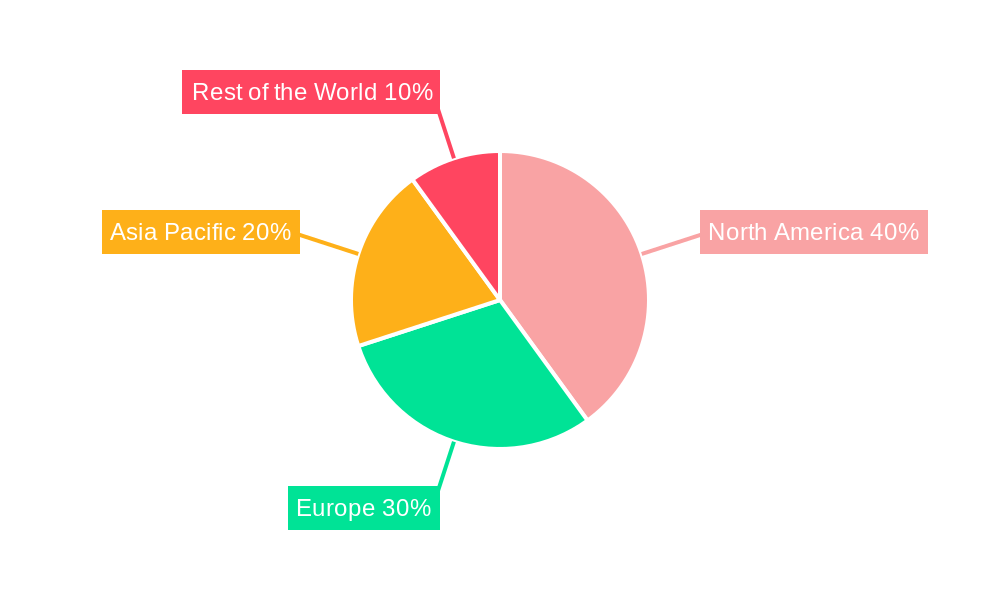
The market's segmentation reveals significant opportunities across various end-user industries. BFSI, Healthcare, and IT & Telecom are leading adopters, driven by the need for secure and reliable computing infrastructure. However, significant potential exists in expanding PCaaS penetration within the Government and Defense, and Education sectors. Geographically, North America currently holds a substantial market share, but the Asia Pacific region is anticipated to experience the most rapid growth over the forecast period (2025-2033), fueled by increasing digitalization and technological advancements. Competitive landscape analysis indicates a mix of established players like HP Inc., Dell Technologies, and Lenovo Group Ltd., alongside emerging specialized PCaaS providers. This competitive landscape suggests ongoing innovation and potential for market consolidation in the coming years. Sustained growth depends on continued technological advancements, expanding awareness of PCaaS benefits, and overcoming potential restraints such as initial investment costs and concerns regarding data security.
PCaaS Market Report: A Comprehensive Analysis (2019-2033)
This comprehensive report delivers an in-depth analysis of the PCaaS (Personal Computer as a Service) market, encompassing its current state, future trajectory, and key players. We examine market dynamics, growth trends, regional dominance, and emerging opportunities across various segments, providing crucial insights for industry professionals, investors, and strategic decision-makers. The study period spans from 2019 to 2033, with 2025 serving as the base and estimated year.
PCaaS Market Dynamics & Structure
The PCaaS market is characterized by a moderately consolidated structure, with key players vying for market share through strategic partnerships, acquisitions, and product innovation. The market size in 2025 is estimated at xx Million units. Technological advancements, particularly in cloud computing and virtualization, are major drivers of growth. However, regulatory hurdles concerning data security and privacy, as well as the competitive landscape with traditional PC sales models, pose significant challenges. The increasing adoption of SaaS applications and the demand for flexible IT solutions are key market drivers.
- Market Concentration: The top 5 players hold an estimated xx% market share in 2025.
- Technological Innovation: Cloud-based solutions and AI-powered management tools are driving innovation. Barriers include high initial investment costs and integration complexities.
- Regulatory Framework: Data privacy regulations (e.g., GDPR) significantly influence market practices.
- Competitive Substitutes: Traditional PC sales and on-premise IT infrastructure present competition.
- End-User Demographics: Small and medium-sized businesses (SMBs) and large organizations are the primary end-users.
- M&A Trends: The number of M&A deals in the PCaaS market averaged xx per year between 2019 and 2024.
PCaaS Market Growth Trends & Insights
The PCaaS market exhibits robust growth, driven by the increasing demand for flexible and cost-effective IT solutions. The market size is projected to reach xx Million units by 2033, registering a CAGR of xx% during the forecast period (2025-2033). This growth is fueled by the rising adoption of cloud-based services, the increasing preference for subscription models, and the growing need for streamlined IT management. Technological disruptions, such as the advancements in 5G and edge computing, are further accelerating market expansion. Consumer behavior is shifting towards pay-as-you-go models, aligning with the PCaaS subscription model.
Dominant Regions, Countries, or Segments in PCaaS Market
North America currently holds the largest market share in the PCaaS market, followed by Europe and Asia Pacific. Within segments, the Services segment is the fastest-growing, driven by the increasing demand for managed IT services. Large organizations constitute a significant segment due to their higher IT budgets and complex IT requirements. The BFSI sector is a major end-user, driven by the need for secure and reliable IT infrastructure.
- Leading Region: North America
- Fastest-growing Segment (By Type): Services
- Largest Segment (By Deployment Type): Large Organizations
- Major End-user Industry: BFSI
- Key Drivers: Strong economic growth in developed nations, increased government investment in IT infrastructure, and rising adoption of cloud-based services.
PCaaS Market Product Landscape
PCaaS offerings are becoming increasingly sophisticated, integrating advanced features such as enhanced security protocols, streamlined device management tools, and seamless integration with cloud-based applications. The focus is on delivering user-friendly interfaces and flexible subscription plans tailored to specific business needs. Key advancements include AI-powered predictive maintenance and automated patching capabilities.
Key Drivers, Barriers & Challenges in PCaaS Market
Key Drivers:
- Rising demand for flexible IT solutions.
- Increasing adoption of cloud-based services.
- Growing preference for subscription-based models.
- Advancements in virtualization and remote access technologies.
Challenges:
- High initial investment costs for service providers.
- Concerns over data security and privacy.
- Competition from traditional PC sales models.
- Complex integration with existing IT infrastructure. These challenges account for an estimated xx% reduction in market growth potential.
Emerging Opportunities in PCaaS Market
The PCaaS market offers significant growth opportunities in emerging economies, particularly in Asia-Pacific. Furthermore, expanding into new vertical markets, such as education and healthcare, presents untapped potential. The development of specialized PCaaS solutions for specific industries can cater to unique business needs and drive further market expansion.
Growth Accelerators in the PCaaS Market Industry
Strategic partnerships between PCaaS providers and cloud service providers can unlock significant growth opportunities. Furthermore, technological advancements in areas such as artificial intelligence (AI) and machine learning (ML) can optimize service delivery and enhance customer experience. The expansion into new geographical markets and the development of value-added services will further propel market growth.
Key Players Shaping the PCaaS Market Market
- XMA Ltd *List Not Exhaustive
- Telia
- Brizbang LLC
- Lanmark Ltd
- Shi International Corp
- HP Inc
- Compucom Systems Inc (Office Depot Inc)
- Utopia Software LLC
- Symetri
- Lenovo Group Ltd
- Intel Corporation
- Dell Technologies
Notable Milestones in PCaaS Market Sector
- March 2022: Apple launched Apple Business Essentials, targeting US small businesses with a bundled service including iCloud, support, and device management. This significantly expands the reach of PCaaS into the SMB sector.
- January 2022: HP introduced its Subscription Management Service for SMBs, enhancing its digital services portfolio and improving IT adaptability. This reflects the growing focus on subscription-based IT solutions.
In-Depth PCaaS Market Market Outlook
The PCaaS market is poised for continued strong growth, driven by ongoing technological advancements, increasing demand for flexible IT solutions, and the expansion of the PCaaS model into new markets and industries. Strategic partnerships and investments in innovation will be key to capturing significant market share and driving long-term growth. The potential for expanding into underserved regions and developing specialized services offers substantial untapped market potential.
PCaaS Market Segmentation
-
1. Type
- 1.1. Hardware
- 1.2. Software
- 1.3. Services
-
2. Deployment Type
- 2.1. Small and Medium-scale Organizations
- 2.2. Large Organizations
-
3. End-user Industry
- 3.1. BFSI
- 3.2. Healthcare and Life Sciences
- 3.3. IT and Telecom
- 3.4. Government and Defense
- 3.5. Education
- 3.6. Other End-user Industries
PCaaS Market Segmentation By Geography
- 1. North America
- 2. Europe
- 3. Asia Pacific
- 4. Rest of the World
PCaaS Market REPORT HIGHLIGHTS
| Aspects | Details |
|---|---|
| Study Period | 2019-2033 |
| Base Year | 2024 |
| Estimated Year | 2025 |
| Forecast Period | 2025-2033 |
| Historical Period | 2019-2024 |
| Growth Rate | CAGR of 43.35% from 2019-2033 |
| Segmentation |
|
Table of Contents
- 1. Introduction
- 1.1. Research Scope
- 1.2. Market Segmentation
- 1.3. Research Methodology
- 1.4. Definitions and Assumptions
- 2. Executive Summary
- 2.1. Introduction
- 3. Market Dynamics
- 3.1. Introduction
- 3.2. Market Drivers
- 3.2.1. Increasing Demand from Small and Medium-scale Organizations Due to Cost Benefits; Renewed Focus on Managed Service Providers
- 3.3. Market Restrains
- 3.3.1. Lack of Product Differentiation
- 3.4. Market Trends
- 3.4.1. Small and Medium-scale Organizations is Expected to Register a Significant Growth
- 4. Market Factor Analysis
- 4.1. Porters Five Forces
- 4.2. Supply/Value Chain
- 4.3. PESTEL analysis
- 4.4. Market Entropy
- 4.5. Patent/Trademark Analysis
- 5. Global PCaaS Market Analysis, Insights and Forecast, 2019-2031
- 5.1. Market Analysis, Insights and Forecast - by Type
- 5.1.1. Hardware
- 5.1.2. Software
- 5.1.3. Services
- 5.2. Market Analysis, Insights and Forecast - by Deployment Type
- 5.2.1. Small and Medium-scale Organizations
- 5.2.2. Large Organizations
- 5.3. Market Analysis, Insights and Forecast - by End-user Industry
- 5.3.1. BFSI
- 5.3.2. Healthcare and Life Sciences
- 5.3.3. IT and Telecom
- 5.3.4. Government and Defense
- 5.3.5. Education
- 5.3.6. Other End-user Industries
- 5.4. Market Analysis, Insights and Forecast - by Region
- 5.4.1. North America
- 5.4.2. Europe
- 5.4.3. Asia Pacific
- 5.4.4. Rest of the World
- 5.1. Market Analysis, Insights and Forecast - by Type
- 6. North America PCaaS Market Analysis, Insights and Forecast, 2019-2031
- 6.1. Market Analysis, Insights and Forecast - by Type
- 6.1.1. Hardware
- 6.1.2. Software
- 6.1.3. Services
- 6.2. Market Analysis, Insights and Forecast - by Deployment Type
- 6.2.1. Small and Medium-scale Organizations
- 6.2.2. Large Organizations
- 6.3. Market Analysis, Insights and Forecast - by End-user Industry
- 6.3.1. BFSI
- 6.3.2. Healthcare and Life Sciences
- 6.3.3. IT and Telecom
- 6.3.4. Government and Defense
- 6.3.5. Education
- 6.3.6. Other End-user Industries
- 6.1. Market Analysis, Insights and Forecast - by Type
- 7. Europe PCaaS Market Analysis, Insights and Forecast, 2019-2031
- 7.1. Market Analysis, Insights and Forecast - by Type
- 7.1.1. Hardware
- 7.1.2. Software
- 7.1.3. Services
- 7.2. Market Analysis, Insights and Forecast - by Deployment Type
- 7.2.1. Small and Medium-scale Organizations
- 7.2.2. Large Organizations
- 7.3. Market Analysis, Insights and Forecast - by End-user Industry
- 7.3.1. BFSI
- 7.3.2. Healthcare and Life Sciences
- 7.3.3. IT and Telecom
- 7.3.4. Government and Defense
- 7.3.5. Education
- 7.3.6. Other End-user Industries
- 7.1. Market Analysis, Insights and Forecast - by Type
- 8. Asia Pacific PCaaS Market Analysis, Insights and Forecast, 2019-2031
- 8.1. Market Analysis, Insights and Forecast - by Type
- 8.1.1. Hardware
- 8.1.2. Software
- 8.1.3. Services
- 8.2. Market Analysis, Insights and Forecast - by Deployment Type
- 8.2.1. Small and Medium-scale Organizations
- 8.2.2. Large Organizations
- 8.3. Market Analysis, Insights and Forecast - by End-user Industry
- 8.3.1. BFSI
- 8.3.2. Healthcare and Life Sciences
- 8.3.3. IT and Telecom
- 8.3.4. Government and Defense
- 8.3.5. Education
- 8.3.6. Other End-user Industries
- 8.1. Market Analysis, Insights and Forecast - by Type
- 9. Rest of the World PCaaS Market Analysis, Insights and Forecast, 2019-2031
- 9.1. Market Analysis, Insights and Forecast - by Type
- 9.1.1. Hardware
- 9.1.2. Software
- 9.1.3. Services
- 9.2. Market Analysis, Insights and Forecast - by Deployment Type
- 9.2.1. Small and Medium-scale Organizations
- 9.2.2. Large Organizations
- 9.3. Market Analysis, Insights and Forecast - by End-user Industry
- 9.3.1. BFSI
- 9.3.2. Healthcare and Life Sciences
- 9.3.3. IT and Telecom
- 9.3.4. Government and Defense
- 9.3.5. Education
- 9.3.6. Other End-user Industries
- 9.1. Market Analysis, Insights and Forecast - by Type
- 10. North America PCaaS Market Analysis, Insights and Forecast, 2019-2031
- 10.1. Market Analysis, Insights and Forecast - By Country/Sub-region
- 10.1.1.
- 11. Europe PCaaS Market Analysis, Insights and Forecast, 2019-2031
- 11.1. Market Analysis, Insights and Forecast - By Country/Sub-region
- 11.1.1.
- 12. Asia Pacific PCaaS Market Analysis, Insights and Forecast, 2019-2031
- 12.1. Market Analysis, Insights and Forecast - By Country/Sub-region
- 12.1.1.
- 13. Rest of the World PCaaS Market Analysis, Insights and Forecast, 2019-2031
- 13.1. Market Analysis, Insights and Forecast - By Country/Sub-region
- 13.1.1.
- 14. Competitive Analysis
- 14.1. Global Market Share Analysis 2024
- 14.2. Company Profiles
- 14.2.1 XMA Ltd*List Not Exhaustive
- 14.2.1.1. Overview
- 14.2.1.2. Products
- 14.2.1.3. SWOT Analysis
- 14.2.1.4. Recent Developments
- 14.2.1.5. Financials (Based on Availability)
- 14.2.2 Telia
- 14.2.2.1. Overview
- 14.2.2.2. Products
- 14.2.2.3. SWOT Analysis
- 14.2.2.4. Recent Developments
- 14.2.2.5. Financials (Based on Availability)
- 14.2.3 Brizbang LLC
- 14.2.3.1. Overview
- 14.2.3.2. Products
- 14.2.3.3. SWOT Analysis
- 14.2.3.4. Recent Developments
- 14.2.3.5. Financials (Based on Availability)
- 14.2.4 Lanmark Ltd
- 14.2.4.1. Overview
- 14.2.4.2. Products
- 14.2.4.3. SWOT Analysis
- 14.2.4.4. Recent Developments
- 14.2.4.5. Financials (Based on Availability)
- 14.2.5 Shi International Corp
- 14.2.5.1. Overview
- 14.2.5.2. Products
- 14.2.5.3. SWOT Analysis
- 14.2.5.4. Recent Developments
- 14.2.5.5. Financials (Based on Availability)
- 14.2.6 HP Inc
- 14.2.6.1. Overview
- 14.2.6.2. Products
- 14.2.6.3. SWOT Analysis
- 14.2.6.4. Recent Developments
- 14.2.6.5. Financials (Based on Availability)
- 14.2.7 Compucom Systems Inc (Office Depot Inc )
- 14.2.7.1. Overview
- 14.2.7.2. Products
- 14.2.7.3. SWOT Analysis
- 14.2.7.4. Recent Developments
- 14.2.7.5. Financials (Based on Availability)
- 14.2.8 Utopia Software LLC
- 14.2.8.1. Overview
- 14.2.8.2. Products
- 14.2.8.3. SWOT Analysis
- 14.2.8.4. Recent Developments
- 14.2.8.5. Financials (Based on Availability)
- 14.2.9 Symetri
- 14.2.9.1. Overview
- 14.2.9.2. Products
- 14.2.9.3. SWOT Analysis
- 14.2.9.4. Recent Developments
- 14.2.9.5. Financials (Based on Availability)
- 14.2.10 Lenovo Group Ltd
- 14.2.10.1. Overview
- 14.2.10.2. Products
- 14.2.10.3. SWOT Analysis
- 14.2.10.4. Recent Developments
- 14.2.10.5. Financials (Based on Availability)
- 14.2.11 Intel Corporation
- 14.2.11.1. Overview
- 14.2.11.2. Products
- 14.2.11.3. SWOT Analysis
- 14.2.11.4. Recent Developments
- 14.2.11.5. Financials (Based on Availability)
- 14.2.12 Dell Technologies
- 14.2.12.1. Overview
- 14.2.12.2. Products
- 14.2.12.3. SWOT Analysis
- 14.2.12.4. Recent Developments
- 14.2.12.5. Financials (Based on Availability)
- 14.2.1 XMA Ltd*List Not Exhaustive
List of Figures
- Figure 1: Global PCaaS Market Revenue Breakdown (Million, %) by Region 2024 & 2032
- Figure 2: North America PCaaS Market Revenue (Million), by Country 2024 & 2032
- Figure 3: North America PCaaS Market Revenue Share (%), by Country 2024 & 2032
- Figure 4: Europe PCaaS Market Revenue (Million), by Country 2024 & 2032
- Figure 5: Europe PCaaS Market Revenue Share (%), by Country 2024 & 2032
- Figure 6: Asia Pacific PCaaS Market Revenue (Million), by Country 2024 & 2032
- Figure 7: Asia Pacific PCaaS Market Revenue Share (%), by Country 2024 & 2032
- Figure 8: Rest of the World PCaaS Market Revenue (Million), by Country 2024 & 2032
- Figure 9: Rest of the World PCaaS Market Revenue Share (%), by Country 2024 & 2032
- Figure 10: North America PCaaS Market Revenue (Million), by Type 2024 & 2032
- Figure 11: North America PCaaS Market Revenue Share (%), by Type 2024 & 2032
- Figure 12: North America PCaaS Market Revenue (Million), by Deployment Type 2024 & 2032
- Figure 13: North America PCaaS Market Revenue Share (%), by Deployment Type 2024 & 2032
- Figure 14: North America PCaaS Market Revenue (Million), by End-user Industry 2024 & 2032
- Figure 15: North America PCaaS Market Revenue Share (%), by End-user Industry 2024 & 2032
- Figure 16: North America PCaaS Market Revenue (Million), by Country 2024 & 2032
- Figure 17: North America PCaaS Market Revenue Share (%), by Country 2024 & 2032
- Figure 18: Europe PCaaS Market Revenue (Million), by Type 2024 & 2032
- Figure 19: Europe PCaaS Market Revenue Share (%), by Type 2024 & 2032
- Figure 20: Europe PCaaS Market Revenue (Million), by Deployment Type 2024 & 2032
- Figure 21: Europe PCaaS Market Revenue Share (%), by Deployment Type 2024 & 2032
- Figure 22: Europe PCaaS Market Revenue (Million), by End-user Industry 2024 & 2032
- Figure 23: Europe PCaaS Market Revenue Share (%), by End-user Industry 2024 & 2032
- Figure 24: Europe PCaaS Market Revenue (Million), by Country 2024 & 2032
- Figure 25: Europe PCaaS Market Revenue Share (%), by Country 2024 & 2032
- Figure 26: Asia Pacific PCaaS Market Revenue (Million), by Type 2024 & 2032
- Figure 27: Asia Pacific PCaaS Market Revenue Share (%), by Type 2024 & 2032
- Figure 28: Asia Pacific PCaaS Market Revenue (Million), by Deployment Type 2024 & 2032
- Figure 29: Asia Pacific PCaaS Market Revenue Share (%), by Deployment Type 2024 & 2032
- Figure 30: Asia Pacific PCaaS Market Revenue (Million), by End-user Industry 2024 & 2032
- Figure 31: Asia Pacific PCaaS Market Revenue Share (%), by End-user Industry 2024 & 2032
- Figure 32: Asia Pacific PCaaS Market Revenue (Million), by Country 2024 & 2032
- Figure 33: Asia Pacific PCaaS Market Revenue Share (%), by Country 2024 & 2032
- Figure 34: Rest of the World PCaaS Market Revenue (Million), by Type 2024 & 2032
- Figure 35: Rest of the World PCaaS Market Revenue Share (%), by Type 2024 & 2032
- Figure 36: Rest of the World PCaaS Market Revenue (Million), by Deployment Type 2024 & 2032
- Figure 37: Rest of the World PCaaS Market Revenue Share (%), by Deployment Type 2024 & 2032
- Figure 38: Rest of the World PCaaS Market Revenue (Million), by End-user Industry 2024 & 2032
- Figure 39: Rest of the World PCaaS Market Revenue Share (%), by End-user Industry 2024 & 2032
- Figure 40: Rest of the World PCaaS Market Revenue (Million), by Country 2024 & 2032
- Figure 41: Rest of the World PCaaS Market Revenue Share (%), by Country 2024 & 2032
List of Tables
- Table 1: Global PCaaS Market Revenue Million Forecast, by Region 2019 & 2032
- Table 2: Global PCaaS Market Revenue Million Forecast, by Type 2019 & 2032
- Table 3: Global PCaaS Market Revenue Million Forecast, by Deployment Type 2019 & 2032
- Table 4: Global PCaaS Market Revenue Million Forecast, by End-user Industry 2019 & 2032
- Table 5: Global PCaaS Market Revenue Million Forecast, by Region 2019 & 2032
- Table 6: Global PCaaS Market Revenue Million Forecast, by Country 2019 & 2032
- Table 7: PCaaS Market Revenue (Million) Forecast, by Application 2019 & 2032
- Table 8: Global PCaaS Market Revenue Million Forecast, by Country 2019 & 2032
- Table 9: PCaaS Market Revenue (Million) Forecast, by Application 2019 & 2032
- Table 10: Global PCaaS Market Revenue Million Forecast, by Country 2019 & 2032
- Table 11: PCaaS Market Revenue (Million) Forecast, by Application 2019 & 2032
- Table 12: Global PCaaS Market Revenue Million Forecast, by Country 2019 & 2032
- Table 13: PCaaS Market Revenue (Million) Forecast, by Application 2019 & 2032
- Table 14: Global PCaaS Market Revenue Million Forecast, by Type 2019 & 2032
- Table 15: Global PCaaS Market Revenue Million Forecast, by Deployment Type 2019 & 2032
- Table 16: Global PCaaS Market Revenue Million Forecast, by End-user Industry 2019 & 2032
- Table 17: Global PCaaS Market Revenue Million Forecast, by Country 2019 & 2032
- Table 18: Global PCaaS Market Revenue Million Forecast, by Type 2019 & 2032
- Table 19: Global PCaaS Market Revenue Million Forecast, by Deployment Type 2019 & 2032
- Table 20: Global PCaaS Market Revenue Million Forecast, by End-user Industry 2019 & 2032
- Table 21: Global PCaaS Market Revenue Million Forecast, by Country 2019 & 2032
- Table 22: Global PCaaS Market Revenue Million Forecast, by Type 2019 & 2032
- Table 23: Global PCaaS Market Revenue Million Forecast, by Deployment Type 2019 & 2032
- Table 24: Global PCaaS Market Revenue Million Forecast, by End-user Industry 2019 & 2032
- Table 25: Global PCaaS Market Revenue Million Forecast, by Country 2019 & 2032
- Table 26: Global PCaaS Market Revenue Million Forecast, by Type 2019 & 2032
- Table 27: Global PCaaS Market Revenue Million Forecast, by Deployment Type 2019 & 2032
- Table 28: Global PCaaS Market Revenue Million Forecast, by End-user Industry 2019 & 2032
- Table 29: Global PCaaS Market Revenue Million Forecast, by Country 2019 & 2032
Frequently Asked Questions
1. What is the projected Compound Annual Growth Rate (CAGR) of the PCaaS Market?
The projected CAGR is approximately 43.35%.
2. Which companies are prominent players in the PCaaS Market?
Key companies in the market include XMA Ltd*List Not Exhaustive, Telia, Brizbang LLC, Lanmark Ltd, Shi International Corp, HP Inc, Compucom Systems Inc (Office Depot Inc ), Utopia Software LLC, Symetri, Lenovo Group Ltd, Intel Corporation, Dell Technologies.
3. What are the main segments of the PCaaS Market?
The market segments include Type, Deployment Type, End-user Industry.
4. Can you provide details about the market size?
The market size is estimated to be USD 86.50 Million as of 2022.
5. What are some drivers contributing to market growth?
Increasing Demand from Small and Medium-scale Organizations Due to Cost Benefits; Renewed Focus on Managed Service Providers.
6. What are the notable trends driving market growth?
Small and Medium-scale Organizations is Expected to Register a Significant Growth.
7. Are there any restraints impacting market growth?
Lack of Product Differentiation.
8. Can you provide examples of recent developments in the market?
March 2022: Apple stated that all US small businesses can now access Apple Business Essentials. The new service combines iCloud storage, 24/7 Apple support, and device management into customizable subscription options. AppleCare+ for Business Essentials choices that may be added to any plan were also revealed by Apple. All clients, including those using Apple Business Essentials in beta, will also have access to a two-month free trial.
9. What pricing options are available for accessing the report?
Pricing options include single-user, multi-user, and enterprise licenses priced at USD 4750, USD 5250, and USD 8750 respectively.
10. Is the market size provided in terms of value or volume?
The market size is provided in terms of value, measured in Million.
11. Are there any specific market keywords associated with the report?
Yes, the market keyword associated with the report is "PCaaS Market," which aids in identifying and referencing the specific market segment covered.
12. How do I determine which pricing option suits my needs best?
The pricing options vary based on user requirements and access needs. Individual users may opt for single-user licenses, while businesses requiring broader access may choose multi-user or enterprise licenses for cost-effective access to the report.
13. Are there any additional resources or data provided in the PCaaS Market report?
While the report offers comprehensive insights, it's advisable to review the specific contents or supplementary materials provided to ascertain if additional resources or data are available.
14. How can I stay updated on further developments or reports in the PCaaS Market?
To stay informed about further developments, trends, and reports in the PCaaS Market, consider subscribing to industry newsletters, following relevant companies and organizations, or regularly checking reputable industry news sources and publications.
Methodology
Step 1 - Identification of Relevant Samples Size from Population Database


Step 2 - Approaches for Defining Global Market Size (Value, Volume* & Price*)

Note*: In applicable scenarios
Step 3 - Data Sources
Primary Research
- Web Analytics
- Survey Reports
- Research Institute
- Latest Research Reports
- Opinion Leaders
Secondary Research
- Annual Reports
- White Paper
- Latest Press Release
- Industry Association
- Paid Database
- Investor Presentations

Step 4 - Data Triangulation
Involves using different sources of information in order to increase the validity of a study
These sources are likely to be stakeholders in a program - participants, other researchers, program staff, other community members, and so on.
Then we put all data in single framework & apply various statistical tools to find out the dynamic on the market.
During the analysis stage, feedback from the stakeholder groups would be compared to determine areas of agreement as well as areas of divergence


