
Key Insights
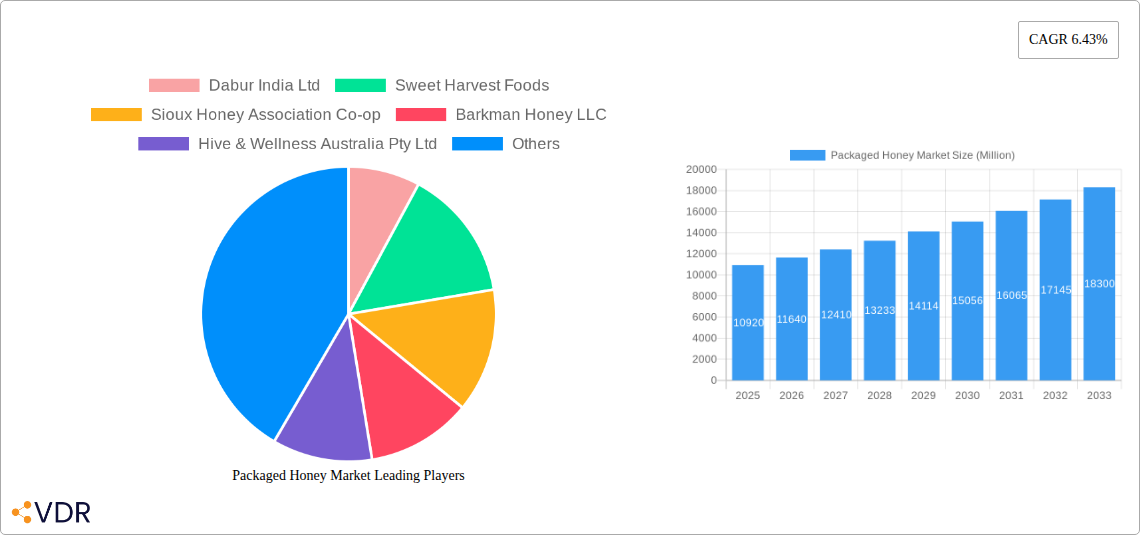
The global packaged honey market, valued at $10.92 billion in 2025, is projected to experience robust growth, driven by increasing consumer awareness of honey's health benefits and its versatile applications in food and beverages. The rising prevalence of health-conscious consumers seeking natural sweeteners and the growing demand for organic and sustainably sourced food products significantly fuel market expansion. Furthermore, the increasing adoption of convenient packaging formats, such as squeezable bottles, single-serve packets, and jars, caters to modern lifestyles and enhances product appeal. Key players like Dabur India Ltd, Patanjali Ayurved Limited, and McCormick & Company Inc. are strategically investing in product innovation, expanding distribution networks, and leveraging brand recognition to maintain a competitive edge. The market's growth trajectory is further supported by the rising popularity of honey-based functional foods and beverages, catering to specific health needs and preferences.
However, market growth faces some challenges. Fluctuations in honey production due to climatic changes and bee diseases can impact supply and price stability. Moreover, the presence of counterfeit honey products in the market and increasing competition from artificial sweeteners pose significant threats. To mitigate these challenges, manufacturers are focusing on quality control measures, traceability initiatives, and building consumer trust through transparent labeling and sustainable sourcing practices. The projected Compound Annual Growth Rate (CAGR) of 6.43% from 2025 to 2033 suggests a considerable expansion, reaching an estimated value exceeding $18 billion by 2033. This growth will be further influenced by regional variations in consumption patterns, with North America and Europe expected to remain dominant markets, while emerging economies in Asia and Latin America offer significant growth potential.
Packaged Honey Market: A Comprehensive Report (2019-2033)
This in-depth report provides a comprehensive analysis of the Packaged Honey Market, encompassing market dynamics, growth trends, regional performance, product landscape, and key players. With a study period spanning 2019-2033, a base year of 2025, and a forecast period of 2025-2033, this report is an invaluable resource for industry professionals, investors, and anyone seeking a deep understanding of this dynamic market. The report analyzes the parent market of Honey and its child market, Packaged Honey, providing a nuanced view of the industry's evolution and future trajectory. The total market size in 2025 is estimated at xx Million units.
Packaged Honey Market Dynamics & Structure
The Packaged Honey Market is characterized by a moderately concentrated structure, with several key players dominating various regional markets. Technological innovation, particularly in processing and packaging, plays a significant role in driving market growth. Stringent regulatory frameworks concerning food safety and labeling influence product development and marketing strategies. The market faces competition from alternative sweeteners, and consumer preferences are increasingly shifting towards organic and ethically sourced honey. Mergers and acquisitions (M&A) activity has been moderate, with strategic partnerships playing a crucial role in expanding market reach and product portfolios.
- Market Concentration: The top 5 players hold an estimated xx% market share in 2025.
- Technological Innovation: Focus on automation in processing, sustainable packaging solutions, and traceability technology.
- Regulatory Framework: Stringent food safety regulations and labeling requirements (e.g., USDA organic certification).
- Competitive Substitutes: Artificial sweeteners, agave nectar, and maple syrup pose a significant threat.
- End-User Demographics: Growing demand from health-conscious consumers and expanding applications in food and beverage industries.
- M&A Trends: A total of xx M&A deals were recorded between 2019 and 2024, mainly focused on consolidation and geographical expansion.
Packaged Honey Market Growth Trends & Insights
The Packaged Honey Market has witnessed significant growth over the historical period (2019-2024), with a CAGR of xx%. This growth is primarily driven by rising consumer demand for natural sweeteners, increasing health consciousness, and the growing popularity of honey in various food and beverage applications. Technological advancements have facilitated the production of high-quality, consistently graded honey, leading to improved market penetration. Shifting consumer preferences towards organic and sustainably sourced products are driving premiumization within the market. Market penetration rate is estimated at xx% in 2025. The forecast period (2025-2033) is expected to show continued growth, albeit at a slightly moderated pace, with a projected CAGR of xx%, reaching an estimated xx Million units by 2033. This moderated growth reflects market maturity and increased competition. Further insights into consumer buying habits and emerging trends are crucial in fully realizing this potential.

Dominant Regions, Countries, or Segments in Packaged Honey Market
The North American region currently holds the largest market share in the packaged honey market, driven by high honey consumption rates, a well-established distribution network, and strong consumer preference for natural sweeteners. However, Asia-Pacific is projected to witness the fastest growth in the forecast period, fueled by increasing disposable incomes, urbanization, and a burgeoning demand for natural and health-conscious food products. Specific countries like India and China show promising growth potential due to their large populations and expanding middle class.
- North America: High per capita consumption, established distribution channels, strong consumer preference.
- Europe: Mature market with steady growth, driven by premiumization and organic honey demand.
- Asia-Pacific: Fastest-growing region, driven by increasing disposable incomes and health awareness.
- Key Drivers: Rising disposable incomes, increasing health awareness, expanding food and beverage applications.
Packaged Honey Market Product Landscape
The Packaged Honey Market offers a diverse range of products, including raw honey, filtered honey, creamed honey, and specialized honey blends infused with flavors or added ingredients. Technological advancements in processing and packaging allow for extended shelf life and convenient formats, enhancing consumer appeal. Unique selling propositions often center on sourcing (e.g., organic, local), quality (e.g., purity, flavor), and packaging innovations (e.g., single-serve sachets, convenient dispensing). The continuous evolution of new flavors and formats plays a key role in this market's dynamism.
Key Drivers, Barriers & Challenges in Packaged Honey Market
Key Drivers: Increased health consciousness among consumers, growing popularity of honey as a natural sweetener, diversification of honey products (e.g., flavored honey, honey sticks), and expanding applications in food and beverage sectors. Government support for beekeeping and honey production through subsidies or incentives is also a significant factor.
Challenges and Restraints: Fluctuations in honey production due to climate change and bee health issues, price volatility caused by global supply chain disruptions, and increasing competition from alternative sweeteners are key challenges. Stringent regulations related to food safety and labeling can add operational costs for producers.
Emerging Opportunities in Packaged Honey Market
Emerging opportunities lie in tapping into untapped markets (e.g., developing countries), developing innovative products (e.g., honey-based functional foods, skincare products), catering to specific dietary needs (e.g., vegan honey alternatives, honey for diabetics), and leveraging online sales channels. Personalization of honey products, through customized flavors or blends, offers a further avenue of expansion.
Growth Accelerators in the Packaged Honey Market Industry
Technological advancements in beekeeping and honey processing, strategic partnerships between honey producers and food and beverage companies, and market expansion into new geographical regions (particularly in emerging economies) are key growth catalysts. Emphasis on sustainable beekeeping practices and consumer education initiatives, highlighting the health benefits and versatility of honey, will further drive market expansion.
Key Players Shaping the Packaged Honey Market Market
- Dabur India Ltd
- Sweet Harvest Foods
- Sioux Honey Association Co-op
- Barkman Honey LLC
- Hive & Wellness Australia Pty Ltd
- Patanjali Ayurved Limited
- Bright Food Group co Ltd
- McCormick & Company Inc
- The J M Smucker Company
- Apis Group
- List Not Exhaustive
Notable Milestones in Packaged Honey Market Sector
- December 2023: Better Foodie launched their award-winning 'Vegan H*ney' in around 200 UK retailers, showcasing innovation in honey alternatives.
- January 2024: APIS Honey launched Apis Organic Honey, sourced from Kashmir, expanding the organic honey segment in India.
- January 2024: Dabur India Ltd invested INR 135 crore in expanding its manufacturing facility, signaling significant investment in the honey production sector.
In-Depth Packaged Honey Market Market Outlook
The Packaged Honey Market is poised for continued growth, driven by the factors outlined above. Strategic investments in technology, sustainable practices, and expanding market reach, coupled with ongoing innovation in product development and marketing, will be crucial for success in this dynamic sector. Companies that successfully adapt to evolving consumer preferences and address sustainability concerns are best positioned to capture significant market share in the years to come. The future of this market hinges on balancing production capacity, evolving consumer demand, and sustainable practices.
Packaged Honey Market Segmentation
-
1. Product Category
- 1.1. Conventional
- 1.2. Organic
-
2. Packaging Type
- 2.1. Pet Bottles
- 2.2. Glass Jars
- 2.3. Other Packaging Types
Packaged Honey Market Segmentation By Geography
-
1. North America
- 1.1. United States
- 1.2. Canada
- 1.3. Mexico
- 1.4. Rest of North America
-
2. Europe
- 2.1. Germany
- 2.2. France
- 2.3. Russia
- 2.4. Spain
- 2.5. United Kingdom
- 2.6. Italy
- 2.7. Rest of Europe
-
3. Asia Pacific
- 3.1. India
- 3.2. China
- 3.3. Japan
- 3.4. Australia
- 3.5. Rest of Asia pacific
-
4. South America
- 4.1. Brazil
- 4.2. Argentina
- 4.3. Rest of South America
-
5. Middle East and Africa
- 5.1. United Arab Emirates
- 5.2. South Africa
- 5.3. Rest of Middle East

Packaged Honey Market REPORT HIGHLIGHTS
| Aspects | Details |
|---|---|
| Study Period | 2019-2033 |
| Base Year | 2024 |
| Estimated Year | 2025 |
| Forecast Period | 2025-2033 |
| Historical Period | 2019-2024 |
| Growth Rate | CAGR of 6.43% from 2019-2033 |
| Segmentation |
|
Table of Contents
- 1. Introduction
- 1.1. Research Scope
- 1.2. Market Segmentation
- 1.3. Research Methodology
- 1.4. Definitions and Assumptions
- 2. Executive Summary
- 2.1. Introduction
- 3. Market Dynamics
- 3.1. Introduction
- 3.2. Market Drivers
- 3.2.1. Increasing Demand for Natural Sweeteners; Government Initiatives Boost Honey Production and Beekeeping
- 3.3. Market Restrains
- 3.3.1. Increasing Demand for Natural Sweeteners; Government Initiatives Boost Honey Production and Beekeeping
- 3.4. Market Trends
- 3.4.1. Conventional Honey Is Consumed Globally
- 4. Market Factor Analysis
- 4.1. Porters Five Forces
- 4.2. Supply/Value Chain
- 4.3. PESTEL analysis
- 4.4. Market Entropy
- 4.5. Patent/Trademark Analysis
- 5. Global Packaged Honey Market Analysis, Insights and Forecast, 2019-2031
- 5.1. Market Analysis, Insights and Forecast - by Product Category
- 5.1.1. Conventional
- 5.1.2. Organic
- 5.2. Market Analysis, Insights and Forecast - by Packaging Type
- 5.2.1. Pet Bottles
- 5.2.2. Glass Jars
- 5.2.3. Other Packaging Types
- 5.3. Market Analysis, Insights and Forecast - by Region
- 5.3.1. North America
- 5.3.2. Europe
- 5.3.3. Asia Pacific
- 5.3.4. South America
- 5.3.5. Middle East and Africa
- 5.1. Market Analysis, Insights and Forecast - by Product Category
- 6. North America Packaged Honey Market Analysis, Insights and Forecast, 2019-2031
- 6.1. Market Analysis, Insights and Forecast - by Product Category
- 6.1.1. Conventional
- 6.1.2. Organic
- 6.2. Market Analysis, Insights and Forecast - by Packaging Type
- 6.2.1. Pet Bottles
- 6.2.2. Glass Jars
- 6.2.3. Other Packaging Types
- 6.1. Market Analysis, Insights and Forecast - by Product Category
- 7. Europe Packaged Honey Market Analysis, Insights and Forecast, 2019-2031
- 7.1. Market Analysis, Insights and Forecast - by Product Category
- 7.1.1. Conventional
- 7.1.2. Organic
- 7.2. Market Analysis, Insights and Forecast - by Packaging Type
- 7.2.1. Pet Bottles
- 7.2.2. Glass Jars
- 7.2.3. Other Packaging Types
- 7.1. Market Analysis, Insights and Forecast - by Product Category
- 8. Asia Pacific Packaged Honey Market Analysis, Insights and Forecast, 2019-2031
- 8.1. Market Analysis, Insights and Forecast - by Product Category
- 8.1.1. Conventional
- 8.1.2. Organic
- 8.2. Market Analysis, Insights and Forecast - by Packaging Type
- 8.2.1. Pet Bottles
- 8.2.2. Glass Jars
- 8.2.3. Other Packaging Types
- 8.1. Market Analysis, Insights and Forecast - by Product Category
- 9. South America Packaged Honey Market Analysis, Insights and Forecast, 2019-2031
- 9.1. Market Analysis, Insights and Forecast - by Product Category
- 9.1.1. Conventional
- 9.1.2. Organic
- 9.2. Market Analysis, Insights and Forecast - by Packaging Type
- 9.2.1. Pet Bottles
- 9.2.2. Glass Jars
- 9.2.3. Other Packaging Types
- 9.1. Market Analysis, Insights and Forecast - by Product Category
- 10. Middle East and Africa Packaged Honey Market Analysis, Insights and Forecast, 2019-2031
- 10.1. Market Analysis, Insights and Forecast - by Product Category
- 10.1.1. Conventional
- 10.1.2. Organic
- 10.2. Market Analysis, Insights and Forecast - by Packaging Type
- 10.2.1. Pet Bottles
- 10.2.2. Glass Jars
- 10.2.3. Other Packaging Types
- 10.1. Market Analysis, Insights and Forecast - by Product Category
- 11. Competitive Analysis
- 11.1. Global Market Share Analysis 2024
- 11.2. Company Profiles
- 11.2.1 Dabur India Ltd
- 11.2.1.1. Overview
- 11.2.1.2. Products
- 11.2.1.3. SWOT Analysis
- 11.2.1.4. Recent Developments
- 11.2.1.5. Financials (Based on Availability)
- 11.2.2 Sweet Harvest Foods
- 11.2.2.1. Overview
- 11.2.2.2. Products
- 11.2.2.3. SWOT Analysis
- 11.2.2.4. Recent Developments
- 11.2.2.5. Financials (Based on Availability)
- 11.2.3 Sioux Honey Association Co-op
- 11.2.3.1. Overview
- 11.2.3.2. Products
- 11.2.3.3. SWOT Analysis
- 11.2.3.4. Recent Developments
- 11.2.3.5. Financials (Based on Availability)
- 11.2.4 Barkman Honey LLC
- 11.2.4.1. Overview
- 11.2.4.2. Products
- 11.2.4.3. SWOT Analysis
- 11.2.4.4. Recent Developments
- 11.2.4.5. Financials (Based on Availability)
- 11.2.5 Hive & Wellness Australia Pty Ltd
- 11.2.5.1. Overview
- 11.2.5.2. Products
- 11.2.5.3. SWOT Analysis
- 11.2.5.4. Recent Developments
- 11.2.5.5. Financials (Based on Availability)
- 11.2.6 Patanjali Ayurved Limited
- 11.2.6.1. Overview
- 11.2.6.2. Products
- 11.2.6.3. SWOT Analysis
- 11.2.6.4. Recent Developments
- 11.2.6.5. Financials (Based on Availability)
- 11.2.7 Bright Food Group co Ltd
- 11.2.7.1. Overview
- 11.2.7.2. Products
- 11.2.7.3. SWOT Analysis
- 11.2.7.4. Recent Developments
- 11.2.7.5. Financials (Based on Availability)
- 11.2.8 Mccormick & Company Inc
- 11.2.8.1. Overview
- 11.2.8.2. Products
- 11.2.8.3. SWOT Analysis
- 11.2.8.4. Recent Developments
- 11.2.8.5. Financials (Based on Availability)
- 11.2.9 The J M Smucker Company
- 11.2.9.1. Overview
- 11.2.9.2. Products
- 11.2.9.3. SWOT Analysis
- 11.2.9.4. Recent Developments
- 11.2.9.5. Financials (Based on Availability)
- 11.2.10 Apis Group*List Not Exhaustive
- 11.2.10.1. Overview
- 11.2.10.2. Products
- 11.2.10.3. SWOT Analysis
- 11.2.10.4. Recent Developments
- 11.2.10.5. Financials (Based on Availability)
- 11.2.1 Dabur India Ltd
List of Figures
- Figure 1: Global Packaged Honey Market Revenue Breakdown (Million, %) by Region 2024 & 2032
- Figure 2: Global Packaged Honey Market Volume Breakdown (Billion, %) by Region 2024 & 2032
- Figure 3: North America Packaged Honey Market Revenue (Million), by Product Category 2024 & 2032
- Figure 4: North America Packaged Honey Market Volume (Billion), by Product Category 2024 & 2032
- Figure 5: North America Packaged Honey Market Revenue Share (%), by Product Category 2024 & 2032
- Figure 6: North America Packaged Honey Market Volume Share (%), by Product Category 2024 & 2032
- Figure 7: North America Packaged Honey Market Revenue (Million), by Packaging Type 2024 & 2032
- Figure 8: North America Packaged Honey Market Volume (Billion), by Packaging Type 2024 & 2032
- Figure 9: North America Packaged Honey Market Revenue Share (%), by Packaging Type 2024 & 2032
- Figure 10: North America Packaged Honey Market Volume Share (%), by Packaging Type 2024 & 2032
- Figure 11: North America Packaged Honey Market Revenue (Million), by Country 2024 & 2032
- Figure 12: North America Packaged Honey Market Volume (Billion), by Country 2024 & 2032
- Figure 13: North America Packaged Honey Market Revenue Share (%), by Country 2024 & 2032
- Figure 14: North America Packaged Honey Market Volume Share (%), by Country 2024 & 2032
- Figure 15: Europe Packaged Honey Market Revenue (Million), by Product Category 2024 & 2032
- Figure 16: Europe Packaged Honey Market Volume (Billion), by Product Category 2024 & 2032
- Figure 17: Europe Packaged Honey Market Revenue Share (%), by Product Category 2024 & 2032
- Figure 18: Europe Packaged Honey Market Volume Share (%), by Product Category 2024 & 2032
- Figure 19: Europe Packaged Honey Market Revenue (Million), by Packaging Type 2024 & 2032
- Figure 20: Europe Packaged Honey Market Volume (Billion), by Packaging Type 2024 & 2032
- Figure 21: Europe Packaged Honey Market Revenue Share (%), by Packaging Type 2024 & 2032
- Figure 22: Europe Packaged Honey Market Volume Share (%), by Packaging Type 2024 & 2032
- Figure 23: Europe Packaged Honey Market Revenue (Million), by Country 2024 & 2032
- Figure 24: Europe Packaged Honey Market Volume (Billion), by Country 2024 & 2032
- Figure 25: Europe Packaged Honey Market Revenue Share (%), by Country 2024 & 2032
- Figure 26: Europe Packaged Honey Market Volume Share (%), by Country 2024 & 2032
- Figure 27: Asia Pacific Packaged Honey Market Revenue (Million), by Product Category 2024 & 2032
- Figure 28: Asia Pacific Packaged Honey Market Volume (Billion), by Product Category 2024 & 2032
- Figure 29: Asia Pacific Packaged Honey Market Revenue Share (%), by Product Category 2024 & 2032
- Figure 30: Asia Pacific Packaged Honey Market Volume Share (%), by Product Category 2024 & 2032
- Figure 31: Asia Pacific Packaged Honey Market Revenue (Million), by Packaging Type 2024 & 2032
- Figure 32: Asia Pacific Packaged Honey Market Volume (Billion), by Packaging Type 2024 & 2032
- Figure 33: Asia Pacific Packaged Honey Market Revenue Share (%), by Packaging Type 2024 & 2032
- Figure 34: Asia Pacific Packaged Honey Market Volume Share (%), by Packaging Type 2024 & 2032
- Figure 35: Asia Pacific Packaged Honey Market Revenue (Million), by Country 2024 & 2032
- Figure 36: Asia Pacific Packaged Honey Market Volume (Billion), by Country 2024 & 2032
- Figure 37: Asia Pacific Packaged Honey Market Revenue Share (%), by Country 2024 & 2032
- Figure 38: Asia Pacific Packaged Honey Market Volume Share (%), by Country 2024 & 2032
- Figure 39: South America Packaged Honey Market Revenue (Million), by Product Category 2024 & 2032
- Figure 40: South America Packaged Honey Market Volume (Billion), by Product Category 2024 & 2032
- Figure 41: South America Packaged Honey Market Revenue Share (%), by Product Category 2024 & 2032
- Figure 42: South America Packaged Honey Market Volume Share (%), by Product Category 2024 & 2032
- Figure 43: South America Packaged Honey Market Revenue (Million), by Packaging Type 2024 & 2032
- Figure 44: South America Packaged Honey Market Volume (Billion), by Packaging Type 2024 & 2032
- Figure 45: South America Packaged Honey Market Revenue Share (%), by Packaging Type 2024 & 2032
- Figure 46: South America Packaged Honey Market Volume Share (%), by Packaging Type 2024 & 2032
- Figure 47: South America Packaged Honey Market Revenue (Million), by Country 2024 & 2032
- Figure 48: South America Packaged Honey Market Volume (Billion), by Country 2024 & 2032
- Figure 49: South America Packaged Honey Market Revenue Share (%), by Country 2024 & 2032
- Figure 50: South America Packaged Honey Market Volume Share (%), by Country 2024 & 2032
- Figure 51: Middle East and Africa Packaged Honey Market Revenue (Million), by Product Category 2024 & 2032
- Figure 52: Middle East and Africa Packaged Honey Market Volume (Billion), by Product Category 2024 & 2032
- Figure 53: Middle East and Africa Packaged Honey Market Revenue Share (%), by Product Category 2024 & 2032
- Figure 54: Middle East and Africa Packaged Honey Market Volume Share (%), by Product Category 2024 & 2032
- Figure 55: Middle East and Africa Packaged Honey Market Revenue (Million), by Packaging Type 2024 & 2032
- Figure 56: Middle East and Africa Packaged Honey Market Volume (Billion), by Packaging Type 2024 & 2032
- Figure 57: Middle East and Africa Packaged Honey Market Revenue Share (%), by Packaging Type 2024 & 2032
- Figure 58: Middle East and Africa Packaged Honey Market Volume Share (%), by Packaging Type 2024 & 2032
- Figure 59: Middle East and Africa Packaged Honey Market Revenue (Million), by Country 2024 & 2032
- Figure 60: Middle East and Africa Packaged Honey Market Volume (Billion), by Country 2024 & 2032
- Figure 61: Middle East and Africa Packaged Honey Market Revenue Share (%), by Country 2024 & 2032
- Figure 62: Middle East and Africa Packaged Honey Market Volume Share (%), by Country 2024 & 2032
List of Tables
- Table 1: Global Packaged Honey Market Revenue Million Forecast, by Region 2019 & 2032
- Table 2: Global Packaged Honey Market Volume Billion Forecast, by Region 2019 & 2032
- Table 3: Global Packaged Honey Market Revenue Million Forecast, by Product Category 2019 & 2032
- Table 4: Global Packaged Honey Market Volume Billion Forecast, by Product Category 2019 & 2032
- Table 5: Global Packaged Honey Market Revenue Million Forecast, by Packaging Type 2019 & 2032
- Table 6: Global Packaged Honey Market Volume Billion Forecast, by Packaging Type 2019 & 2032
- Table 7: Global Packaged Honey Market Revenue Million Forecast, by Region 2019 & 2032
- Table 8: Global Packaged Honey Market Volume Billion Forecast, by Region 2019 & 2032
- Table 9: Global Packaged Honey Market Revenue Million Forecast, by Product Category 2019 & 2032
- Table 10: Global Packaged Honey Market Volume Billion Forecast, by Product Category 2019 & 2032
- Table 11: Global Packaged Honey Market Revenue Million Forecast, by Packaging Type 2019 & 2032
- Table 12: Global Packaged Honey Market Volume Billion Forecast, by Packaging Type 2019 & 2032
- Table 13: Global Packaged Honey Market Revenue Million Forecast, by Country 2019 & 2032
- Table 14: Global Packaged Honey Market Volume Billion Forecast, by Country 2019 & 2032
- Table 15: United States Packaged Honey Market Revenue (Million) Forecast, by Application 2019 & 2032
- Table 16: United States Packaged Honey Market Volume (Billion) Forecast, by Application 2019 & 2032
- Table 17: Canada Packaged Honey Market Revenue (Million) Forecast, by Application 2019 & 2032
- Table 18: Canada Packaged Honey Market Volume (Billion) Forecast, by Application 2019 & 2032
- Table 19: Mexico Packaged Honey Market Revenue (Million) Forecast, by Application 2019 & 2032
- Table 20: Mexico Packaged Honey Market Volume (Billion) Forecast, by Application 2019 & 2032
- Table 21: Rest of North America Packaged Honey Market Revenue (Million) Forecast, by Application 2019 & 2032
- Table 22: Rest of North America Packaged Honey Market Volume (Billion) Forecast, by Application 2019 & 2032
- Table 23: Global Packaged Honey Market Revenue Million Forecast, by Product Category 2019 & 2032
- Table 24: Global Packaged Honey Market Volume Billion Forecast, by Product Category 2019 & 2032
- Table 25: Global Packaged Honey Market Revenue Million Forecast, by Packaging Type 2019 & 2032
- Table 26: Global Packaged Honey Market Volume Billion Forecast, by Packaging Type 2019 & 2032
- Table 27: Global Packaged Honey Market Revenue Million Forecast, by Country 2019 & 2032
- Table 28: Global Packaged Honey Market Volume Billion Forecast, by Country 2019 & 2032
- Table 29: Germany Packaged Honey Market Revenue (Million) Forecast, by Application 2019 & 2032
- Table 30: Germany Packaged Honey Market Volume (Billion) Forecast, by Application 2019 & 2032
- Table 31: France Packaged Honey Market Revenue (Million) Forecast, by Application 2019 & 2032
- Table 32: France Packaged Honey Market Volume (Billion) Forecast, by Application 2019 & 2032
- Table 33: Russia Packaged Honey Market Revenue (Million) Forecast, by Application 2019 & 2032
- Table 34: Russia Packaged Honey Market Volume (Billion) Forecast, by Application 2019 & 2032
- Table 35: Spain Packaged Honey Market Revenue (Million) Forecast, by Application 2019 & 2032
- Table 36: Spain Packaged Honey Market Volume (Billion) Forecast, by Application 2019 & 2032
- Table 37: United Kingdom Packaged Honey Market Revenue (Million) Forecast, by Application 2019 & 2032
- Table 38: United Kingdom Packaged Honey Market Volume (Billion) Forecast, by Application 2019 & 2032
- Table 39: Italy Packaged Honey Market Revenue (Million) Forecast, by Application 2019 & 2032
- Table 40: Italy Packaged Honey Market Volume (Billion) Forecast, by Application 2019 & 2032
- Table 41: Rest of Europe Packaged Honey Market Revenue (Million) Forecast, by Application 2019 & 2032
- Table 42: Rest of Europe Packaged Honey Market Volume (Billion) Forecast, by Application 2019 & 2032
- Table 43: Global Packaged Honey Market Revenue Million Forecast, by Product Category 2019 & 2032
- Table 44: Global Packaged Honey Market Volume Billion Forecast, by Product Category 2019 & 2032
- Table 45: Global Packaged Honey Market Revenue Million Forecast, by Packaging Type 2019 & 2032
- Table 46: Global Packaged Honey Market Volume Billion Forecast, by Packaging Type 2019 & 2032
- Table 47: Global Packaged Honey Market Revenue Million Forecast, by Country 2019 & 2032
- Table 48: Global Packaged Honey Market Volume Billion Forecast, by Country 2019 & 2032
- Table 49: India Packaged Honey Market Revenue (Million) Forecast, by Application 2019 & 2032
- Table 50: India Packaged Honey Market Volume (Billion) Forecast, by Application 2019 & 2032
- Table 51: China Packaged Honey Market Revenue (Million) Forecast, by Application 2019 & 2032
- Table 52: China Packaged Honey Market Volume (Billion) Forecast, by Application 2019 & 2032
- Table 53: Japan Packaged Honey Market Revenue (Million) Forecast, by Application 2019 & 2032
- Table 54: Japan Packaged Honey Market Volume (Billion) Forecast, by Application 2019 & 2032
- Table 55: Australia Packaged Honey Market Revenue (Million) Forecast, by Application 2019 & 2032
- Table 56: Australia Packaged Honey Market Volume (Billion) Forecast, by Application 2019 & 2032
- Table 57: Rest of Asia pacific Packaged Honey Market Revenue (Million) Forecast, by Application 2019 & 2032
- Table 58: Rest of Asia pacific Packaged Honey Market Volume (Billion) Forecast, by Application 2019 & 2032
- Table 59: Global Packaged Honey Market Revenue Million Forecast, by Product Category 2019 & 2032
- Table 60: Global Packaged Honey Market Volume Billion Forecast, by Product Category 2019 & 2032
- Table 61: Global Packaged Honey Market Revenue Million Forecast, by Packaging Type 2019 & 2032
- Table 62: Global Packaged Honey Market Volume Billion Forecast, by Packaging Type 2019 & 2032
- Table 63: Global Packaged Honey Market Revenue Million Forecast, by Country 2019 & 2032
- Table 64: Global Packaged Honey Market Volume Billion Forecast, by Country 2019 & 2032
- Table 65: Brazil Packaged Honey Market Revenue (Million) Forecast, by Application 2019 & 2032
- Table 66: Brazil Packaged Honey Market Volume (Billion) Forecast, by Application 2019 & 2032
- Table 67: Argentina Packaged Honey Market Revenue (Million) Forecast, by Application 2019 & 2032
- Table 68: Argentina Packaged Honey Market Volume (Billion) Forecast, by Application 2019 & 2032
- Table 69: Rest of South America Packaged Honey Market Revenue (Million) Forecast, by Application 2019 & 2032
- Table 70: Rest of South America Packaged Honey Market Volume (Billion) Forecast, by Application 2019 & 2032
- Table 71: Global Packaged Honey Market Revenue Million Forecast, by Product Category 2019 & 2032
- Table 72: Global Packaged Honey Market Volume Billion Forecast, by Product Category 2019 & 2032
- Table 73: Global Packaged Honey Market Revenue Million Forecast, by Packaging Type 2019 & 2032
- Table 74: Global Packaged Honey Market Volume Billion Forecast, by Packaging Type 2019 & 2032
- Table 75: Global Packaged Honey Market Revenue Million Forecast, by Country 2019 & 2032
- Table 76: Global Packaged Honey Market Volume Billion Forecast, by Country 2019 & 2032
- Table 77: United Arab Emirates Packaged Honey Market Revenue (Million) Forecast, by Application 2019 & 2032
- Table 78: United Arab Emirates Packaged Honey Market Volume (Billion) Forecast, by Application 2019 & 2032
- Table 79: South Africa Packaged Honey Market Revenue (Million) Forecast, by Application 2019 & 2032
- Table 80: South Africa Packaged Honey Market Volume (Billion) Forecast, by Application 2019 & 2032
- Table 81: Rest of Middle East Packaged Honey Market Revenue (Million) Forecast, by Application 2019 & 2032
- Table 82: Rest of Middle East Packaged Honey Market Volume (Billion) Forecast, by Application 2019 & 2032
Frequently Asked Questions
1. What is the projected Compound Annual Growth Rate (CAGR) of the Packaged Honey Market?
The projected CAGR is approximately 6.43%.
2. Which companies are prominent players in the Packaged Honey Market?
Key companies in the market include Dabur India Ltd, Sweet Harvest Foods, Sioux Honey Association Co-op, Barkman Honey LLC, Hive & Wellness Australia Pty Ltd, Patanjali Ayurved Limited, Bright Food Group co Ltd, Mccormick & Company Inc, The J M Smucker Company, Apis Group*List Not Exhaustive.
3. What are the main segments of the Packaged Honey Market?
The market segments include Product Category, Packaging Type.
4. Can you provide details about the market size?
The market size is estimated to be USD 10.92 Million as of 2022.
5. What are some drivers contributing to market growth?
Increasing Demand for Natural Sweeteners; Government Initiatives Boost Honey Production and Beekeeping.
6. What are the notable trends driving market growth?
Conventional Honey Is Consumed Globally.
7. Are there any restraints impacting market growth?
Increasing Demand for Natural Sweeteners; Government Initiatives Boost Honey Production and Beekeeping.
8. Can you provide examples of recent developments in the market?
January 2024: Dabur, one of the leading firms in the Ayurvedic and personal care space, recently invested approximately INR 135 crore in expanding its manufacturing facility in South India. This move is geared toward bolstering the production capacity of its flagship products, including Dabur Honey, Dabur Red Paste, and Odonil air fresheners.
9. What pricing options are available for accessing the report?
Pricing options include single-user, multi-user, and enterprise licenses priced at USD 4750, USD 5250, and USD 8750 respectively.
10. Is the market size provided in terms of value or volume?
The market size is provided in terms of value, measured in Million and volume, measured in Billion.
11. Are there any specific market keywords associated with the report?
Yes, the market keyword associated with the report is "Packaged Honey Market," which aids in identifying and referencing the specific market segment covered.
12. How do I determine which pricing option suits my needs best?
The pricing options vary based on user requirements and access needs. Individual users may opt for single-user licenses, while businesses requiring broader access may choose multi-user or enterprise licenses for cost-effective access to the report.
13. Are there any additional resources or data provided in the Packaged Honey Market report?
While the report offers comprehensive insights, it's advisable to review the specific contents or supplementary materials provided to ascertain if additional resources or data are available.
14. How can I stay updated on further developments or reports in the Packaged Honey Market?
To stay informed about further developments, trends, and reports in the Packaged Honey Market, consider subscribing to industry newsletters, following relevant companies and organizations, or regularly checking reputable industry news sources and publications.
Methodology
Step 1 - Identification of Relevant Samples Size from Population Database


Step 2 - Approaches for Defining Global Market Size (Value, Volume* & Price*)

Note*: In applicable scenarios
Step 3 - Data Sources
Primary Research
- Web Analytics
- Survey Reports
- Research Institute
- Latest Research Reports
- Opinion Leaders
Secondary Research
- Annual Reports
- White Paper
- Latest Press Release
- Industry Association
- Paid Database
- Investor Presentations

Step 4 - Data Triangulation
Involves using different sources of information in order to increase the validity of a study
These sources are likely to be stakeholders in a program - participants, other researchers, program staff, other community members, and so on.
Then we put all data in single framework & apply various statistical tools to find out the dynamic on the market.
During the analysis stage, feedback from the stakeholder groups would be compared to determine areas of agreement as well as areas of divergence


