
Key Insights
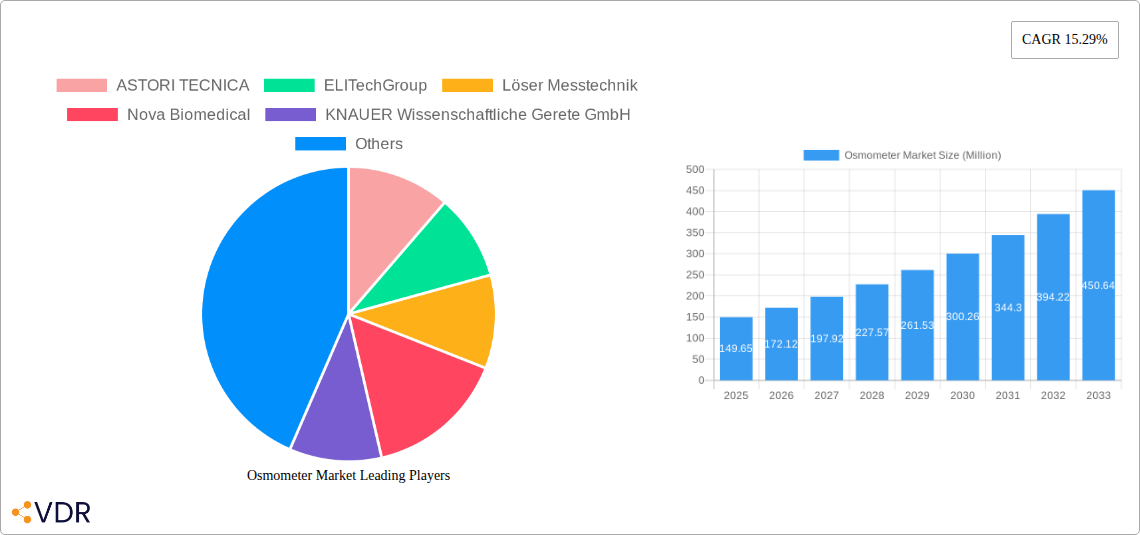
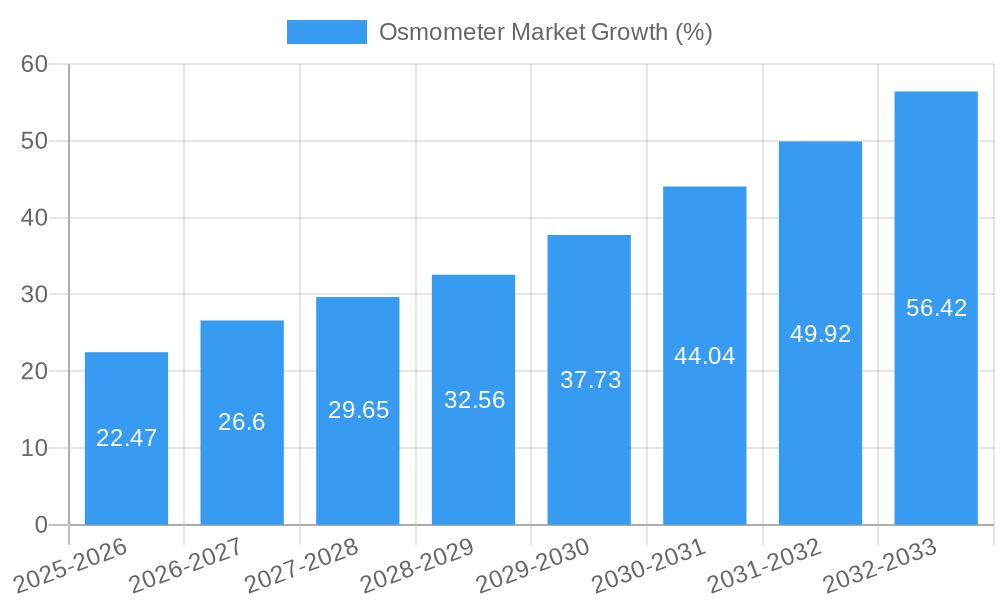
The global osmometer market, valued at $149.65 million in 2025, is projected to experience robust growth, driven by a compound annual growth rate (CAGR) of 15.29% from 2025 to 2033. This expansion is fueled by several key factors. The increasing prevalence of chronic diseases requiring precise fluid and electrolyte monitoring is significantly boosting demand for osmometers across clinical settings, particularly in hospitals and diagnostic laboratories. Furthermore, the pharmaceutical and biotechnology industries rely heavily on osmometry for quality control and research and development, contributing to market growth. Advancements in osmometer technology, such as the development of more accurate, portable, and multi-sample devices, are enhancing efficiency and driving adoption. The rising adoption of point-of-care testing and the growing emphasis on personalized medicine are also contributing to the market's expansion.
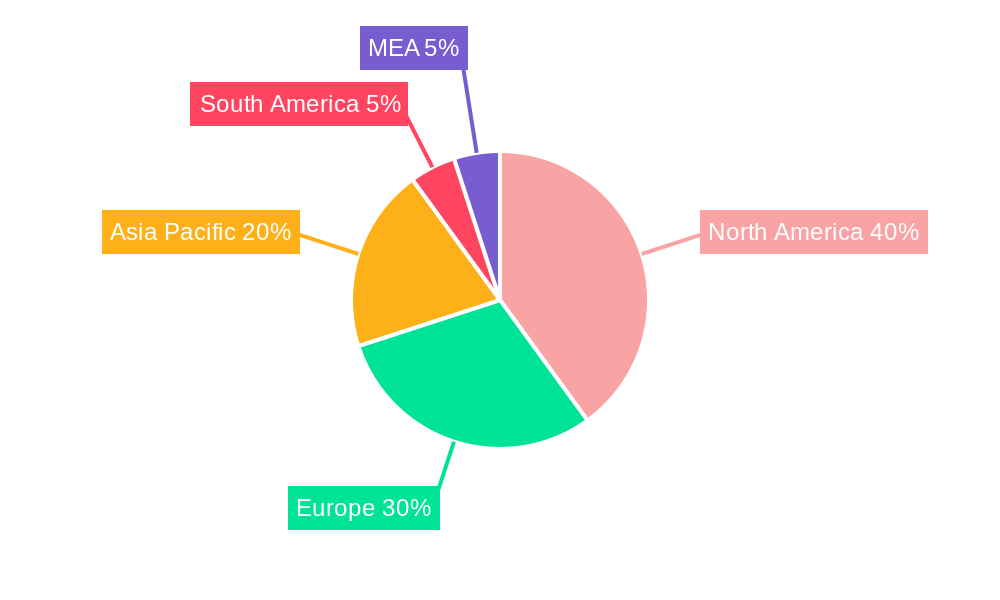
Geographical expansion presents considerable opportunity. While North America currently holds a significant market share due to well-established healthcare infrastructure and high adoption rates, emerging markets in Asia-Pacific and South America demonstrate high growth potential. Increased healthcare spending and expanding diagnostic capabilities in these regions are key drivers. However, market growth may face some restraints, including the high cost of advanced osmometers, particularly multi-sample systems, potentially limiting access in resource-constrained settings. Regulatory hurdles and the need for skilled personnel to operate and maintain the equipment can also present challenges. Despite these limitations, the overall market outlook remains positive, with continuous technological innovation and expanding applications expected to fuel significant growth throughout the forecast period.
Osmometer Market: A Comprehensive Report 2019-2033
This comprehensive report provides a detailed analysis of the Osmometer Market, encompassing market dynamics, growth trends, regional insights, product landscape, key players, and future outlook. With a focus on the parent market of analytical instruments and the child market of medical diagnostic equipment, this report is an essential resource for industry professionals, investors, and researchers seeking to understand and capitalize on the opportunities within this dynamic sector. The study period covers 2019-2033, with 2025 as the base and estimated year. The forecast period spans 2025-2033, and the historical period encompasses 2019-2024. The market size is presented in million units.
Osmometer Market Dynamics & Structure
The global osmometer market is characterized by moderate concentration, with key players holding significant market share. Technological innovation, particularly in miniaturization, automation, and improved accuracy, is a key driver of growth. Stringent regulatory frameworks governing medical devices influence market access and product development. Competitive pressures arise from substitute technologies and the emergence of innovative solutions. The end-user demographic is primarily composed of hospitals, diagnostic laboratories, and pharmaceutical/biotech companies, exhibiting varying adoption rates based on factors such as budget constraints and technological proficiency. Mergers and acquisitions (M&A) activity within the sector has been relatively modest, with xx deals recorded between 2019 and 2024, representing a xx% market share consolidation.
- Market Concentration: Moderately concentrated, with top 5 players holding approximately xx% market share in 2024.
- Technological Innovation: Focus on miniaturization, automation, improved accuracy, and connectivity.
- Regulatory Landscape: Stringent regulations, particularly for medical applications, impact market entry and product development.
- Competitive Substitutes: Limited direct substitutes; competition primarily from alternative analytical techniques.
- M&A Activity: xx deals between 2019-2024, resulting in xx% market share consolidation.
- Innovation Barriers: High R&D costs, stringent regulatory approvals, and maintaining accuracy.
Osmometer Market Growth Trends & Insights
The global osmometer market is projected to experience a Compound Annual Growth Rate (CAGR) of xx% during the forecast period (2025-2033), driven by factors such as increasing prevalence of chronic diseases, rising demand for accurate diagnostic tools, and growing adoption in pharmaceutical and biotechnology research. Market penetration remains relatively low in emerging economies, presenting significant growth opportunities. Technological advancements, such as the integration of advanced sensors and improved data analysis capabilities, are disrupting the market, leading to higher adoption rates and improved diagnostic accuracy. Shifts in consumer behavior, including increased preference for point-of-care testing and remote monitoring, are further influencing market growth. The market size is estimated at xx million units in 2025 and projected to reach xx million units by 2033.
Dominant Regions, Countries, or Segments in Osmometer Market
North America currently holds the largest market share, driven by robust healthcare infrastructure, high adoption rates, and significant investments in research and development. Europe follows as a significant market, with strong regulatory frameworks and a high prevalence of chronic diseases. Within product types, Freezing Point Osmometers hold the largest market share due to their established technology and wide applicability. Multi-sample Osmometers are gaining traction owing to increased throughput and efficiency. The clinical application segment dominates the market, driven by the crucial role of osmometry in various medical diagnoses. Hospitals and laboratory diagnostic centers account for the majority of end-user spending.
- Key Regional Drivers: North America (strong healthcare infrastructure, high adoption rates), Europe (strong regulations, high prevalence of chronic diseases).
- Leading Segments: Freezing Point Osmometers (established technology), Multi-sample Osmometers (increased efficiency), Clinical Applications (crucial diagnostic role), Hospitals & Diagnostic Centers (high end-user spending).
- Growth Potential: Emerging markets in Asia-Pacific and Latin America offer substantial growth potential.
Osmometer Market Product Landscape
The osmometer market features a range of products, including freezing point, vapor pressure, and membrane osmometers, each with unique applications and performance characteristics. Recent innovations focus on improving accuracy, reducing measurement time, and enhancing user-friendliness. Key selling propositions include automated sample handling, advanced data analysis capabilities, and improved connectivity features. Technological advancements encompass miniaturization, improved sensor technology, and the integration of advanced algorithms for data processing and interpretation.
Key Drivers, Barriers & Challenges in Osmometer Market
Key Drivers:
- Increasing prevalence of chronic diseases requiring precise diagnostics.
- Growing demand for accurate and rapid osmolarity measurements.
- Advancements in sensor technology and automation.
- Rising adoption in pharmaceutical and biotechnology research.
Key Challenges & Restraints:
- High initial investment costs for advanced osmometers.
- Stringent regulatory requirements for medical device approval.
- Competition from alternative analytical techniques.
- Supply chain disruptions impacting component availability. This resulted in a xx% increase in production costs in 2022.
Emerging Opportunities in Osmometer Market
- Expansion into emerging markets with unmet diagnostic needs.
- Development of point-of-care testing devices for rapid diagnostics.
- Integration of osmometry with other diagnostic technologies for comprehensive analysis.
- Growing demand for personalized medicine driving tailored osmometry applications.
Growth Accelerators in the Osmometer Market Industry
Technological breakthroughs in sensor technology, automation, and data analysis are key growth catalysts. Strategic partnerships between manufacturers and healthcare providers are driving market expansion and enhancing product adoption. Market expansion into emerging economies and the development of innovative applications in various fields are further fueling market growth.
Key Players Shaping the Osmometer Market Market
- ASTORI TECNICA
- ELITechGroup
- Löser Messtechnik
- Nova Biomedical
- KNAUER Wissenschaftliche Geräte GmbH
- ARKRAY Inc
- Precision Systems Inc
- Advanced Instruments LLC
Notable Milestones in Osmometer Market Sector
- September 2022: Trukera Medical announced the launch of the New ScoutPro Osmolarity System.
- September 2021: Launch of Advanced QC, a web-based program for comparing osmometer control data.
In-Depth Osmometer Market Market Outlook
The osmometer market exhibits significant future potential driven by technological advancements, expanding applications, and increasing healthcare spending globally. Strategic partnerships, focused R&D, and expansion into untapped markets present lucrative opportunities for key players. The market is poised for continued growth, driven by the rising demand for accurate and efficient diagnostic tools across various healthcare settings and research applications.
Osmometer Market Segmentation
-
1. Product Type
- 1.1. Freezing Point Osmometers
- 1.2. Vapor Pressure Osmometers
- 1.3. Membrane Osmometers
-
2. Sampling Capacity
- 2.1. Single-sample Osmometers
- 2.2. Multi-sample Osmometers
-
3. Application
- 3.1. Clinical
- 3.2. Pharmaceutical and Biotech
- 3.3. Other Applications
-
4. End User
- 4.1. Hospitals
- 4.2. Laboratory and Diagnostic Centers
- 4.3. Other End Users
Osmometer Market Segmentation By Geography
-
1. North America
- 1.1. United States
- 1.2. Canada
- 1.3. Mexico
-
2. Europe
- 2.1. Germany
- 2.2. United Kingdom
- 2.3. France
- 2.4. Italy
- 2.5. Spain
- 2.6. Rest of Europe
-
3. Asia Pacific
- 3.1. China
- 3.2. Japan
- 3.3. India
- 3.4. Australia
- 3.5. South Korea
- 3.6. Rest of Asia Pacific
- 4. Rest of the World
Osmometer Market REPORT HIGHLIGHTS
| Aspects | Details |
|---|---|
| Study Period | 2019-2033 |
| Base Year | 2024 |
| Estimated Year | 2025 |
| Forecast Period | 2025-2033 |
| Historical Period | 2019-2024 |
| Growth Rate | CAGR of 15.29% from 2019-2033 |
| Segmentation |
|
Table of Contents
- 1. Introduction
- 1.1. Research Scope
- 1.2. Market Segmentation
- 1.3. Research Methodology
- 1.4. Definitions and Assumptions
- 2. Executive Summary
- 2.1. Introduction
- 3. Market Dynamics
- 3.1. Introduction
- 3.2. Market Drivers
- 3.2.1. Technological Advancements in Osmometers and High Demand for Automation; Growing R&D Investments and Increase in Burden of Various Diseases
- 3.3. Market Restrains
- 3.3.1. Limitations of Osmometers; Dearth of Skilled Professionals
- 3.4. Market Trends
- 3.4.1. Freezing Point Osmometers are Expected to have Healthy Growth Rate
- 4. Market Factor Analysis
- 4.1. Porters Five Forces
- 4.2. Supply/Value Chain
- 4.3. PESTEL analysis
- 4.4. Market Entropy
- 4.5. Patent/Trademark Analysis
- 5. Global Osmometer Market Analysis, Insights and Forecast, 2019-2031
- 5.1. Market Analysis, Insights and Forecast - by Product Type
- 5.1.1. Freezing Point Osmometers
- 5.1.2. Vapor Pressure Osmometers
- 5.1.3. Membrane Osmometers
- 5.2. Market Analysis, Insights and Forecast - by Sampling Capacity
- 5.2.1. Single-sample Osmometers
- 5.2.2. Multi-sample Osmometers
- 5.3. Market Analysis, Insights and Forecast - by Application
- 5.3.1. Clinical
- 5.3.2. Pharmaceutical and Biotech
- 5.3.3. Other Applications
- 5.4. Market Analysis, Insights and Forecast - by End User
- 5.4.1. Hospitals
- 5.4.2. Laboratory and Diagnostic Centers
- 5.4.3. Other End Users
- 5.5. Market Analysis, Insights and Forecast - by Region
- 5.5.1. North America
- 5.5.2. Europe
- 5.5.3. Asia Pacific
- 5.5.4. Rest of the World
- 5.1. Market Analysis, Insights and Forecast - by Product Type
- 6. North America Osmometer Market Analysis, Insights and Forecast, 2019-2031
- 6.1. Market Analysis, Insights and Forecast - by Product Type
- 6.1.1. Freezing Point Osmometers
- 6.1.2. Vapor Pressure Osmometers
- 6.1.3. Membrane Osmometers
- 6.2. Market Analysis, Insights and Forecast - by Sampling Capacity
- 6.2.1. Single-sample Osmometers
- 6.2.2. Multi-sample Osmometers
- 6.3. Market Analysis, Insights and Forecast - by Application
- 6.3.1. Clinical
- 6.3.2. Pharmaceutical and Biotech
- 6.3.3. Other Applications
- 6.4. Market Analysis, Insights and Forecast - by End User
- 6.4.1. Hospitals
- 6.4.2. Laboratory and Diagnostic Centers
- 6.4.3. Other End Users
- 6.1. Market Analysis, Insights and Forecast - by Product Type
- 7. Europe Osmometer Market Analysis, Insights and Forecast, 2019-2031
- 7.1. Market Analysis, Insights and Forecast - by Product Type
- 7.1.1. Freezing Point Osmometers
- 7.1.2. Vapor Pressure Osmometers
- 7.1.3. Membrane Osmometers
- 7.2. Market Analysis, Insights and Forecast - by Sampling Capacity
- 7.2.1. Single-sample Osmometers
- 7.2.2. Multi-sample Osmometers
- 7.3. Market Analysis, Insights and Forecast - by Application
- 7.3.1. Clinical
- 7.3.2. Pharmaceutical and Biotech
- 7.3.3. Other Applications
- 7.4. Market Analysis, Insights and Forecast - by End User
- 7.4.1. Hospitals
- 7.4.2. Laboratory and Diagnostic Centers
- 7.4.3. Other End Users
- 7.1. Market Analysis, Insights and Forecast - by Product Type
- 8. Asia Pacific Osmometer Market Analysis, Insights and Forecast, 2019-2031
- 8.1. Market Analysis, Insights and Forecast - by Product Type
- 8.1.1. Freezing Point Osmometers
- 8.1.2. Vapor Pressure Osmometers
- 8.1.3. Membrane Osmometers
- 8.2. Market Analysis, Insights and Forecast - by Sampling Capacity
- 8.2.1. Single-sample Osmometers
- 8.2.2. Multi-sample Osmometers
- 8.3. Market Analysis, Insights and Forecast - by Application
- 8.3.1. Clinical
- 8.3.2. Pharmaceutical and Biotech
- 8.3.3. Other Applications
- 8.4. Market Analysis, Insights and Forecast - by End User
- 8.4.1. Hospitals
- 8.4.2. Laboratory and Diagnostic Centers
- 8.4.3. Other End Users
- 8.1. Market Analysis, Insights and Forecast - by Product Type
- 9. Rest of the World Osmometer Market Analysis, Insights and Forecast, 2019-2031
- 9.1. Market Analysis, Insights and Forecast - by Product Type
- 9.1.1. Freezing Point Osmometers
- 9.1.2. Vapor Pressure Osmometers
- 9.1.3. Membrane Osmometers
- 9.2. Market Analysis, Insights and Forecast - by Sampling Capacity
- 9.2.1. Single-sample Osmometers
- 9.2.2. Multi-sample Osmometers
- 9.3. Market Analysis, Insights and Forecast - by Application
- 9.3.1. Clinical
- 9.3.2. Pharmaceutical and Biotech
- 9.3.3. Other Applications
- 9.4. Market Analysis, Insights and Forecast - by End User
- 9.4.1. Hospitals
- 9.4.2. Laboratory and Diagnostic Centers
- 9.4.3. Other End Users
- 9.1. Market Analysis, Insights and Forecast - by Product Type
- 10. North America Osmometer Market Analysis, Insights and Forecast, 2019-2031
- 10.1. Market Analysis, Insights and Forecast - By Country/Sub-region
- 10.1.1 United States
- 10.1.2 Canada
- 10.1.3 Mexico
- 11. Europe Osmometer Market Analysis, Insights and Forecast, 2019-2031
- 11.1. Market Analysis, Insights and Forecast - By Country/Sub-region
- 11.1.1 Germany
- 11.1.2 United Kingdom
- 11.1.3 France
- 11.1.4 Spain
- 11.1.5 Italy
- 11.1.6 Spain
- 11.1.7 Belgium
- 11.1.8 Netherland
- 11.1.9 Nordics
- 11.1.10 Rest of Europe
- 12. Asia Pacific Osmometer Market Analysis, Insights and Forecast, 2019-2031
- 12.1. Market Analysis, Insights and Forecast - By Country/Sub-region
- 12.1.1 China
- 12.1.2 Japan
- 12.1.3 India
- 12.1.4 South Korea
- 12.1.5 Southeast Asia
- 12.1.6 Australia
- 12.1.7 Indonesia
- 12.1.8 Phillipes
- 12.1.9 Singapore
- 12.1.10 Thailandc
- 12.1.11 Rest of Asia Pacific
- 13. South America Osmometer Market Analysis, Insights and Forecast, 2019-2031
- 13.1. Market Analysis, Insights and Forecast - By Country/Sub-region
- 13.1.1 Brazil
- 13.1.2 Argentina
- 13.1.3 Peru
- 13.1.4 Chile
- 13.1.5 Colombia
- 13.1.6 Ecuador
- 13.1.7 Venezuela
- 13.1.8 Rest of South America
- 14. North America Osmometer Market Analysis, Insights and Forecast, 2019-2031
- 14.1. Market Analysis, Insights and Forecast - By Country/Sub-region
- 14.1.1 United States
- 14.1.2 Canada
- 14.1.3 Mexico
- 15. MEA Osmometer Market Analysis, Insights and Forecast, 2019-2031
- 15.1. Market Analysis, Insights and Forecast - By Country/Sub-region
- 15.1.1 United Arab Emirates
- 15.1.2 Saudi Arabia
- 15.1.3 South Africa
- 15.1.4 Rest of Middle East and Africa
- 16. Competitive Analysis
- 16.1. Global Market Share Analysis 2024
- 16.2. Company Profiles
- 16.2.1 ASTORI TECNICA
- 16.2.1.1. Overview
- 16.2.1.2. Products
- 16.2.1.3. SWOT Analysis
- 16.2.1.4. Recent Developments
- 16.2.1.5. Financials (Based on Availability)
- 16.2.2 ELITechGroup
- 16.2.2.1. Overview
- 16.2.2.2. Products
- 16.2.2.3. SWOT Analysis
- 16.2.2.4. Recent Developments
- 16.2.2.5. Financials (Based on Availability)
- 16.2.3 Löser Messtechnik
- 16.2.3.1. Overview
- 16.2.3.2. Products
- 16.2.3.3. SWOT Analysis
- 16.2.3.4. Recent Developments
- 16.2.3.5. Financials (Based on Availability)
- 16.2.4 Nova Biomedical
- 16.2.4.1. Overview
- 16.2.4.2. Products
- 16.2.4.3. SWOT Analysis
- 16.2.4.4. Recent Developments
- 16.2.4.5. Financials (Based on Availability)
- 16.2.5 KNAUER Wissenschaftliche Gerete GmbH
- 16.2.5.1. Overview
- 16.2.5.2. Products
- 16.2.5.3. SWOT Analysis
- 16.2.5.4. Recent Developments
- 16.2.5.5. Financials (Based on Availability)
- 16.2.6 ARKRAY Inc
- 16.2.6.1. Overview
- 16.2.6.2. Products
- 16.2.6.3. SWOT Analysis
- 16.2.6.4. Recent Developments
- 16.2.6.5. Financials (Based on Availability)
- 16.2.7 Precision Systems Inc
- 16.2.7.1. Overview
- 16.2.7.2. Products
- 16.2.7.3. SWOT Analysis
- 16.2.7.4. Recent Developments
- 16.2.7.5. Financials (Based on Availability)
- 16.2.8 Advanced Instruments LLC
- 16.2.8.1. Overview
- 16.2.8.2. Products
- 16.2.8.3. SWOT Analysis
- 16.2.8.4. Recent Developments
- 16.2.8.5. Financials (Based on Availability)
- 16.2.1 ASTORI TECNICA
List of Figures
- Figure 1: Global Osmometer Market Revenue Breakdown (Million, %) by Region 2024 & 2032
- Figure 2: Global Osmometer Market Volume Breakdown (K Unit, %) by Region 2024 & 2032
- Figure 3: North America Osmometer Market Revenue (Million), by Country 2024 & 2032
- Figure 4: North America Osmometer Market Volume (K Unit), by Country 2024 & 2032
- Figure 5: North America Osmometer Market Revenue Share (%), by Country 2024 & 2032
- Figure 6: North America Osmometer Market Volume Share (%), by Country 2024 & 2032
- Figure 7: Europe Osmometer Market Revenue (Million), by Country 2024 & 2032
- Figure 8: Europe Osmometer Market Volume (K Unit), by Country 2024 & 2032
- Figure 9: Europe Osmometer Market Revenue Share (%), by Country 2024 & 2032
- Figure 10: Europe Osmometer Market Volume Share (%), by Country 2024 & 2032
- Figure 11: Asia Pacific Osmometer Market Revenue (Million), by Country 2024 & 2032
- Figure 12: Asia Pacific Osmometer Market Volume (K Unit), by Country 2024 & 2032
- Figure 13: Asia Pacific Osmometer Market Revenue Share (%), by Country 2024 & 2032
- Figure 14: Asia Pacific Osmometer Market Volume Share (%), by Country 2024 & 2032
- Figure 15: South America Osmometer Market Revenue (Million), by Country 2024 & 2032
- Figure 16: South America Osmometer Market Volume (K Unit), by Country 2024 & 2032
- Figure 17: South America Osmometer Market Revenue Share (%), by Country 2024 & 2032
- Figure 18: South America Osmometer Market Volume Share (%), by Country 2024 & 2032
- Figure 19: North America Osmometer Market Revenue (Million), by Country 2024 & 2032
- Figure 20: North America Osmometer Market Volume (K Unit), by Country 2024 & 2032
- Figure 21: North America Osmometer Market Revenue Share (%), by Country 2024 & 2032
- Figure 22: North America Osmometer Market Volume Share (%), by Country 2024 & 2032
- Figure 23: MEA Osmometer Market Revenue (Million), by Country 2024 & 2032
- Figure 24: MEA Osmometer Market Volume (K Unit), by Country 2024 & 2032
- Figure 25: MEA Osmometer Market Revenue Share (%), by Country 2024 & 2032
- Figure 26: MEA Osmometer Market Volume Share (%), by Country 2024 & 2032
- Figure 27: North America Osmometer Market Revenue (Million), by Product Type 2024 & 2032
- Figure 28: North America Osmometer Market Volume (K Unit), by Product Type 2024 & 2032
- Figure 29: North America Osmometer Market Revenue Share (%), by Product Type 2024 & 2032
- Figure 30: North America Osmometer Market Volume Share (%), by Product Type 2024 & 2032
- Figure 31: North America Osmometer Market Revenue (Million), by Sampling Capacity 2024 & 2032
- Figure 32: North America Osmometer Market Volume (K Unit), by Sampling Capacity 2024 & 2032
- Figure 33: North America Osmometer Market Revenue Share (%), by Sampling Capacity 2024 & 2032
- Figure 34: North America Osmometer Market Volume Share (%), by Sampling Capacity 2024 & 2032
- Figure 35: North America Osmometer Market Revenue (Million), by Application 2024 & 2032
- Figure 36: North America Osmometer Market Volume (K Unit), by Application 2024 & 2032
- Figure 37: North America Osmometer Market Revenue Share (%), by Application 2024 & 2032
- Figure 38: North America Osmometer Market Volume Share (%), by Application 2024 & 2032
- Figure 39: North America Osmometer Market Revenue (Million), by End User 2024 & 2032
- Figure 40: North America Osmometer Market Volume (K Unit), by End User 2024 & 2032
- Figure 41: North America Osmometer Market Revenue Share (%), by End User 2024 & 2032
- Figure 42: North America Osmometer Market Volume Share (%), by End User 2024 & 2032
- Figure 43: North America Osmometer Market Revenue (Million), by Country 2024 & 2032
- Figure 44: North America Osmometer Market Volume (K Unit), by Country 2024 & 2032
- Figure 45: North America Osmometer Market Revenue Share (%), by Country 2024 & 2032
- Figure 46: North America Osmometer Market Volume Share (%), by Country 2024 & 2032
- Figure 47: Europe Osmometer Market Revenue (Million), by Product Type 2024 & 2032
- Figure 48: Europe Osmometer Market Volume (K Unit), by Product Type 2024 & 2032
- Figure 49: Europe Osmometer Market Revenue Share (%), by Product Type 2024 & 2032
- Figure 50: Europe Osmometer Market Volume Share (%), by Product Type 2024 & 2032
- Figure 51: Europe Osmometer Market Revenue (Million), by Sampling Capacity 2024 & 2032
- Figure 52: Europe Osmometer Market Volume (K Unit), by Sampling Capacity 2024 & 2032
- Figure 53: Europe Osmometer Market Revenue Share (%), by Sampling Capacity 2024 & 2032
- Figure 54: Europe Osmometer Market Volume Share (%), by Sampling Capacity 2024 & 2032
- Figure 55: Europe Osmometer Market Revenue (Million), by Application 2024 & 2032
- Figure 56: Europe Osmometer Market Volume (K Unit), by Application 2024 & 2032
- Figure 57: Europe Osmometer Market Revenue Share (%), by Application 2024 & 2032
- Figure 58: Europe Osmometer Market Volume Share (%), by Application 2024 & 2032
- Figure 59: Europe Osmometer Market Revenue (Million), by End User 2024 & 2032
- Figure 60: Europe Osmometer Market Volume (K Unit), by End User 2024 & 2032
- Figure 61: Europe Osmometer Market Revenue Share (%), by End User 2024 & 2032
- Figure 62: Europe Osmometer Market Volume Share (%), by End User 2024 & 2032
- Figure 63: Europe Osmometer Market Revenue (Million), by Country 2024 & 2032
- Figure 64: Europe Osmometer Market Volume (K Unit), by Country 2024 & 2032
- Figure 65: Europe Osmometer Market Revenue Share (%), by Country 2024 & 2032
- Figure 66: Europe Osmometer Market Volume Share (%), by Country 2024 & 2032
- Figure 67: Asia Pacific Osmometer Market Revenue (Million), by Product Type 2024 & 2032
- Figure 68: Asia Pacific Osmometer Market Volume (K Unit), by Product Type 2024 & 2032
- Figure 69: Asia Pacific Osmometer Market Revenue Share (%), by Product Type 2024 & 2032
- Figure 70: Asia Pacific Osmometer Market Volume Share (%), by Product Type 2024 & 2032
- Figure 71: Asia Pacific Osmometer Market Revenue (Million), by Sampling Capacity 2024 & 2032
- Figure 72: Asia Pacific Osmometer Market Volume (K Unit), by Sampling Capacity 2024 & 2032
- Figure 73: Asia Pacific Osmometer Market Revenue Share (%), by Sampling Capacity 2024 & 2032
- Figure 74: Asia Pacific Osmometer Market Volume Share (%), by Sampling Capacity 2024 & 2032
- Figure 75: Asia Pacific Osmometer Market Revenue (Million), by Application 2024 & 2032
- Figure 76: Asia Pacific Osmometer Market Volume (K Unit), by Application 2024 & 2032
- Figure 77: Asia Pacific Osmometer Market Revenue Share (%), by Application 2024 & 2032
- Figure 78: Asia Pacific Osmometer Market Volume Share (%), by Application 2024 & 2032
- Figure 79: Asia Pacific Osmometer Market Revenue (Million), by End User 2024 & 2032
- Figure 80: Asia Pacific Osmometer Market Volume (K Unit), by End User 2024 & 2032
- Figure 81: Asia Pacific Osmometer Market Revenue Share (%), by End User 2024 & 2032
- Figure 82: Asia Pacific Osmometer Market Volume Share (%), by End User 2024 & 2032
- Figure 83: Asia Pacific Osmometer Market Revenue (Million), by Country 2024 & 2032
- Figure 84: Asia Pacific Osmometer Market Volume (K Unit), by Country 2024 & 2032
- Figure 85: Asia Pacific Osmometer Market Revenue Share (%), by Country 2024 & 2032
- Figure 86: Asia Pacific Osmometer Market Volume Share (%), by Country 2024 & 2032
- Figure 87: Rest of the World Osmometer Market Revenue (Million), by Product Type 2024 & 2032
- Figure 88: Rest of the World Osmometer Market Volume (K Unit), by Product Type 2024 & 2032
- Figure 89: Rest of the World Osmometer Market Revenue Share (%), by Product Type 2024 & 2032
- Figure 90: Rest of the World Osmometer Market Volume Share (%), by Product Type 2024 & 2032
- Figure 91: Rest of the World Osmometer Market Revenue (Million), by Sampling Capacity 2024 & 2032
- Figure 92: Rest of the World Osmometer Market Volume (K Unit), by Sampling Capacity 2024 & 2032
- Figure 93: Rest of the World Osmometer Market Revenue Share (%), by Sampling Capacity 2024 & 2032
- Figure 94: Rest of the World Osmometer Market Volume Share (%), by Sampling Capacity 2024 & 2032
- Figure 95: Rest of the World Osmometer Market Revenue (Million), by Application 2024 & 2032
- Figure 96: Rest of the World Osmometer Market Volume (K Unit), by Application 2024 & 2032
- Figure 97: Rest of the World Osmometer Market Revenue Share (%), by Application 2024 & 2032
- Figure 98: Rest of the World Osmometer Market Volume Share (%), by Application 2024 & 2032
- Figure 99: Rest of the World Osmometer Market Revenue (Million), by End User 2024 & 2032
- Figure 100: Rest of the World Osmometer Market Volume (K Unit), by End User 2024 & 2032
- Figure 101: Rest of the World Osmometer Market Revenue Share (%), by End User 2024 & 2032
- Figure 102: Rest of the World Osmometer Market Volume Share (%), by End User 2024 & 2032
- Figure 103: Rest of the World Osmometer Market Revenue (Million), by Country 2024 & 2032
- Figure 104: Rest of the World Osmometer Market Volume (K Unit), by Country 2024 & 2032
- Figure 105: Rest of the World Osmometer Market Revenue Share (%), by Country 2024 & 2032
- Figure 106: Rest of the World Osmometer Market Volume Share (%), by Country 2024 & 2032
List of Tables
- Table 1: Global Osmometer Market Revenue Million Forecast, by Region 2019 & 2032
- Table 2: Global Osmometer Market Volume K Unit Forecast, by Region 2019 & 2032
- Table 3: Global Osmometer Market Revenue Million Forecast, by Product Type 2019 & 2032
- Table 4: Global Osmometer Market Volume K Unit Forecast, by Product Type 2019 & 2032
- Table 5: Global Osmometer Market Revenue Million Forecast, by Sampling Capacity 2019 & 2032
- Table 6: Global Osmometer Market Volume K Unit Forecast, by Sampling Capacity 2019 & 2032
- Table 7: Global Osmometer Market Revenue Million Forecast, by Application 2019 & 2032
- Table 8: Global Osmometer Market Volume K Unit Forecast, by Application 2019 & 2032
- Table 9: Global Osmometer Market Revenue Million Forecast, by End User 2019 & 2032
- Table 10: Global Osmometer Market Volume K Unit Forecast, by End User 2019 & 2032
- Table 11: Global Osmometer Market Revenue Million Forecast, by Region 2019 & 2032
- Table 12: Global Osmometer Market Volume K Unit Forecast, by Region 2019 & 2032
- Table 13: Global Osmometer Market Revenue Million Forecast, by Country 2019 & 2032
- Table 14: Global Osmometer Market Volume K Unit Forecast, by Country 2019 & 2032
- Table 15: United States Osmometer Market Revenue (Million) Forecast, by Application 2019 & 2032
- Table 16: United States Osmometer Market Volume (K Unit) Forecast, by Application 2019 & 2032
- Table 17: Canada Osmometer Market Revenue (Million) Forecast, by Application 2019 & 2032
- Table 18: Canada Osmometer Market Volume (K Unit) Forecast, by Application 2019 & 2032
- Table 19: Mexico Osmometer Market Revenue (Million) Forecast, by Application 2019 & 2032
- Table 20: Mexico Osmometer Market Volume (K Unit) Forecast, by Application 2019 & 2032
- Table 21: Global Osmometer Market Revenue Million Forecast, by Country 2019 & 2032
- Table 22: Global Osmometer Market Volume K Unit Forecast, by Country 2019 & 2032
- Table 23: Germany Osmometer Market Revenue (Million) Forecast, by Application 2019 & 2032
- Table 24: Germany Osmometer Market Volume (K Unit) Forecast, by Application 2019 & 2032
- Table 25: United Kingdom Osmometer Market Revenue (Million) Forecast, by Application 2019 & 2032
- Table 26: United Kingdom Osmometer Market Volume (K Unit) Forecast, by Application 2019 & 2032
- Table 27: France Osmometer Market Revenue (Million) Forecast, by Application 2019 & 2032
- Table 28: France Osmometer Market Volume (K Unit) Forecast, by Application 2019 & 2032
- Table 29: Spain Osmometer Market Revenue (Million) Forecast, by Application 2019 & 2032
- Table 30: Spain Osmometer Market Volume (K Unit) Forecast, by Application 2019 & 2032
- Table 31: Italy Osmometer Market Revenue (Million) Forecast, by Application 2019 & 2032
- Table 32: Italy Osmometer Market Volume (K Unit) Forecast, by Application 2019 & 2032
- Table 33: Spain Osmometer Market Revenue (Million) Forecast, by Application 2019 & 2032
- Table 34: Spain Osmometer Market Volume (K Unit) Forecast, by Application 2019 & 2032
- Table 35: Belgium Osmometer Market Revenue (Million) Forecast, by Application 2019 & 2032
- Table 36: Belgium Osmometer Market Volume (K Unit) Forecast, by Application 2019 & 2032
- Table 37: Netherland Osmometer Market Revenue (Million) Forecast, by Application 2019 & 2032
- Table 38: Netherland Osmometer Market Volume (K Unit) Forecast, by Application 2019 & 2032
- Table 39: Nordics Osmometer Market Revenue (Million) Forecast, by Application 2019 & 2032
- Table 40: Nordics Osmometer Market Volume (K Unit) Forecast, by Application 2019 & 2032
- Table 41: Rest of Europe Osmometer Market Revenue (Million) Forecast, by Application 2019 & 2032
- Table 42: Rest of Europe Osmometer Market Volume (K Unit) Forecast, by Application 2019 & 2032
- Table 43: Global Osmometer Market Revenue Million Forecast, by Country 2019 & 2032
- Table 44: Global Osmometer Market Volume K Unit Forecast, by Country 2019 & 2032
- Table 45: China Osmometer Market Revenue (Million) Forecast, by Application 2019 & 2032
- Table 46: China Osmometer Market Volume (K Unit) Forecast, by Application 2019 & 2032
- Table 47: Japan Osmometer Market Revenue (Million) Forecast, by Application 2019 & 2032
- Table 48: Japan Osmometer Market Volume (K Unit) Forecast, by Application 2019 & 2032
- Table 49: India Osmometer Market Revenue (Million) Forecast, by Application 2019 & 2032
- Table 50: India Osmometer Market Volume (K Unit) Forecast, by Application 2019 & 2032
- Table 51: South Korea Osmometer Market Revenue (Million) Forecast, by Application 2019 & 2032
- Table 52: South Korea Osmometer Market Volume (K Unit) Forecast, by Application 2019 & 2032
- Table 53: Southeast Asia Osmometer Market Revenue (Million) Forecast, by Application 2019 & 2032
- Table 54: Southeast Asia Osmometer Market Volume (K Unit) Forecast, by Application 2019 & 2032
- Table 55: Australia Osmometer Market Revenue (Million) Forecast, by Application 2019 & 2032
- Table 56: Australia Osmometer Market Volume (K Unit) Forecast, by Application 2019 & 2032
- Table 57: Indonesia Osmometer Market Revenue (Million) Forecast, by Application 2019 & 2032
- Table 58: Indonesia Osmometer Market Volume (K Unit) Forecast, by Application 2019 & 2032
- Table 59: Phillipes Osmometer Market Revenue (Million) Forecast, by Application 2019 & 2032
- Table 60: Phillipes Osmometer Market Volume (K Unit) Forecast, by Application 2019 & 2032
- Table 61: Singapore Osmometer Market Revenue (Million) Forecast, by Application 2019 & 2032
- Table 62: Singapore Osmometer Market Volume (K Unit) Forecast, by Application 2019 & 2032
- Table 63: Thailandc Osmometer Market Revenue (Million) Forecast, by Application 2019 & 2032
- Table 64: Thailandc Osmometer Market Volume (K Unit) Forecast, by Application 2019 & 2032
- Table 65: Rest of Asia Pacific Osmometer Market Revenue (Million) Forecast, by Application 2019 & 2032
- Table 66: Rest of Asia Pacific Osmometer Market Volume (K Unit) Forecast, by Application 2019 & 2032
- Table 67: Global Osmometer Market Revenue Million Forecast, by Country 2019 & 2032
- Table 68: Global Osmometer Market Volume K Unit Forecast, by Country 2019 & 2032
- Table 69: Brazil Osmometer Market Revenue (Million) Forecast, by Application 2019 & 2032
- Table 70: Brazil Osmometer Market Volume (K Unit) Forecast, by Application 2019 & 2032
- Table 71: Argentina Osmometer Market Revenue (Million) Forecast, by Application 2019 & 2032
- Table 72: Argentina Osmometer Market Volume (K Unit) Forecast, by Application 2019 & 2032
- Table 73: Peru Osmometer Market Revenue (Million) Forecast, by Application 2019 & 2032
- Table 74: Peru Osmometer Market Volume (K Unit) Forecast, by Application 2019 & 2032
- Table 75: Chile Osmometer Market Revenue (Million) Forecast, by Application 2019 & 2032
- Table 76: Chile Osmometer Market Volume (K Unit) Forecast, by Application 2019 & 2032
- Table 77: Colombia Osmometer Market Revenue (Million) Forecast, by Application 2019 & 2032
- Table 78: Colombia Osmometer Market Volume (K Unit) Forecast, by Application 2019 & 2032
- Table 79: Ecuador Osmometer Market Revenue (Million) Forecast, by Application 2019 & 2032
- Table 80: Ecuador Osmometer Market Volume (K Unit) Forecast, by Application 2019 & 2032
- Table 81: Venezuela Osmometer Market Revenue (Million) Forecast, by Application 2019 & 2032
- Table 82: Venezuela Osmometer Market Volume (K Unit) Forecast, by Application 2019 & 2032
- Table 83: Rest of South America Osmometer Market Revenue (Million) Forecast, by Application 2019 & 2032
- Table 84: Rest of South America Osmometer Market Volume (K Unit) Forecast, by Application 2019 & 2032
- Table 85: Global Osmometer Market Revenue Million Forecast, by Country 2019 & 2032
- Table 86: Global Osmometer Market Volume K Unit Forecast, by Country 2019 & 2032
- Table 87: United States Osmometer Market Revenue (Million) Forecast, by Application 2019 & 2032
- Table 88: United States Osmometer Market Volume (K Unit) Forecast, by Application 2019 & 2032
- Table 89: Canada Osmometer Market Revenue (Million) Forecast, by Application 2019 & 2032
- Table 90: Canada Osmometer Market Volume (K Unit) Forecast, by Application 2019 & 2032
- Table 91: Mexico Osmometer Market Revenue (Million) Forecast, by Application 2019 & 2032
- Table 92: Mexico Osmometer Market Volume (K Unit) Forecast, by Application 2019 & 2032
- Table 93: Global Osmometer Market Revenue Million Forecast, by Country 2019 & 2032
- Table 94: Global Osmometer Market Volume K Unit Forecast, by Country 2019 & 2032
- Table 95: United Arab Emirates Osmometer Market Revenue (Million) Forecast, by Application 2019 & 2032
- Table 96: United Arab Emirates Osmometer Market Volume (K Unit) Forecast, by Application 2019 & 2032
- Table 97: Saudi Arabia Osmometer Market Revenue (Million) Forecast, by Application 2019 & 2032
- Table 98: Saudi Arabia Osmometer Market Volume (K Unit) Forecast, by Application 2019 & 2032
- Table 99: South Africa Osmometer Market Revenue (Million) Forecast, by Application 2019 & 2032
- Table 100: South Africa Osmometer Market Volume (K Unit) Forecast, by Application 2019 & 2032
- Table 101: Rest of Middle East and Africa Osmometer Market Revenue (Million) Forecast, by Application 2019 & 2032
- Table 102: Rest of Middle East and Africa Osmometer Market Volume (K Unit) Forecast, by Application 2019 & 2032
- Table 103: Global Osmometer Market Revenue Million Forecast, by Product Type 2019 & 2032
- Table 104: Global Osmometer Market Volume K Unit Forecast, by Product Type 2019 & 2032
- Table 105: Global Osmometer Market Revenue Million Forecast, by Sampling Capacity 2019 & 2032
- Table 106: Global Osmometer Market Volume K Unit Forecast, by Sampling Capacity 2019 & 2032
- Table 107: Global Osmometer Market Revenue Million Forecast, by Application 2019 & 2032
- Table 108: Global Osmometer Market Volume K Unit Forecast, by Application 2019 & 2032
- Table 109: Global Osmometer Market Revenue Million Forecast, by End User 2019 & 2032
- Table 110: Global Osmometer Market Volume K Unit Forecast, by End User 2019 & 2032
- Table 111: Global Osmometer Market Revenue Million Forecast, by Country 2019 & 2032
- Table 112: Global Osmometer Market Volume K Unit Forecast, by Country 2019 & 2032
- Table 113: United States Osmometer Market Revenue (Million) Forecast, by Application 2019 & 2032
- Table 114: United States Osmometer Market Volume (K Unit) Forecast, by Application 2019 & 2032
- Table 115: Canada Osmometer Market Revenue (Million) Forecast, by Application 2019 & 2032
- Table 116: Canada Osmometer Market Volume (K Unit) Forecast, by Application 2019 & 2032
- Table 117: Mexico Osmometer Market Revenue (Million) Forecast, by Application 2019 & 2032
- Table 118: Mexico Osmometer Market Volume (K Unit) Forecast, by Application 2019 & 2032
- Table 119: Global Osmometer Market Revenue Million Forecast, by Product Type 2019 & 2032
- Table 120: Global Osmometer Market Volume K Unit Forecast, by Product Type 2019 & 2032
- Table 121: Global Osmometer Market Revenue Million Forecast, by Sampling Capacity 2019 & 2032
- Table 122: Global Osmometer Market Volume K Unit Forecast, by Sampling Capacity 2019 & 2032
- Table 123: Global Osmometer Market Revenue Million Forecast, by Application 2019 & 2032
- Table 124: Global Osmometer Market Volume K Unit Forecast, by Application 2019 & 2032
- Table 125: Global Osmometer Market Revenue Million Forecast, by End User 2019 & 2032
- Table 126: Global Osmometer Market Volume K Unit Forecast, by End User 2019 & 2032
- Table 127: Global Osmometer Market Revenue Million Forecast, by Country 2019 & 2032
- Table 128: Global Osmometer Market Volume K Unit Forecast, by Country 2019 & 2032
- Table 129: Germany Osmometer Market Revenue (Million) Forecast, by Application 2019 & 2032
- Table 130: Germany Osmometer Market Volume (K Unit) Forecast, by Application 2019 & 2032
- Table 131: United Kingdom Osmometer Market Revenue (Million) Forecast, by Application 2019 & 2032
- Table 132: United Kingdom Osmometer Market Volume (K Unit) Forecast, by Application 2019 & 2032
- Table 133: France Osmometer Market Revenue (Million) Forecast, by Application 2019 & 2032
- Table 134: France Osmometer Market Volume (K Unit) Forecast, by Application 2019 & 2032
- Table 135: Italy Osmometer Market Revenue (Million) Forecast, by Application 2019 & 2032
- Table 136: Italy Osmometer Market Volume (K Unit) Forecast, by Application 2019 & 2032
- Table 137: Spain Osmometer Market Revenue (Million) Forecast, by Application 2019 & 2032
- Table 138: Spain Osmometer Market Volume (K Unit) Forecast, by Application 2019 & 2032
- Table 139: Rest of Europe Osmometer Market Revenue (Million) Forecast, by Application 2019 & 2032
- Table 140: Rest of Europe Osmometer Market Volume (K Unit) Forecast, by Application 2019 & 2032
- Table 141: Global Osmometer Market Revenue Million Forecast, by Product Type 2019 & 2032
- Table 142: Global Osmometer Market Volume K Unit Forecast, by Product Type 2019 & 2032
- Table 143: Global Osmometer Market Revenue Million Forecast, by Sampling Capacity 2019 & 2032
- Table 144: Global Osmometer Market Volume K Unit Forecast, by Sampling Capacity 2019 & 2032
- Table 145: Global Osmometer Market Revenue Million Forecast, by Application 2019 & 2032
- Table 146: Global Osmometer Market Volume K Unit Forecast, by Application 2019 & 2032
- Table 147: Global Osmometer Market Revenue Million Forecast, by End User 2019 & 2032
- Table 148: Global Osmometer Market Volume K Unit Forecast, by End User 2019 & 2032
- Table 149: Global Osmometer Market Revenue Million Forecast, by Country 2019 & 2032
- Table 150: Global Osmometer Market Volume K Unit Forecast, by Country 2019 & 2032
- Table 151: China Osmometer Market Revenue (Million) Forecast, by Application 2019 & 2032
- Table 152: China Osmometer Market Volume (K Unit) Forecast, by Application 2019 & 2032
- Table 153: Japan Osmometer Market Revenue (Million) Forecast, by Application 2019 & 2032
- Table 154: Japan Osmometer Market Volume (K Unit) Forecast, by Application 2019 & 2032
- Table 155: India Osmometer Market Revenue (Million) Forecast, by Application 2019 & 2032
- Table 156: India Osmometer Market Volume (K Unit) Forecast, by Application 2019 & 2032
- Table 157: Australia Osmometer Market Revenue (Million) Forecast, by Application 2019 & 2032
- Table 158: Australia Osmometer Market Volume (K Unit) Forecast, by Application 2019 & 2032
- Table 159: South Korea Osmometer Market Revenue (Million) Forecast, by Application 2019 & 2032
- Table 160: South Korea Osmometer Market Volume (K Unit) Forecast, by Application 2019 & 2032
- Table 161: Rest of Asia Pacific Osmometer Market Revenue (Million) Forecast, by Application 2019 & 2032
- Table 162: Rest of Asia Pacific Osmometer Market Volume (K Unit) Forecast, by Application 2019 & 2032
- Table 163: Global Osmometer Market Revenue Million Forecast, by Product Type 2019 & 2032
- Table 164: Global Osmometer Market Volume K Unit Forecast, by Product Type 2019 & 2032
- Table 165: Global Osmometer Market Revenue Million Forecast, by Sampling Capacity 2019 & 2032
- Table 166: Global Osmometer Market Volume K Unit Forecast, by Sampling Capacity 2019 & 2032
- Table 167: Global Osmometer Market Revenue Million Forecast, by Application 2019 & 2032
- Table 168: Global Osmometer Market Volume K Unit Forecast, by Application 2019 & 2032
- Table 169: Global Osmometer Market Revenue Million Forecast, by End User 2019 & 2032
- Table 170: Global Osmometer Market Volume K Unit Forecast, by End User 2019 & 2032
- Table 171: Global Osmometer Market Revenue Million Forecast, by Country 2019 & 2032
- Table 172: Global Osmometer Market Volume K Unit Forecast, by Country 2019 & 2032
Frequently Asked Questions
1. What is the projected Compound Annual Growth Rate (CAGR) of the Osmometer Market?
The projected CAGR is approximately 15.29%.
2. Which companies are prominent players in the Osmometer Market?
Key companies in the market include ASTORI TECNICA, ELITechGroup, Löser Messtechnik , Nova Biomedical, KNAUER Wissenschaftliche Gerete GmbH, ARKRAY Inc, Precision Systems Inc, Advanced Instruments LLC.
3. What are the main segments of the Osmometer Market?
The market segments include Product Type, Sampling Capacity, Application, End User.
4. Can you provide details about the market size?
The market size is estimated to be USD 149.65 Million as of 2022.
5. What are some drivers contributing to market growth?
Technological Advancements in Osmometers and High Demand for Automation; Growing R&D Investments and Increase in Burden of Various Diseases.
6. What are the notable trends driving market growth?
Freezing Point Osmometers are Expected to have Healthy Growth Rate.
7. Are there any restraints impacting market growth?
Limitations of Osmometers; Dearth of Skilled Professionals.
8. Can you provide examples of recent developments in the market?
September 2022: Trukera Medical announced the launch of the New ScoutPro Osmolarity System.
9. What pricing options are available for accessing the report?
Pricing options include single-user, multi-user, and enterprise licenses priced at USD 4750, USD 5250, and USD 8750 respectively.
10. Is the market size provided in terms of value or volume?
The market size is provided in terms of value, measured in Million and volume, measured in K Unit.
11. Are there any specific market keywords associated with the report?
Yes, the market keyword associated with the report is "Osmometer Market," which aids in identifying and referencing the specific market segment covered.
12. How do I determine which pricing option suits my needs best?
The pricing options vary based on user requirements and access needs. Individual users may opt for single-user licenses, while businesses requiring broader access may choose multi-user or enterprise licenses for cost-effective access to the report.
13. Are there any additional resources or data provided in the Osmometer Market report?
While the report offers comprehensive insights, it's advisable to review the specific contents or supplementary materials provided to ascertain if additional resources or data are available.
14. How can I stay updated on further developments or reports in the Osmometer Market?
To stay informed about further developments, trends, and reports in the Osmometer Market, consider subscribing to industry newsletters, following relevant companies and organizations, or regularly checking reputable industry news sources and publications.
Methodology
Step 1 - Identification of Relevant Samples Size from Population Database


Step 2 - Approaches for Defining Global Market Size (Value, Volume* & Price*)

Note*: In applicable scenarios
Step 3 - Data Sources
Primary Research
- Web Analytics
- Survey Reports
- Research Institute
- Latest Research Reports
- Opinion Leaders
Secondary Research
- Annual Reports
- White Paper
- Latest Press Release
- Industry Association
- Paid Database
- Investor Presentations

Step 4 - Data Triangulation
Involves using different sources of information in order to increase the validity of a study
These sources are likely to be stakeholders in a program - participants, other researchers, program staff, other community members, and so on.
Then we put all data in single framework & apply various statistical tools to find out the dynamic on the market.
During the analysis stage, feedback from the stakeholder groups would be compared to determine areas of agreement as well as areas of divergence


