
Key Insights
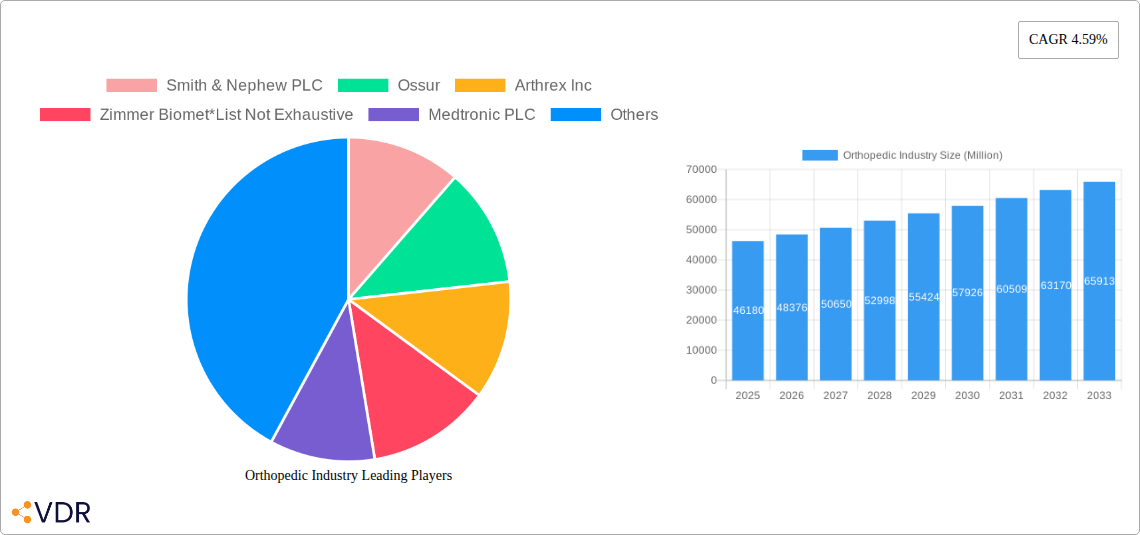
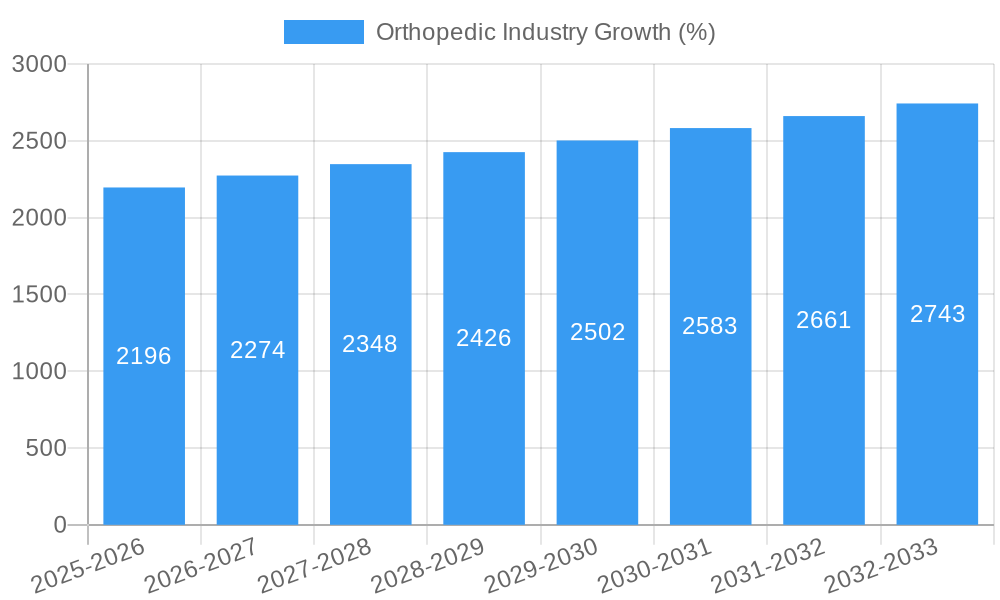
The global orthopedic devices market, valued at $46.18 billion in 2025, is projected to experience robust growth, driven by a rising geriatric population, increasing prevalence of osteoarthritis and other musculoskeletal disorders, technological advancements in minimally invasive surgical techniques, and a growing preference for personalized orthopedic solutions. The compound annual growth rate (CAGR) of 4.59% from 2025 to 2033 indicates a steady expansion, with significant contributions from various application segments. Hip and knee replacement devices continue to dominate the market, owing to high incidence rates of related conditions, but substantial growth is anticipated in spine and trauma fixation devices, fueled by advancements in fusion and biologics technologies. The increasing demand for improved implant designs, enhanced biocompatibility, and shorter recovery times drives innovation within the industry. Furthermore, the expanding adoption of robotic-assisted surgery and 3D printing techniques for personalized implants is expected to further propel market expansion.
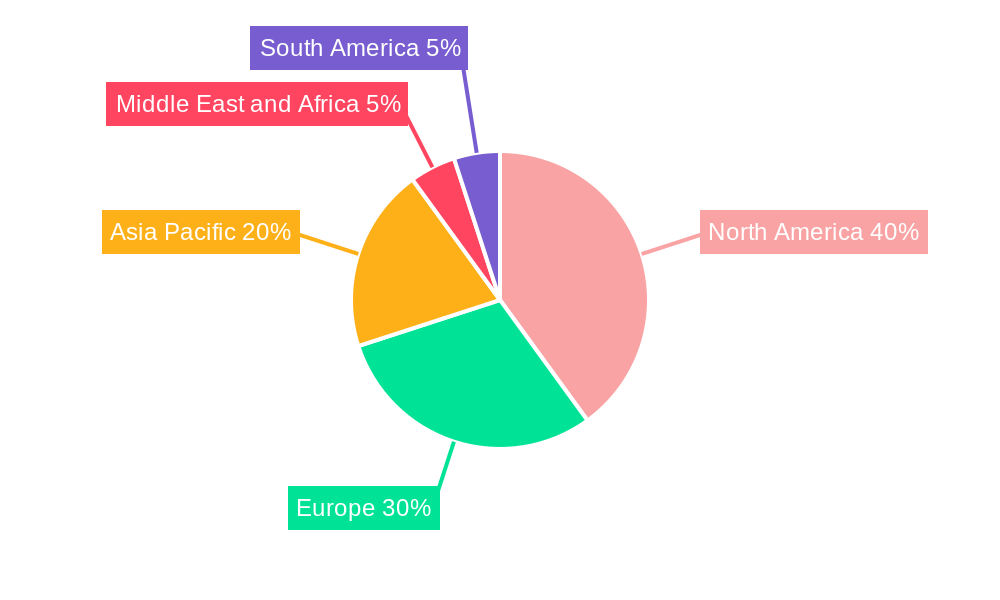
Regional variations in market share are expected, with North America and Europe maintaining significant dominance due to established healthcare infrastructure and high per capita healthcare expenditure. However, rapidly developing economies in Asia-Pacific, particularly China and India, are poised for considerable growth, fueled by rising disposable incomes and increased healthcare awareness. Market restraints include high costs associated with orthopedic procedures, stringent regulatory approvals for new devices, and the potential for complications and revisions post-surgery. Nevertheless, the continued focus on improving patient outcomes, alongside the development of innovative products and treatment strategies, is expected to offset these challenges and contribute to the long-term growth trajectory of the orthopedic devices market.
Orthopedic Industry Market Report: 2019-2033
This comprehensive report provides a detailed analysis of the orthopedic industry, encompassing market dynamics, growth trends, competitive landscape, and future outlook. With a study period spanning 2019-2033, a base year of 2025, and a forecast period of 2025-2033, this report is an indispensable resource for industry professionals, investors, and strategic decision-makers. The report segments the market by application (Hip, Knee, Spine, Trauma Fixation, Dental, and Other Orthopedic Devices), providing granular insights into each segment's performance and future potential. The total market value is predicted to reach xx Million by 2033.
Orthopedic Industry Market Dynamics & Structure
The orthopedic industry is characterized by a moderately consolidated market structure, with a few large multinational corporations holding significant market share. Technological innovation, particularly in minimally invasive surgical techniques and biomaterials, is a key driver of growth. Stringent regulatory frameworks, particularly concerning device safety and efficacy, pose challenges and influence market dynamics. The industry faces competition from substitute products, including non-surgical treatments and regenerative medicine therapies. The aging global population, increasing prevalence of orthopedic conditions, and rising healthcare expenditure are key end-user demographics shaping market demand. Mergers and acquisitions (M&A) activity is frequent, reflecting industry consolidation and the pursuit of technological advancements.
- Market Concentration: Top 5 players hold approximately 55% market share in 2025.
- Technological Innovation: Focus on minimally invasive surgery, 3D printing, and smart implants.
- Regulatory Landscape: Stringent FDA approvals and CE markings impacting timelines and costs.
- Competitive Substitutes: Non-surgical treatments, physical therapy, and regenerative medicine present alternatives.
- M&A Activity: Average of 15 major M&A deals annually in the historical period, expected to increase to 20 in the forecast period.
- Innovation Barriers: High R&D costs, lengthy regulatory approval processes, and intellectual property protection challenges.
Orthopedic Industry Growth Trends & Insights
The orthopedic industry has witnessed robust growth over the past few years, driven by several factors including the aging global population, rising prevalence of chronic conditions, increased affordability of healthcare, and technological advancements that improve patient outcomes. The market size expanded from xx Million in 2019 to xx Million in 2024, exhibiting a CAGR of xx%. This growth trajectory is expected to continue during the forecast period, with the market projected to reach xx Million by 2033. Adoption rates of advanced devices are increasing, particularly minimally invasive surgical techniques and implants with improved biocompatibility. Consumer behavior shifts towards a preference for less invasive procedures and quicker recovery times are also influencing market trends. Technological disruptions, such as the integration of AI and robotics in surgery, are shaping the future of the industry.
Dominant Regions, Countries, or Segments in Orthopedic Industry
The North American orthopedic market holds the largest market share, driven by high healthcare expenditure, advanced medical infrastructure, and a substantial elderly population. Within applications, the knee and hip orthopedic device segments are the largest contributors to overall market value, driven by high incidence of osteoarthritis and a growing preference for joint replacement surgeries. Europe and Asia-Pacific are also witnessing substantial growth, fueled by rising healthcare awareness and increasing investments in healthcare infrastructure.
- Leading Region: North America (Holding approx. 40% of the market share in 2025)
- Largest Segment (By Application): Knee Orthopedic Devices (estimated at xx Million in 2025)
- Key Drivers (North America): High healthcare expenditure, robust insurance coverage, advanced medical infrastructure.
- Key Drivers (Europe): Rising prevalence of osteoarthritis, increasing adoption of minimally invasive surgeries.
- Key Drivers (Asia-Pacific): Rapidly aging population, increasing healthcare awareness, improving medical infrastructure, rising disposable incomes.
Orthopedic Industry Product Landscape
The orthopedic industry offers a diverse range of products, including implants, instruments, and biologics. Recent innovations focus on improving implant design for enhanced biocompatibility, durability, and functionality. Minimally invasive surgical instruments and techniques reduce trauma and recovery time. Smart implants with embedded sensors monitor patient progress and assist surgeons with data-driven decision-making. The development of personalized implants tailored to individual patient anatomy is an emerging trend. Unique selling propositions include improved biointegration, enhanced strength and durability, and reduced surgical invasiveness.
Key Drivers, Barriers & Challenges in Orthopedic Industry
Key Drivers:
- Aging population leading to increased demand for joint replacements.
- Technological advancements resulting in improved implant designs and surgical techniques.
- Rising healthcare expenditure and health insurance coverage expanding access to orthopedic care.
Key Barriers & Challenges:
- High R&D costs and lengthy regulatory approval processes hindering innovation.
- Increasing competition from generic and biosimilar products.
- Supply chain disruptions affecting availability of raw materials and components. This resulted in a xx% increase in the price of titanium alloys in 2022.
- Regulatory scrutiny and safety concerns impacting market access.
Emerging Opportunities in Orthopedic Industry
- Growing demand for minimally invasive surgical procedures and personalized implants.
- Expanding use of 3D printing for customized implants and surgical planning.
- Increasing adoption of robotic surgery and AI-assisted diagnostics in orthopedic care.
- Untapped markets in developing economies with rising disposable incomes.
- Development of innovative biomaterials and regenerative medicine therapies.
Growth Accelerators in the Orthopedic Industry Industry
Technological advancements in biomaterials, surgical techniques, and data analytics are significantly boosting industry growth. Strategic partnerships between device manufacturers and healthcare providers improve access and adoption of advanced technologies. The expansion into emerging markets, particularly in Asia and Latin America, presents significant growth potential. Investment in research and development of innovative products and procedures is further accelerating market expansion.
Key Players Shaping the Orthopedic Industry Market
- Smith & Nephew PLC
- Ossur
- Arthrex Inc
- Zimmer Biomet
- Medtronic PLC
- CTL Amedica
- Globus Medical
- Enovis Corporation
- Johnson & Johnson Inc
- Stryker Corporation
- Boston Scientific Corporation
- ATEC Spine Inc
- B Braun SE
- NuVasive Inc
Notable Milestones in Orthopedic Industry Sector
- October 2023: Enovis acquires Limacorporate, expanding its product portfolio and market reach.
- January 2023: Orthofix Medical launches Mariner Deformity Pedicle Screw System, enhancing its spine surgery offerings.
- March 2022: Exactech launches Equinoxe Humeral Reconstruction Prosthesis in Europe, addressing a significant unmet need.
In-Depth Orthopedic Industry Market Outlook
The orthopedic industry is poised for continued growth driven by technological innovation, expansion into emerging markets, and an aging global population. Strategic partnerships, investments in R&D, and a focus on personalized medicine will further accelerate market expansion. The integration of AI, robotics, and data analytics will redefine surgical procedures and patient care, creating significant opportunities for industry players. The market is expected to see sustained growth, driven by the factors discussed in previous sections, presenting compelling investment and expansion prospects.
Orthopedic Industry Segmentation
-
1. Application
- 1.1. Hip Orthopedic Devices
- 1.2. Knee Orthopedic Devices
- 1.3. Spine Orthopedic Devices
- 1.4. Trauma Fixation Devices
- 1.5. Dental Orthopedic Devices
- 1.6. Other Applications
Orthopedic Industry Segmentation By Geography
-
1. North America
- 1.1. United States
- 1.2. Canada
- 1.3. Mexico
-
2. Europe
- 2.1. Germany
- 2.2. United Kingdom
- 2.3. France
- 2.4. Italy
- 2.5. Spain
- 2.6. Rest of Europe
-
3. Asia Pacific
- 3.1. China
- 3.2. Japan
- 3.3. India
- 3.4. Australia
- 3.5. South Korea
- 3.6. Rest of Asia Pacific
-
4. Middle East and Africa
- 4.1. GCC
- 4.2. South Africa
- 4.3. Rest of Middle East and Africa
-
5. South America
- 5.1. Brazil
- 5.2. Argentina
- 5.3. Rest of South America
Orthopedic Industry REPORT HIGHLIGHTS
| Aspects | Details |
|---|---|
| Study Period | 2019-2033 |
| Base Year | 2024 |
| Estimated Year | 2025 |
| Forecast Period | 2025-2033 |
| Historical Period | 2019-2024 |
| Growth Rate | CAGR of 4.59% from 2019-2033 |
| Segmentation |
|
Table of Contents
- 1. Introduction
- 1.1. Research Scope
- 1.2. Market Segmentation
- 1.3. Research Methodology
- 1.4. Definitions and Assumptions
- 2. Executive Summary
- 2.1. Introduction
- 3. Market Dynamics
- 3.1. Introduction
- 3.2. Market Drivers
- 3.2.1 Increasing Number of Large Joint Reconstruction Surgeries; Growing Burden of Orthopedic Disorders
- 3.2.2 Trauma
- 3.2.3 and Accidents Cases; Development of Bioabsorbable and Titanium Implants
- 3.3. Market Restrains
- 3.3.1. Stringent Regulatory Scenario; Poor Reimbursement Scenario and Lack of Skilled Surgeons
- 3.4. Market Trends
- 3.4.1. Spine Orthopedic Devices Segment Holds the Largest Share in the Market
- 4. Market Factor Analysis
- 4.1. Porters Five Forces
- 4.2. Supply/Value Chain
- 4.3. PESTEL analysis
- 4.4. Market Entropy
- 4.5. Patent/Trademark Analysis
- 5. Global Orthopedic Industry Analysis, Insights and Forecast, 2019-2031
- 5.1. Market Analysis, Insights and Forecast - by Application
- 5.1.1. Hip Orthopedic Devices
- 5.1.2. Knee Orthopedic Devices
- 5.1.3. Spine Orthopedic Devices
- 5.1.4. Trauma Fixation Devices
- 5.1.5. Dental Orthopedic Devices
- 5.1.6. Other Applications
- 5.2. Market Analysis, Insights and Forecast - by Region
- 5.2.1. North America
- 5.2.2. Europe
- 5.2.3. Asia Pacific
- 5.2.4. Middle East and Africa
- 5.2.5. South America
- 5.1. Market Analysis, Insights and Forecast - by Application
- 6. North America Orthopedic Industry Analysis, Insights and Forecast, 2019-2031
- 6.1. Market Analysis, Insights and Forecast - by Application
- 6.1.1. Hip Orthopedic Devices
- 6.1.2. Knee Orthopedic Devices
- 6.1.3. Spine Orthopedic Devices
- 6.1.4. Trauma Fixation Devices
- 6.1.5. Dental Orthopedic Devices
- 6.1.6. Other Applications
- 6.1. Market Analysis, Insights and Forecast - by Application
- 7. Europe Orthopedic Industry Analysis, Insights and Forecast, 2019-2031
- 7.1. Market Analysis, Insights and Forecast - by Application
- 7.1.1. Hip Orthopedic Devices
- 7.1.2. Knee Orthopedic Devices
- 7.1.3. Spine Orthopedic Devices
- 7.1.4. Trauma Fixation Devices
- 7.1.5. Dental Orthopedic Devices
- 7.1.6. Other Applications
- 7.1. Market Analysis, Insights and Forecast - by Application
- 8. Asia Pacific Orthopedic Industry Analysis, Insights and Forecast, 2019-2031
- 8.1. Market Analysis, Insights and Forecast - by Application
- 8.1.1. Hip Orthopedic Devices
- 8.1.2. Knee Orthopedic Devices
- 8.1.3. Spine Orthopedic Devices
- 8.1.4. Trauma Fixation Devices
- 8.1.5. Dental Orthopedic Devices
- 8.1.6. Other Applications
- 8.1. Market Analysis, Insights and Forecast - by Application
- 9. Middle East and Africa Orthopedic Industry Analysis, Insights and Forecast, 2019-2031
- 9.1. Market Analysis, Insights and Forecast - by Application
- 9.1.1. Hip Orthopedic Devices
- 9.1.2. Knee Orthopedic Devices
- 9.1.3. Spine Orthopedic Devices
- 9.1.4. Trauma Fixation Devices
- 9.1.5. Dental Orthopedic Devices
- 9.1.6. Other Applications
- 9.1. Market Analysis, Insights and Forecast - by Application
- 10. South America Orthopedic Industry Analysis, Insights and Forecast, 2019-2031
- 10.1. Market Analysis, Insights and Forecast - by Application
- 10.1.1. Hip Orthopedic Devices
- 10.1.2. Knee Orthopedic Devices
- 10.1.3. Spine Orthopedic Devices
- 10.1.4. Trauma Fixation Devices
- 10.1.5. Dental Orthopedic Devices
- 10.1.6. Other Applications
- 10.1. Market Analysis, Insights and Forecast - by Application
- 11. North America Orthopedic Industry Analysis, Insights and Forecast, 2019-2031
- 11.1. Market Analysis, Insights and Forecast - By Country/Sub-region
- 11.1.1 United States
- 11.1.2 Canada
- 11.1.3 Mexico
- 12. Europe Orthopedic Industry Analysis, Insights and Forecast, 2019-2031
- 12.1. Market Analysis, Insights and Forecast - By Country/Sub-region
- 12.1.1 Germany
- 12.1.2 United Kingdom
- 12.1.3 France
- 12.1.4 Italy
- 12.1.5 Spain
- 12.1.6 Rest of Europe
- 13. Asia Pacific Orthopedic Industry Analysis, Insights and Forecast, 2019-2031
- 13.1. Market Analysis, Insights and Forecast - By Country/Sub-region
- 13.1.1 China
- 13.1.2 Japan
- 13.1.3 India
- 13.1.4 Australia
- 13.1.5 South Korea
- 13.1.6 Rest of Asia Pacific
- 14. Middle East and Africa Orthopedic Industry Analysis, Insights and Forecast, 2019-2031
- 14.1. Market Analysis, Insights and Forecast - By Country/Sub-region
- 14.1.1 GCC
- 14.1.2 South Africa
- 14.1.3 Rest of Middle East and Africa
- 15. South America Orthopedic Industry Analysis, Insights and Forecast, 2019-2031
- 15.1. Market Analysis, Insights and Forecast - By Country/Sub-region
- 15.1.1 Brazil
- 15.1.2 Argentina
- 15.1.3 Rest of South America
- 16. Competitive Analysis
- 16.1. Global Market Share Analysis 2024
- 16.2. Company Profiles
- 16.2.1 Smith & Nephew PLC
- 16.2.1.1. Overview
- 16.2.1.2. Products
- 16.2.1.3. SWOT Analysis
- 16.2.1.4. Recent Developments
- 16.2.1.5. Financials (Based on Availability)
- 16.2.2 Ossur
- 16.2.2.1. Overview
- 16.2.2.2. Products
- 16.2.2.3. SWOT Analysis
- 16.2.2.4. Recent Developments
- 16.2.2.5. Financials (Based on Availability)
- 16.2.3 Arthrex Inc
- 16.2.3.1. Overview
- 16.2.3.2. Products
- 16.2.3.3. SWOT Analysis
- 16.2.3.4. Recent Developments
- 16.2.3.5. Financials (Based on Availability)
- 16.2.4 Zimmer Biomet*List Not Exhaustive
- 16.2.4.1. Overview
- 16.2.4.2. Products
- 16.2.4.3. SWOT Analysis
- 16.2.4.4. Recent Developments
- 16.2.4.5. Financials (Based on Availability)
- 16.2.5 Medtronic PLC
- 16.2.5.1. Overview
- 16.2.5.2. Products
- 16.2.5.3. SWOT Analysis
- 16.2.5.4. Recent Developments
- 16.2.5.5. Financials (Based on Availability)
- 16.2.6 CTL Amedica
- 16.2.6.1. Overview
- 16.2.6.2. Products
- 16.2.6.3. SWOT Analysis
- 16.2.6.4. Recent Developments
- 16.2.6.5. Financials (Based on Availability)
- 16.2.7 Globus Medical
- 16.2.7.1. Overview
- 16.2.7.2. Products
- 16.2.7.3. SWOT Analysis
- 16.2.7.4. Recent Developments
- 16.2.7.5. Financials (Based on Availability)
- 16.2.8 Enovis Corporation
- 16.2.8.1. Overview
- 16.2.8.2. Products
- 16.2.8.3. SWOT Analysis
- 16.2.8.4. Recent Developments
- 16.2.8.5. Financials (Based on Availability)
- 16.2.9 Johnson & Johnson Inc
- 16.2.9.1. Overview
- 16.2.9.2. Products
- 16.2.9.3. SWOT Analysis
- 16.2.9.4. Recent Developments
- 16.2.9.5. Financials (Based on Availability)
- 16.2.10 Stryker Corporation
- 16.2.10.1. Overview
- 16.2.10.2. Products
- 16.2.10.3. SWOT Analysis
- 16.2.10.4. Recent Developments
- 16.2.10.5. Financials (Based on Availability)
- 16.2.11 Boston Scientific Corporation
- 16.2.11.1. Overview
- 16.2.11.2. Products
- 16.2.11.3. SWOT Analysis
- 16.2.11.4. Recent Developments
- 16.2.11.5. Financials (Based on Availability)
- 16.2.12 ATEC Spine Inc
- 16.2.12.1. Overview
- 16.2.12.2. Products
- 16.2.12.3. SWOT Analysis
- 16.2.12.4. Recent Developments
- 16.2.12.5. Financials (Based on Availability)
- 16.2.13 B Braun SE
- 16.2.13.1. Overview
- 16.2.13.2. Products
- 16.2.13.3. SWOT Analysis
- 16.2.13.4. Recent Developments
- 16.2.13.5. Financials (Based on Availability)
- 16.2.14 NuVasive Inc
- 16.2.14.1. Overview
- 16.2.14.2. Products
- 16.2.14.3. SWOT Analysis
- 16.2.14.4. Recent Developments
- 16.2.14.5. Financials (Based on Availability)
- 16.2.1 Smith & Nephew PLC
List of Figures
- Figure 1: Global Orthopedic Industry Revenue Breakdown (Million, %) by Region 2024 & 2032
- Figure 2: North America Orthopedic Industry Revenue (Million), by Country 2024 & 2032
- Figure 3: North America Orthopedic Industry Revenue Share (%), by Country 2024 & 2032
- Figure 4: Europe Orthopedic Industry Revenue (Million), by Country 2024 & 2032
- Figure 5: Europe Orthopedic Industry Revenue Share (%), by Country 2024 & 2032
- Figure 6: Asia Pacific Orthopedic Industry Revenue (Million), by Country 2024 & 2032
- Figure 7: Asia Pacific Orthopedic Industry Revenue Share (%), by Country 2024 & 2032
- Figure 8: Middle East and Africa Orthopedic Industry Revenue (Million), by Country 2024 & 2032
- Figure 9: Middle East and Africa Orthopedic Industry Revenue Share (%), by Country 2024 & 2032
- Figure 10: South America Orthopedic Industry Revenue (Million), by Country 2024 & 2032
- Figure 11: South America Orthopedic Industry Revenue Share (%), by Country 2024 & 2032
- Figure 12: North America Orthopedic Industry Revenue (Million), by Application 2024 & 2032
- Figure 13: North America Orthopedic Industry Revenue Share (%), by Application 2024 & 2032
- Figure 14: North America Orthopedic Industry Revenue (Million), by Country 2024 & 2032
- Figure 15: North America Orthopedic Industry Revenue Share (%), by Country 2024 & 2032
- Figure 16: Europe Orthopedic Industry Revenue (Million), by Application 2024 & 2032
- Figure 17: Europe Orthopedic Industry Revenue Share (%), by Application 2024 & 2032
- Figure 18: Europe Orthopedic Industry Revenue (Million), by Country 2024 & 2032
- Figure 19: Europe Orthopedic Industry Revenue Share (%), by Country 2024 & 2032
- Figure 20: Asia Pacific Orthopedic Industry Revenue (Million), by Application 2024 & 2032
- Figure 21: Asia Pacific Orthopedic Industry Revenue Share (%), by Application 2024 & 2032
- Figure 22: Asia Pacific Orthopedic Industry Revenue (Million), by Country 2024 & 2032
- Figure 23: Asia Pacific Orthopedic Industry Revenue Share (%), by Country 2024 & 2032
- Figure 24: Middle East and Africa Orthopedic Industry Revenue (Million), by Application 2024 & 2032
- Figure 25: Middle East and Africa Orthopedic Industry Revenue Share (%), by Application 2024 & 2032
- Figure 26: Middle East and Africa Orthopedic Industry Revenue (Million), by Country 2024 & 2032
- Figure 27: Middle East and Africa Orthopedic Industry Revenue Share (%), by Country 2024 & 2032
- Figure 28: South America Orthopedic Industry Revenue (Million), by Application 2024 & 2032
- Figure 29: South America Orthopedic Industry Revenue Share (%), by Application 2024 & 2032
- Figure 30: South America Orthopedic Industry Revenue (Million), by Country 2024 & 2032
- Figure 31: South America Orthopedic Industry Revenue Share (%), by Country 2024 & 2032
List of Tables
- Table 1: Global Orthopedic Industry Revenue Million Forecast, by Region 2019 & 2032
- Table 2: Global Orthopedic Industry Revenue Million Forecast, by Application 2019 & 2032
- Table 3: Global Orthopedic Industry Revenue Million Forecast, by Region 2019 & 2032
- Table 4: Global Orthopedic Industry Revenue Million Forecast, by Country 2019 & 2032
- Table 5: United States Orthopedic Industry Revenue (Million) Forecast, by Application 2019 & 2032
- Table 6: Canada Orthopedic Industry Revenue (Million) Forecast, by Application 2019 & 2032
- Table 7: Mexico Orthopedic Industry Revenue (Million) Forecast, by Application 2019 & 2032
- Table 8: Global Orthopedic Industry Revenue Million Forecast, by Country 2019 & 2032
- Table 9: Germany Orthopedic Industry Revenue (Million) Forecast, by Application 2019 & 2032
- Table 10: United Kingdom Orthopedic Industry Revenue (Million) Forecast, by Application 2019 & 2032
- Table 11: France Orthopedic Industry Revenue (Million) Forecast, by Application 2019 & 2032
- Table 12: Italy Orthopedic Industry Revenue (Million) Forecast, by Application 2019 & 2032
- Table 13: Spain Orthopedic Industry Revenue (Million) Forecast, by Application 2019 & 2032
- Table 14: Rest of Europe Orthopedic Industry Revenue (Million) Forecast, by Application 2019 & 2032
- Table 15: Global Orthopedic Industry Revenue Million Forecast, by Country 2019 & 2032
- Table 16: China Orthopedic Industry Revenue (Million) Forecast, by Application 2019 & 2032
- Table 17: Japan Orthopedic Industry Revenue (Million) Forecast, by Application 2019 & 2032
- Table 18: India Orthopedic Industry Revenue (Million) Forecast, by Application 2019 & 2032
- Table 19: Australia Orthopedic Industry Revenue (Million) Forecast, by Application 2019 & 2032
- Table 20: South Korea Orthopedic Industry Revenue (Million) Forecast, by Application 2019 & 2032
- Table 21: Rest of Asia Pacific Orthopedic Industry Revenue (Million) Forecast, by Application 2019 & 2032
- Table 22: Global Orthopedic Industry Revenue Million Forecast, by Country 2019 & 2032
- Table 23: GCC Orthopedic Industry Revenue (Million) Forecast, by Application 2019 & 2032
- Table 24: South Africa Orthopedic Industry Revenue (Million) Forecast, by Application 2019 & 2032
- Table 25: Rest of Middle East and Africa Orthopedic Industry Revenue (Million) Forecast, by Application 2019 & 2032
- Table 26: Global Orthopedic Industry Revenue Million Forecast, by Country 2019 & 2032
- Table 27: Brazil Orthopedic Industry Revenue (Million) Forecast, by Application 2019 & 2032
- Table 28: Argentina Orthopedic Industry Revenue (Million) Forecast, by Application 2019 & 2032
- Table 29: Rest of South America Orthopedic Industry Revenue (Million) Forecast, by Application 2019 & 2032
- Table 30: Global Orthopedic Industry Revenue Million Forecast, by Application 2019 & 2032
- Table 31: Global Orthopedic Industry Revenue Million Forecast, by Country 2019 & 2032
- Table 32: United States Orthopedic Industry Revenue (Million) Forecast, by Application 2019 & 2032
- Table 33: Canada Orthopedic Industry Revenue (Million) Forecast, by Application 2019 & 2032
- Table 34: Mexico Orthopedic Industry Revenue (Million) Forecast, by Application 2019 & 2032
- Table 35: Global Orthopedic Industry Revenue Million Forecast, by Application 2019 & 2032
- Table 36: Global Orthopedic Industry Revenue Million Forecast, by Country 2019 & 2032
- Table 37: Germany Orthopedic Industry Revenue (Million) Forecast, by Application 2019 & 2032
- Table 38: United Kingdom Orthopedic Industry Revenue (Million) Forecast, by Application 2019 & 2032
- Table 39: France Orthopedic Industry Revenue (Million) Forecast, by Application 2019 & 2032
- Table 40: Italy Orthopedic Industry Revenue (Million) Forecast, by Application 2019 & 2032
- Table 41: Spain Orthopedic Industry Revenue (Million) Forecast, by Application 2019 & 2032
- Table 42: Rest of Europe Orthopedic Industry Revenue (Million) Forecast, by Application 2019 & 2032
- Table 43: Global Orthopedic Industry Revenue Million Forecast, by Application 2019 & 2032
- Table 44: Global Orthopedic Industry Revenue Million Forecast, by Country 2019 & 2032
- Table 45: China Orthopedic Industry Revenue (Million) Forecast, by Application 2019 & 2032
- Table 46: Japan Orthopedic Industry Revenue (Million) Forecast, by Application 2019 & 2032
- Table 47: India Orthopedic Industry Revenue (Million) Forecast, by Application 2019 & 2032
- Table 48: Australia Orthopedic Industry Revenue (Million) Forecast, by Application 2019 & 2032
- Table 49: South Korea Orthopedic Industry Revenue (Million) Forecast, by Application 2019 & 2032
- Table 50: Rest of Asia Pacific Orthopedic Industry Revenue (Million) Forecast, by Application 2019 & 2032
- Table 51: Global Orthopedic Industry Revenue Million Forecast, by Application 2019 & 2032
- Table 52: Global Orthopedic Industry Revenue Million Forecast, by Country 2019 & 2032
- Table 53: GCC Orthopedic Industry Revenue (Million) Forecast, by Application 2019 & 2032
- Table 54: South Africa Orthopedic Industry Revenue (Million) Forecast, by Application 2019 & 2032
- Table 55: Rest of Middle East and Africa Orthopedic Industry Revenue (Million) Forecast, by Application 2019 & 2032
- Table 56: Global Orthopedic Industry Revenue Million Forecast, by Application 2019 & 2032
- Table 57: Global Orthopedic Industry Revenue Million Forecast, by Country 2019 & 2032
- Table 58: Brazil Orthopedic Industry Revenue (Million) Forecast, by Application 2019 & 2032
- Table 59: Argentina Orthopedic Industry Revenue (Million) Forecast, by Application 2019 & 2032
- Table 60: Rest of South America Orthopedic Industry Revenue (Million) Forecast, by Application 2019 & 2032
Frequently Asked Questions
1. What is the projected Compound Annual Growth Rate (CAGR) of the Orthopedic Industry?
The projected CAGR is approximately 4.59%.
2. Which companies are prominent players in the Orthopedic Industry?
Key companies in the market include Smith & Nephew PLC, Ossur, Arthrex Inc, Zimmer Biomet*List Not Exhaustive, Medtronic PLC, CTL Amedica, Globus Medical, Enovis Corporation, Johnson & Johnson Inc, Stryker Corporation, Boston Scientific Corporation, ATEC Spine Inc, B Braun SE, NuVasive Inc.
3. What are the main segments of the Orthopedic Industry?
The market segments include Application.
4. Can you provide details about the market size?
The market size is estimated to be USD 46.18 Million as of 2022.
5. What are some drivers contributing to market growth?
Increasing Number of Large Joint Reconstruction Surgeries; Growing Burden of Orthopedic Disorders. Trauma. and Accidents Cases; Development of Bioabsorbable and Titanium Implants.
6. What are the notable trends driving market growth?
Spine Orthopedic Devices Segment Holds the Largest Share in the Market.
7. Are there any restraints impacting market growth?
Stringent Regulatory Scenario; Poor Reimbursement Scenario and Lack of Skilled Surgeons.
8. Can you provide examples of recent developments in the market?
In October 2023, Enovis, a United States-based medical technology company focused on orthopedics, acquired Italian orthopedic player Limacorporate S.p.A. This Italian company specializes in manufacturing implants used in shoulder, knee, elbow, and hip surgeries.
9. What pricing options are available for accessing the report?
Pricing options include single-user, multi-user, and enterprise licenses priced at USD 4750, USD 5250, and USD 8750 respectively.
10. Is the market size provided in terms of value or volume?
The market size is provided in terms of value, measured in Million.
11. Are there any specific market keywords associated with the report?
Yes, the market keyword associated with the report is "Orthopedic Industry," which aids in identifying and referencing the specific market segment covered.
12. How do I determine which pricing option suits my needs best?
The pricing options vary based on user requirements and access needs. Individual users may opt for single-user licenses, while businesses requiring broader access may choose multi-user or enterprise licenses for cost-effective access to the report.
13. Are there any additional resources or data provided in the Orthopedic Industry report?
While the report offers comprehensive insights, it's advisable to review the specific contents or supplementary materials provided to ascertain if additional resources or data are available.
14. How can I stay updated on further developments or reports in the Orthopedic Industry?
To stay informed about further developments, trends, and reports in the Orthopedic Industry, consider subscribing to industry newsletters, following relevant companies and organizations, or regularly checking reputable industry news sources and publications.
Methodology
Step 1 - Identification of Relevant Samples Size from Population Database


Step 2 - Approaches for Defining Global Market Size (Value, Volume* & Price*)

Note*: In applicable scenarios
Step 3 - Data Sources
Primary Research
- Web Analytics
- Survey Reports
- Research Institute
- Latest Research Reports
- Opinion Leaders
Secondary Research
- Annual Reports
- White Paper
- Latest Press Release
- Industry Association
- Paid Database
- Investor Presentations

Step 4 - Data Triangulation
Involves using different sources of information in order to increase the validity of a study
These sources are likely to be stakeholders in a program - participants, other researchers, program staff, other community members, and so on.
Then we put all data in single framework & apply various statistical tools to find out the dynamic on the market.
During the analysis stage, feedback from the stakeholder groups would be compared to determine areas of agreement as well as areas of divergence


